Free Statistics

of Irreproducible Research!

Author's title

Author*The author of this computation has been verified*
R Software Modulerwasp_arimabackwardselection.wasp
Title produced by softwareARIMA Backward Selection
Date of computationThu, 11 Dec 2014 13:10:51 +0000
Cite this page as followsStatistical Computations at FreeStatistics.org, Office for Research Development and Education, URL https://freestatistics.org/blog/index.php?v=date/2014/Dec/11/t1418303573u01c5g564ze4kap.htm/, Retrieved Thu, 31 Oct 2024 23:59:05 +0000
Statistical Computations at FreeStatistics.org, Office for Research Development and Education, URL https://freestatistics.org/blog/index.php?pk=265955, Retrieved Thu, 31 Oct 2024 23:59:05 +0000
QR Codes:

Original text written by user:
IsPrivate?No (this computation is public)
User-defined keywords
Estimated Impact114
Family? (F = Feedback message, R = changed R code, M = changed R Module, P = changed Parameters, D = changed Data)
-       [ARIMA Backward Selection] [Backwards ARIMA] [2014-12-11 13:10:51] [10320d42b3a1ca1321e6e126fa928a8a] [Current]
- RM D    [Skewness and Kurtosis Test] [Skewness/kurtosis] [2014-12-11 13:22:08] [9ecaa0fefb0ae88b4782d69916cabb9e]
- RM      [ARIMA Forecasting] [ARIMA forecasting] [2014-12-11 13:32:26] [9ecaa0fefb0ae88b4782d69916cabb9e]
Feedback Forum

Post a new message
Dataseries X:
9769
9321
9939
9336
10195
9464
10010
10213
9563
9890
9305
9391
9928
8686
9843
9627
10074
9503
10119
10000
9313
9866
9172
9241
9659
8904
9755
9080
9435
8971
10063
9793
9454
9759
8820
9403
9676
8642
9402
9610
9294
9448
10319
9548
9801
9596
8923
9746
9829
9125
9782
9441
9162
9915
10444
10209
9985
9842
9429
10132
9849
9172
10313
9819
9955
10048
10082
10541
10208
10233
9439
9963
10158
9225
10474
9757
10490
10281
10444
10640
10695
10786
9832
9747
10411
9511
10402
9701
10540
10112
10915
11183
10384
10834
9886
10216
10943
9867
10203
10837
10573
10647
11502
10656
10866
10835
9945
10331
10718
9462
10579
10633
10346
10757
11207
11013
11015
10765
10042
10661


Summary of computational transaction
Raw Inputview raw input (R code)
Raw Outputview raw output of R engine
Computing time4 seconds
R Server'Sir Ronald Aylmer Fisher' @ fisher.wessa.net

\begin{tabular}{lllllllll}
\hline
Summary of computational transaction \tabularnewline
Raw Input & view raw input (R code)  \tabularnewline
Raw Output & view raw output of R engine  \tabularnewline
Computing time & 4 seconds \tabularnewline
R Server & 'Sir Ronald Aylmer Fisher' @ fisher.wessa.net \tabularnewline
\hline
\end{tabular}
%Source: https://freestatistics.org/blog/index.php?pk=265955&T=0

[TABLE]
[ROW][C]Summary of computational transaction[/C][/ROW]
[ROW][C]Raw Input[/C][C]view raw input (R code) [/C][/ROW]
[ROW][C]Raw Output[/C][C]view raw output of R engine [/C][/ROW]
[ROW][C]Computing time[/C][C]4 seconds[/C][/ROW]
[ROW][C]R Server[/C][C]'Sir Ronald Aylmer Fisher' @ fisher.wessa.net[/C][/ROW]
[/TABLE]
Source: https://freestatistics.org/blog/index.php?pk=265955&T=0

Globally Unique Identifier (entire table): ba.freestatistics.org/blog/index.php?pk=265955&T=0

As an alternative you can also use a QR Code:  

The GUIDs for individual cells are displayed in the table below:

Summary of computational transaction
Raw Inputview raw input (R code)
Raw Outputview raw output of R engine
Computing time4 seconds
R Server'Sir Ronald Aylmer Fisher' @ fisher.wessa.net


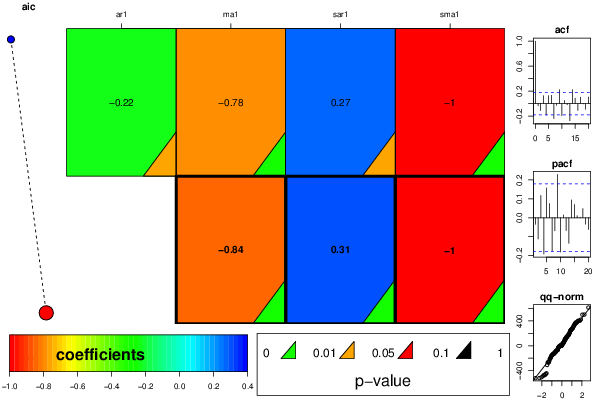
ARIMA Parameter Estimation and Backward Selection
Iterationar1ma1sar1sma1
Estimates ( 1 )-0.2171-0.77720.2705-1
(p-val)(0.0498 )(0 )(0.0178 )(3e-04 )
Estimates ( 2 )0-0.83750.3107-1
(p-val)(NA )(0 )(0.0065 )(0 )
Estimates ( 3 )NANANANA
(p-val)(NA )(NA )(NA )(NA )
Estimates ( 4 )NANANANA
(p-val)(NA )(NA )(NA )(NA )
Estimates ( 5 )NANANANA
(p-val)(NA )(NA )(NA )(NA )
Estimates ( 6 )NANANANA
(p-val)(NA )(NA )(NA )(NA )
Estimates ( 7 )NANANANA
(p-val)(NA )(NA )(NA )(NA )

\begin{tabular}{lllllllll}
\hline
ARIMA Parameter Estimation and Backward Selection \tabularnewline
Iteration & ar1 & ma1 & sar1 & sma1 \tabularnewline
Estimates ( 1 ) & -0.2171 & -0.7772 & 0.2705 & -1 \tabularnewline
(p-val) & (0.0498 ) & (0 ) & (0.0178 ) & (3e-04 ) \tabularnewline
Estimates ( 2 ) & 0 & -0.8375 & 0.3107 & -1 \tabularnewline
(p-val) & (NA ) & (0 ) & (0.0065 ) & (0 ) \tabularnewline
Estimates ( 3 ) & NA & NA & NA & NA \tabularnewline
(p-val) & (NA ) & (NA ) & (NA ) & (NA ) \tabularnewline
Estimates ( 4 ) & NA & NA & NA & NA \tabularnewline
(p-val) & (NA ) & (NA ) & (NA ) & (NA ) \tabularnewline
Estimates ( 5 ) & NA & NA & NA & NA \tabularnewline
(p-val) & (NA ) & (NA ) & (NA ) & (NA ) \tabularnewline
Estimates ( 6 ) & NA & NA & NA & NA \tabularnewline
(p-val) & (NA ) & (NA ) & (NA ) & (NA ) \tabularnewline
Estimates ( 7 ) & NA & NA & NA & NA \tabularnewline
(p-val) & (NA ) & (NA ) & (NA ) & (NA ) \tabularnewline
\hline
\end{tabular}
%Source: https://freestatistics.org/blog/index.php?pk=265955&T=1

[TABLE]
[ROW][C]ARIMA Parameter Estimation and Backward Selection[/C][/ROW]
[ROW][C]Iteration[/C][C]ar1[/C][C]ma1[/C][C]sar1[/C][C]sma1[/C][/ROW]
[ROW][C]Estimates ( 1 )[/C][C]-0.2171[/C][C]-0.7772[/C][C]0.2705[/C][C]-1[/C][/ROW]
[ROW][C](p-val)[/C][C](0.0498 )[/C][C](0 )[/C][C](0.0178 )[/C][C](3e-04 )[/C][/ROW]
[ROW][C]Estimates ( 2 )[/C][C]0[/C][C]-0.8375[/C][C]0.3107[/C][C]-1[/C][/ROW]
[ROW][C](p-val)[/C][C](NA )[/C][C](0 )[/C][C](0.0065 )[/C][C](0 )[/C][/ROW]
[ROW][C]Estimates ( 3 )[/C][C]NA[/C][C]NA[/C][C]NA[/C][C]NA[/C][/ROW]
[ROW][C](p-val)[/C][C](NA )[/C][C](NA )[/C][C](NA )[/C][C](NA )[/C][/ROW]
[ROW][C]Estimates ( 4 )[/C][C]NA[/C][C]NA[/C][C]NA[/C][C]NA[/C][/ROW]
[ROW][C](p-val)[/C][C](NA )[/C][C](NA )[/C][C](NA )[/C][C](NA )[/C][/ROW]
[ROW][C]Estimates ( 5 )[/C][C]NA[/C][C]NA[/C][C]NA[/C][C]NA[/C][/ROW]
[ROW][C](p-val)[/C][C](NA )[/C][C](NA )[/C][C](NA )[/C][C](NA )[/C][/ROW]
[ROW][C]Estimates ( 6 )[/C][C]NA[/C][C]NA[/C][C]NA[/C][C]NA[/C][/ROW]
[ROW][C](p-val)[/C][C](NA )[/C][C](NA )[/C][C](NA )[/C][C](NA )[/C][/ROW]
[ROW][C]Estimates ( 7 )[/C][C]NA[/C][C]NA[/C][C]NA[/C][C]NA[/C][/ROW]
[ROW][C](p-val)[/C][C](NA )[/C][C](NA )[/C][C](NA )[/C][C](NA )[/C][/ROW]
[/TABLE]
Source: https://freestatistics.org/blog/index.php?pk=265955&T=1

Globally Unique Identifier (entire table): ba.freestatistics.org/blog/index.php?pk=265955&T=1

As an alternative you can also use a QR Code:  

The GUIDs for individual cells are displayed in the table below:

ARIMA Parameter Estimation and Backward Selection
Iterationar1ma1sar1sma1
Estimates ( 1 )-0.2171-0.77720.2705-1
(p-val)(0.0498 )(0 )(0.0178 )(3e-04 )
Estimates ( 2 )0-0.83750.3107-1
(p-val)(NA )(0 )(0.0065 )(0 )
Estimates ( 3 )NANANANA
(p-val)(NA )(NA )(NA )(NA )
Estimates ( 4 )NANANANA
(p-val)(NA )(NA )(NA )(NA )
Estimates ( 5 )NANANANA
(p-val)(NA )(NA )(NA )(NA )
Estimates ( 6 )NANANANA
(p-val)(NA )(NA )(NA )(NA )
Estimates ( 7 )NANANANA
(p-val)(NA )(NA )(NA )(NA )


Estimated ARIMA Residuals
Value
-33.1580498543655
-443.463502748729
44.3826676177066
404.110080049758
31.3275839424692
78.0879635495185
141.214633759356
-135.161567272326
-188.509765799778
26.8947116046199
-22.8534107447811
-68.9232512216089
-66.3170005557754
113.934091656426
28.8634415422418
-267.897143666817
-470.311822271655
-266.227799270128
253.297484103109
59.7941032219814
282.814322673374
139.401107108645
-163.24872765987
241.860015345897
183.766675682122
-112.779954162146
-214.854236405482
502.775413517599
-192.763101429877
322.137028924729
402.326569830178
-267.543899354807
325.499959024889
-105.52954164063
-78.6561755857587
372.533864029044
173.000045444629
266.193309768303
108.831370104005
-105.457526882147
-507.904839647209
422.088992376698
279.588121070765
303.349366811329
219.741163538862
-62.5598938423811
164.26920095811
347.321564685995
-152.18309224748
-123.82466977268
282.739824458475
157.898527426025
137.13056397737
113.782310612005
-487.812494184674
119.370093318938
207.836771020399
109.476959488334
-122.900347941277
-135.686754882965
40.4777376263017
-103.863876801136
171.164601172498
-93.7152099971705
355.273195397157
265.120831330895
-70.0824987992847
7.41363481323158
403.134759378225
372.237449473188
61.1486604315705
-521.625079632494
-76.8904440166803
-14.9289032171026
-133.584259470502
-309.621931129702
99.0320818387543
-72.9753854519398
242.209189548956
500.80029148504
-134.988882704608
71.9966850447962
-28.2743297344602
33.7218384168581
374.772513910338
141.823450135368
-470.411687489394
616.808314972185
-16.6830836152568
152.28191652502
385.458976748908
-520.32489018406
69.8784136389996
-80.6493503613757
-203.116395283892
-150.510492856983
-155.017285415975
-453.626193193095
-16.7438323597717
169.432997021546
-247.843664166786
205.043446656466
42.8815394083958
114.883911399148
256.201072669166
-106.709667422864
-83.8961873667033
180.182443418939

\begin{tabular}{lllllllll}
\hline
Estimated ARIMA Residuals \tabularnewline
Value \tabularnewline
-33.1580498543655 \tabularnewline
-443.463502748729 \tabularnewline
44.3826676177066 \tabularnewline
404.110080049758 \tabularnewline
31.3275839424692 \tabularnewline
78.0879635495185 \tabularnewline
141.214633759356 \tabularnewline
-135.161567272326 \tabularnewline
-188.509765799778 \tabularnewline
26.8947116046199 \tabularnewline
-22.8534107447811 \tabularnewline
-68.9232512216089 \tabularnewline
-66.3170005557754 \tabularnewline
113.934091656426 \tabularnewline
28.8634415422418 \tabularnewline
-267.897143666817 \tabularnewline
-470.311822271655 \tabularnewline
-266.227799270128 \tabularnewline
253.297484103109 \tabularnewline
59.7941032219814 \tabularnewline
282.814322673374 \tabularnewline
139.401107108645 \tabularnewline
-163.24872765987 \tabularnewline
241.860015345897 \tabularnewline
183.766675682122 \tabularnewline
-112.779954162146 \tabularnewline
-214.854236405482 \tabularnewline
502.775413517599 \tabularnewline
-192.763101429877 \tabularnewline
322.137028924729 \tabularnewline
402.326569830178 \tabularnewline
-267.543899354807 \tabularnewline
325.499959024889 \tabularnewline
-105.52954164063 \tabularnewline
-78.6561755857587 \tabularnewline
372.533864029044 \tabularnewline
173.000045444629 \tabularnewline
266.193309768303 \tabularnewline
108.831370104005 \tabularnewline
-105.457526882147 \tabularnewline
-507.904839647209 \tabularnewline
422.088992376698 \tabularnewline
279.588121070765 \tabularnewline
303.349366811329 \tabularnewline
219.741163538862 \tabularnewline
-62.5598938423811 \tabularnewline
164.26920095811 \tabularnewline
347.321564685995 \tabularnewline
-152.18309224748 \tabularnewline
-123.82466977268 \tabularnewline
282.739824458475 \tabularnewline
157.898527426025 \tabularnewline
137.13056397737 \tabularnewline
113.782310612005 \tabularnewline
-487.812494184674 \tabularnewline
119.370093318938 \tabularnewline
207.836771020399 \tabularnewline
109.476959488334 \tabularnewline
-122.900347941277 \tabularnewline
-135.686754882965 \tabularnewline
40.4777376263017 \tabularnewline
-103.863876801136 \tabularnewline
171.164601172498 \tabularnewline
-93.7152099971705 \tabularnewline
355.273195397157 \tabularnewline
265.120831330895 \tabularnewline
-70.0824987992847 \tabularnewline
7.41363481323158 \tabularnewline
403.134759378225 \tabularnewline
372.237449473188 \tabularnewline
61.1486604315705 \tabularnewline
-521.625079632494 \tabularnewline
-76.8904440166803 \tabularnewline
-14.9289032171026 \tabularnewline
-133.584259470502 \tabularnewline
-309.621931129702 \tabularnewline
99.0320818387543 \tabularnewline
-72.9753854519398 \tabularnewline
242.209189548956 \tabularnewline
500.80029148504 \tabularnewline
-134.988882704608 \tabularnewline
71.9966850447962 \tabularnewline
-28.2743297344602 \tabularnewline
33.7218384168581 \tabularnewline
374.772513910338 \tabularnewline
141.823450135368 \tabularnewline
-470.411687489394 \tabularnewline
616.808314972185 \tabularnewline
-16.6830836152568 \tabularnewline
152.28191652502 \tabularnewline
385.458976748908 \tabularnewline
-520.32489018406 \tabularnewline
69.8784136389996 \tabularnewline
-80.6493503613757 \tabularnewline
-203.116395283892 \tabularnewline
-150.510492856983 \tabularnewline
-155.017285415975 \tabularnewline
-453.626193193095 \tabularnewline
-16.7438323597717 \tabularnewline
169.432997021546 \tabularnewline
-247.843664166786 \tabularnewline
205.043446656466 \tabularnewline
42.8815394083958 \tabularnewline
114.883911399148 \tabularnewline
256.201072669166 \tabularnewline
-106.709667422864 \tabularnewline
-83.8961873667033 \tabularnewline
180.182443418939 \tabularnewline
\hline
\end{tabular}
%Source: https://freestatistics.org/blog/index.php?pk=265955&T=2

[TABLE]
[ROW][C]Estimated ARIMA Residuals[/C][/ROW]
[ROW][C]Value[/C][/ROW]
[ROW][C]-33.1580498543655[/C][/ROW]
[ROW][C]-443.463502748729[/C][/ROW]
[ROW][C]44.3826676177066[/C][/ROW]
[ROW][C]404.110080049758[/C][/ROW]
[ROW][C]31.3275839424692[/C][/ROW]
[ROW][C]78.0879635495185[/C][/ROW]
[ROW][C]141.214633759356[/C][/ROW]
[ROW][C]-135.161567272326[/C][/ROW]
[ROW][C]-188.509765799778[/C][/ROW]
[ROW][C]26.8947116046199[/C][/ROW]
[ROW][C]-22.8534107447811[/C][/ROW]
[ROW][C]-68.9232512216089[/C][/ROW]
[ROW][C]-66.3170005557754[/C][/ROW]
[ROW][C]113.934091656426[/C][/ROW]
[ROW][C]28.8634415422418[/C][/ROW]
[ROW][C]-267.897143666817[/C][/ROW]
[ROW][C]-470.311822271655[/C][/ROW]
[ROW][C]-266.227799270128[/C][/ROW]
[ROW][C]253.297484103109[/C][/ROW]
[ROW][C]59.7941032219814[/C][/ROW]
[ROW][C]282.814322673374[/C][/ROW]
[ROW][C]139.401107108645[/C][/ROW]
[ROW][C]-163.24872765987[/C][/ROW]
[ROW][C]241.860015345897[/C][/ROW]
[ROW][C]183.766675682122[/C][/ROW]
[ROW][C]-112.779954162146[/C][/ROW]
[ROW][C]-214.854236405482[/C][/ROW]
[ROW][C]502.775413517599[/C][/ROW]
[ROW][C]-192.763101429877[/C][/ROW]
[ROW][C]322.137028924729[/C][/ROW]
[ROW][C]402.326569830178[/C][/ROW]
[ROW][C]-267.543899354807[/C][/ROW]
[ROW][C]325.499959024889[/C][/ROW]
[ROW][C]-105.52954164063[/C][/ROW]
[ROW][C]-78.6561755857587[/C][/ROW]
[ROW][C]372.533864029044[/C][/ROW]
[ROW][C]173.000045444629[/C][/ROW]
[ROW][C]266.193309768303[/C][/ROW]
[ROW][C]108.831370104005[/C][/ROW]
[ROW][C]-105.457526882147[/C][/ROW]
[ROW][C]-507.904839647209[/C][/ROW]
[ROW][C]422.088992376698[/C][/ROW]
[ROW][C]279.588121070765[/C][/ROW]
[ROW][C]303.349366811329[/C][/ROW]
[ROW][C]219.741163538862[/C][/ROW]
[ROW][C]-62.5598938423811[/C][/ROW]
[ROW][C]164.26920095811[/C][/ROW]
[ROW][C]347.321564685995[/C][/ROW]
[ROW][C]-152.18309224748[/C][/ROW]
[ROW][C]-123.82466977268[/C][/ROW]
[ROW][C]282.739824458475[/C][/ROW]
[ROW][C]157.898527426025[/C][/ROW]
[ROW][C]137.13056397737[/C][/ROW]
[ROW][C]113.782310612005[/C][/ROW]
[ROW][C]-487.812494184674[/C][/ROW]
[ROW][C]119.370093318938[/C][/ROW]
[ROW][C]207.836771020399[/C][/ROW]
[ROW][C]109.476959488334[/C][/ROW]
[ROW][C]-122.900347941277[/C][/ROW]
[ROW][C]-135.686754882965[/C][/ROW]
[ROW][C]40.4777376263017[/C][/ROW]
[ROW][C]-103.863876801136[/C][/ROW]
[ROW][C]171.164601172498[/C][/ROW]
[ROW][C]-93.7152099971705[/C][/ROW]
[ROW][C]355.273195397157[/C][/ROW]
[ROW][C]265.120831330895[/C][/ROW]
[ROW][C]-70.0824987992847[/C][/ROW]
[ROW][C]7.41363481323158[/C][/ROW]
[ROW][C]403.134759378225[/C][/ROW]
[ROW][C]372.237449473188[/C][/ROW]
[ROW][C]61.1486604315705[/C][/ROW]
[ROW][C]-521.625079632494[/C][/ROW]
[ROW][C]-76.8904440166803[/C][/ROW]
[ROW][C]-14.9289032171026[/C][/ROW]
[ROW][C]-133.584259470502[/C][/ROW]
[ROW][C]-309.621931129702[/C][/ROW]
[ROW][C]99.0320818387543[/C][/ROW]
[ROW][C]-72.9753854519398[/C][/ROW]
[ROW][C]242.209189548956[/C][/ROW]
[ROW][C]500.80029148504[/C][/ROW]
[ROW][C]-134.988882704608[/C][/ROW]
[ROW][C]71.9966850447962[/C][/ROW]
[ROW][C]-28.2743297344602[/C][/ROW]
[ROW][C]33.7218384168581[/C][/ROW]
[ROW][C]374.772513910338[/C][/ROW]
[ROW][C]141.823450135368[/C][/ROW]
[ROW][C]-470.411687489394[/C][/ROW]
[ROW][C]616.808314972185[/C][/ROW]
[ROW][C]-16.6830836152568[/C][/ROW]
[ROW][C]152.28191652502[/C][/ROW]
[ROW][C]385.458976748908[/C][/ROW]
[ROW][C]-520.32489018406[/C][/ROW]
[ROW][C]69.8784136389996[/C][/ROW]
[ROW][C]-80.6493503613757[/C][/ROW]
[ROW][C]-203.116395283892[/C][/ROW]
[ROW][C]-150.510492856983[/C][/ROW]
[ROW][C]-155.017285415975[/C][/ROW]
[ROW][C]-453.626193193095[/C][/ROW]
[ROW][C]-16.7438323597717[/C][/ROW]
[ROW][C]169.432997021546[/C][/ROW]
[ROW][C]-247.843664166786[/C][/ROW]
[ROW][C]205.043446656466[/C][/ROW]
[ROW][C]42.8815394083958[/C][/ROW]
[ROW][C]114.883911399148[/C][/ROW]
[ROW][C]256.201072669166[/C][/ROW]
[ROW][C]-106.709667422864[/C][/ROW]
[ROW][C]-83.8961873667033[/C][/ROW]
[ROW][C]180.182443418939[/C][/ROW]
[/TABLE]
Source: https://freestatistics.org/blog/index.php?pk=265955&T=2

Globally Unique Identifier (entire table): ba.freestatistics.org/blog/index.php?pk=265955&T=2

As an alternative you can also use a QR Code:  

The GUIDs for individual cells are displayed in the table below:

Estimated ARIMA Residuals
Value
-33.1580498543655
-443.463502748729
44.3826676177066
404.110080049758
31.3275839424692
78.0879635495185
141.214633759356
-135.161567272326
-188.509765799778
26.8947116046199
-22.8534107447811
-68.9232512216089
-66.3170005557754
113.934091656426
28.8634415422418
-267.897143666817
-470.311822271655
-266.227799270128
253.297484103109
59.7941032219814
282.814322673374
139.401107108645
-163.24872765987
241.860015345897
183.766675682122
-112.779954162146
-214.854236405482
502.775413517599
-192.763101429877
322.137028924729
402.326569830178
-267.543899354807
325.499959024889
-105.52954164063
-78.6561755857587
372.533864029044
173.000045444629
266.193309768303
108.831370104005
-105.457526882147
-507.904839647209
422.088992376698
279.588121070765
303.349366811329
219.741163538862
-62.5598938423811
164.26920095811
347.321564685995
-152.18309224748
-123.82466977268
282.739824458475
157.898527426025
137.13056397737
113.782310612005
-487.812494184674
119.370093318938
207.836771020399
109.476959488334
-122.900347941277
-135.686754882965
40.4777376263017
-103.863876801136
171.164601172498
-93.7152099971705
355.273195397157
265.120831330895
-70.0824987992847
7.41363481323158
403.134759378225
372.237449473188
61.1486604315705
-521.625079632494
-76.8904440166803
-14.9289032171026
-133.584259470502
-309.621931129702
99.0320818387543
-72.9753854519398
242.209189548956
500.80029148504
-134.988882704608
71.9966850447962
-28.2743297344602
33.7218384168581
374.772513910338
141.823450135368
-470.411687489394
616.808314972185
-16.6830836152568
152.28191652502
385.458976748908
-520.32489018406
69.8784136389996
-80.6493503613757
-203.116395283892
-150.510492856983
-155.017285415975
-453.626193193095
-16.7438323597717
169.432997021546
-247.843664166786
205.043446656466
42.8815394083958
114.883911399148
256.201072669166
-106.709667422864
-83.8961873667033
180.182443418939


Parameters (Session):
par1 = Default ; par2 = -0.3 ; par3 = 1 ; par4 = 1 ; par5 = 12 ; par6 = White Noise ; par7 = 0.95 ;
Parameters (R input):
par1 = FALSE ; par2 = 1 ; par3 = 1 ; par4 = 1 ; par5 = 12 ; par6 = 1 ; par7 = 1 ; par8 = 1 ; par9 = 1 ;
R code (references can be found in the software module):
par9 <- '1'
par8 <- '1'
par7 <- '1'
par6 <- '1'
par5 <- '12'
par4 <- '0'
par3 <- '1'
par2 <- '1'
par1 <- 'FALSE'
library(lattice)
if (par1 == 'TRUE') par1 <- TRUE
if (par1 == 'FALSE') par1 <- FALSE
par2 <- as.numeric(par2) #Box-Cox lambda transformation parameter
par3 <- as.numeric(par3) #degree of non-seasonal differencing
par4 <- as.numeric(par4) #degree of seasonal differencing
par5 <- as.numeric(par5) #seasonal period
par6 <- as.numeric(par6) #degree (p) of the non-seasonal AR(p) polynomial
par7 <- as.numeric(par7) #degree (q) of the non-seasonal MA(q) polynomial
par8 <- as.numeric(par8) #degree (P) of the seasonal AR(P) polynomial
par9 <- as.numeric(par9) #degree (Q) of the seasonal MA(Q) polynomial
armaGR <- function(arima.out, names, n){
try1 <- arima.out$coef
try2 <- sqrt(diag(arima.out$var.coef))
try.data.frame <- data.frame(matrix(NA,ncol=4,nrow=length(names)))
dimnames(try.data.frame) <- list(names,c('coef','std','tstat','pv'))
try.data.frame[,1] <- try1
for(i in 1:length(try2)) try.data.frame[which(rownames(try.data.frame)==names(try2)[i]),2] <- try2[i]
try.data.frame[,3] <- try.data.frame[,1] / try.data.frame[,2]
try.data.frame[,4] <- round((1-pt(abs(try.data.frame[,3]),df=n-(length(try2)+1)))*2,5)
vector <- rep(NA,length(names))
vector[is.na(try.data.frame[,4])] <- 0
maxi <- which.max(try.data.frame[,4])
continue <- max(try.data.frame[,4],na.rm=TRUE) > .05
vector[maxi] <- 0
list(summary=try.data.frame,next.vector=vector,continue=continue)
}
arimaSelect <- function(series, order=c(13,0,0), seasonal=list(order=c(2,0,0),period=12), include.mean=F){
nrc <- order[1]+order[3]+seasonal$order[1]+seasonal$order[3]
coeff <- matrix(NA, nrow=nrc*2, ncol=nrc)
pval <- matrix(NA, nrow=nrc*2, ncol=nrc)
mylist <- rep(list(NULL), nrc)
names <- NULL
if(order[1] > 0) names <- paste('ar',1:order[1],sep='')
if(order[3] > 0) names <- c( names , paste('ma',1:order[3],sep='') )
if(seasonal$order[1] > 0) names <- c(names, paste('sar',1:seasonal$order[1],sep=''))
if(seasonal$order[3] > 0) names <- c(names, paste('sma',1:seasonal$order[3],sep=''))
arima.out <- arima(series, order=order, seasonal=seasonal, include.mean=include.mean, method='ML')
mylist[[1]] <- arima.out
last.arma <- armaGR(arima.out, names, length(series))
mystop <- FALSE
i <- 1
coeff[i,] <- last.arma[[1]][,1]
pval [i,] <- last.arma[[1]][,4]
i <- 2
aic <- arima.out$aic
while(!mystop){
mylist[[i]] <- arima.out
arima.out <- arima(series, order=order, seasonal=seasonal, include.mean=include.mean, method='ML', fixed=last.arma$next.vector)
aic <- c(aic, arima.out$aic)
last.arma <- armaGR(arima.out, names, length(series))
mystop <- !last.arma$continue
coeff[i,] <- last.arma[[1]][,1]
pval [i,] <- last.arma[[1]][,4]
i <- i+1
}
list(coeff, pval, mylist, aic=aic)
}
arimaSelectplot <- function(arimaSelect.out,noms,choix){
noms <- names(arimaSelect.out[[3]][[1]]$coef)
coeff <- arimaSelect.out[[1]]
k <- min(which(is.na(coeff[,1])))-1
coeff <- coeff[1:k,]
pval <- arimaSelect.out[[2]][1:k,]
aic <- arimaSelect.out$aic[1:k]
coeff[coeff==0] <- NA
n <- ncol(coeff)
if(missing(choix)) choix <- k
layout(matrix(c(1,1,1,2,
3,3,3,2,
3,3,3,4,
5,6,7,7),nr=4),
widths=c(10,35,45,15),
heights=c(30,30,15,15))
couleurs <- rainbow(75)[1:50]#(50)
ticks <- pretty(coeff)
par(mar=c(1,1,3,1))
plot(aic,k:1-.5,type='o',pch=21,bg='blue',cex=2,axes=F,lty=2,xpd=NA)
points(aic[choix],k-choix+.5,pch=21,cex=4,bg=2,xpd=NA)
title('aic',line=2)
par(mar=c(3,0,0,0))
plot(0,axes=F,xlab='',ylab='',xlim=range(ticks),ylim=c(.1,1))
rect(xleft = min(ticks) + (0:49)/50*(max(ticks)-min(ticks)),
xright = min(ticks) + (1:50)/50*(max(ticks)-min(ticks)),
ytop = rep(1,50),
ybottom= rep(0,50),col=couleurs,border=NA)
axis(1,ticks)
rect(xleft=min(ticks),xright=max(ticks),ytop=1,ybottom=0)
text(mean(coeff,na.rm=T),.5,'coefficients',cex=2,font=2)
par(mar=c(1,1,3,1))
image(1:n,1:k,t(coeff[k:1,]),axes=F,col=couleurs,zlim=range(ticks))
for(i in 1:n) for(j in 1:k) if(!is.na(coeff[j,i])) {
if(pval[j,i]<.01) symb = 'green'
else if( (pval[j,i]<.05) & (pval[j,i]>=.01)) symb = 'orange'
else if( (pval[j,i]<.1) & (pval[j,i]>=.05)) symb = 'red'
else symb = 'black'
polygon(c(i+.5 ,i+.2 ,i+.5 ,i+.5),
c(k-j+0.5,k-j+0.5,k-j+0.8,k-j+0.5),
col=symb)
if(j==choix) {
rect(xleft=i-.5,
xright=i+.5,
ybottom=k-j+1.5,
ytop=k-j+.5,
lwd=4)
text(i,
k-j+1,
round(coeff[j,i],2),
cex=1.2,
font=2)
}
else{
rect(xleft=i-.5,xright=i+.5,ybottom=k-j+1.5,ytop=k-j+.5)
text(i,k-j+1,round(coeff[j,i],2),cex=1.2,font=1)
}
}
axis(3,1:n,noms)
par(mar=c(0.5,0,0,0.5))
plot(0,axes=F,xlab='',ylab='',type='n',xlim=c(0,8),ylim=c(-.2,.8))
cols <- c('green','orange','red','black')
niv <- c('0','0.01','0.05','0.1')
for(i in 0:3){
polygon(c(1+2*i ,1+2*i ,1+2*i-.5 ,1+2*i),
c(.4 ,.7 , .4 , .4),
col=cols[i+1])
text(2*i,0.5,niv[i+1],cex=1.5)
}
text(8,.5,1,cex=1.5)
text(4,0,'p-value',cex=2)
box()
residus <- arimaSelect.out[[3]][[choix]]$res
par(mar=c(1,2,4,1))
acf(residus,main='')
title('acf',line=.5)
par(mar=c(1,2,4,1))
pacf(residus,main='')
title('pacf',line=.5)
par(mar=c(2,2,4,1))
qqnorm(residus,main='')
title('qq-norm',line=.5)
qqline(residus)
residus
}
if (par2 == 0) x <- log(x)
if (par2 != 0) x <- x^par2
(selection <- arimaSelect(x, order=c(par6,par3,par7), seasonal=list(order=c(par8,par4,par9), period=par5)))
bitmap(file='test1.png')
resid <- arimaSelectplot(selection)
dev.off()
resid
bitmap(file='test2.png')
acf(resid,length(resid)/2, main='Residual Autocorrelation Function')
dev.off()
bitmap(file='test3.png')
pacf(resid,length(resid)/2, main='Residual Partial Autocorrelation Function')
dev.off()
bitmap(file='test4.png')
cpgram(resid, main='Residual Cumulative Periodogram')
dev.off()
bitmap(file='test5.png')
hist(resid, main='Residual Histogram', xlab='values of Residuals')
dev.off()
bitmap(file='test6.png')
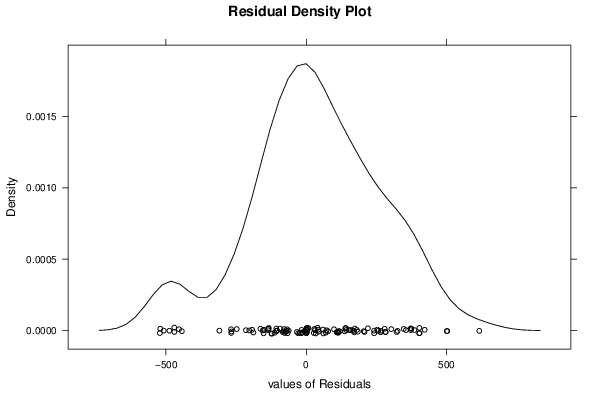
densityplot(~resid,col='black',main='Residual Density Plot', xlab='values of Residuals')
dev.off()
bitmap(file='test7.png')
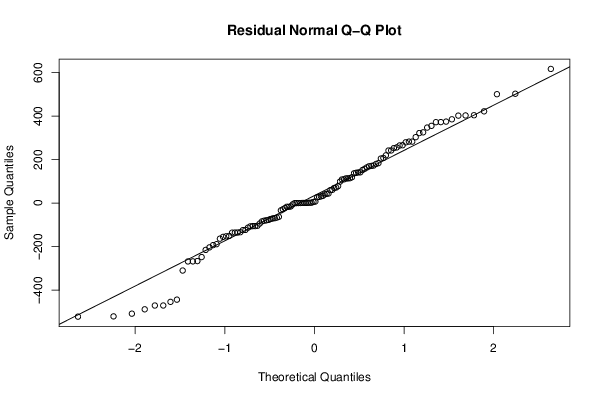
qqnorm(resid, main='Residual Normal Q-Q Plot')
qqline(resid)
dev.off()
ncols <- length(selection[[1]][1,])
nrows <- length(selection[[2]][,1])-1
load(file='createtable')
a<-table.start()
a<-table.row.start(a)
a<-table.element(a,'ARIMA Parameter Estimation and Backward Selection', ncols+1,TRUE)
a<-table.row.end(a)
a<-table.row.start(a)
a<-table.element(a,'Iteration', header=TRUE)
for (i in 1:ncols) {
a<-table.element(a,names(selection[[3]][[1]]$coef)[i],header=TRUE)
}
a<-table.row.end(a)
for (j in 1:nrows) {
a<-table.row.start(a)
mydum <- 'Estimates ('
mydum <- paste(mydum,j)
mydum <- paste(mydum,')')
a<-table.element(a,mydum, header=TRUE)
for (i in 1:ncols) {
a<-table.element(a,round(selection[[1]][j,i],4))
}
a<-table.row.end(a)
a<-table.row.start(a)
a<-table.element(a,'(p-val)', header=TRUE)
for (i in 1:ncols) {
mydum <- '('
mydum <- paste(mydum,round(selection[[2]][j,i],4),sep='')
mydum <- paste(mydum,')')
a<-table.element(a,mydum)
}
a<-table.row.end(a)
}
a<-table.end(a)
table.save(a,file='mytable.tab')
a<-table.start()
a<-table.row.start(a)
a<-table.element(a,'Estimated ARIMA Residuals', 1,TRUE)
a<-table.row.end(a)
a<-table.row.start(a)
a<-table.element(a,'Value', 1,TRUE)
a<-table.row.end(a)
for (i in (par4*par5+par3):length(resid)) {
a<-table.row.start(a)
a<-table.element(a,resid[i])
a<-table.row.end(a)
}
a<-table.end(a)
table.save(a,file='mytable1.tab')