Free Statistics

of Irreproducible Research!

Author's title

Author*Unverified author*
R Software Module--
Title produced by softwareMultiple Regression
Date of computationMon, 14 Dec 2015 11:24:28 +0000
Cite this page as followsStatistical Computations at FreeStatistics.org, Office for Research Development and Education, URL https://freestatistics.org/blog/index.php?v=date/2015/Dec/14/t1450092457h4n5nh9624m93p5.htm/, Retrieved Thu, 31 Oct 2024 23:15:32 +0000
Statistical Computations at FreeStatistics.org, Office for Research Development and Education, URL https://freestatistics.org/blog/index.php?pk=286262, Retrieved Thu, 31 Oct 2024 23:15:32 +0000
QR Codes:

Original text written by user:
IsPrivate?No (this computation is public)
User-defined keywords
Estimated Impact154
Family? (F = Feedback message, R = changed R code, M = changed R Module, P = changed Parameters, D = changed Data)
-     [Multiple Regression] [] [2015-12-11 14:02:52] [9378e2688aa9dcfd1390615d31e9d404]
- RM      [Multiple Regression] [Regressie analyse] [2015-12-14 11:24:28] [d41d8cd98f00b204e9800998ecf8427e] [Current]
Feedback Forum

Post a new message
Dataseries X:
-8	8,5
-9	8,4
-5	8,5
-1	8,7
-2	8,7
-5	8,6
-4	8,5
-6	8,3
-2	8
-2	8,2
-2	8,1
-2	8,1
2	8
1	7,9
-8	7,9
-1	8
1	8
-1	7,9
2	8
2	7,7
1	7,2
-1	7,5
-2	7,3
-2	7
-1	7
-8	7
-4	7,2
-6	7,3
-3	7,1
-3	6,8
-7	6,4
-9	6,1
-11	6,5
-13	7,7
-11	7,9
-9	7,5
-17	6,9
-22	6,6
-25	6,9
-20	7,7
-24	8
-24	8
-22	7,7
-19	7,3
-18	7,4
-17	8,1
-11	8,3
-11	8,1
-12	7,9
-10	7,9
-15	8,3
-15	8,6
-15	8,7
-13	8,5
-8	8,3
-13	8
-9	8
-7	8,8
-4	8,7
-4	8,5
-2	8,1
0	7,8
-2	7,7
-3	7,5
1	7,2
-2	6,9
-1	6,6
1	6,5
-3	6,6
-4	7,7
-9	8
-9	7,7
-7	7,3
-14	7
-12	7
-16	7,3
-20	7,3
-12	7,1
-12	7,1
-10	7
-10	7
-13	7,5
-16	7,8
-14	7,9
-17	8,1
-24	8,3
-25	8,4
-23	8,6
-17	8,5
-24	8,4
-20	8,3
-19	8
-18	8
-16	8,7
-12	8,7
-7	8,6
-6	8,5
-6	8,5
-5	8,6
-4	8,8
-4	8,7
-8	8,6
-9	8,4
-6	8,1
-7	8,1
-10	8,7
-11	8,7
-11	8,6
-12	8,6
-14	8,5
-12	8,6
-9	8,8
-5	8,8
-6	8,7
-6	8,5
-3	8,3
-2	8,3
-6	8,9
-6	9
-10	8,8


Summary of computational transaction
Raw Inputview raw input (R code)
Raw Outputview raw output of R engine
Computing time5 seconds
R Server'Gwilym Jenkins' @ jenkins.wessa.net

\begin{tabular}{lllllllll}
\hline
Summary of computational transaction \tabularnewline
Raw Input & view raw input (R code)  \tabularnewline
Raw Output & view raw output of R engine  \tabularnewline
Computing time & 5 seconds \tabularnewline
R Server & 'Gwilym Jenkins' @ jenkins.wessa.net \tabularnewline
\hline
\end{tabular}
%Source: https://freestatistics.org/blog/index.php?pk=286262&T=0

[TABLE]
[ROW][C]Summary of computational transaction[/C][/ROW]
[ROW][C]Raw Input[/C][C]view raw input (R code) [/C][/ROW]
[ROW][C]Raw Output[/C][C]view raw output of R engine [/C][/ROW]
[ROW][C]Computing time[/C][C]5 seconds[/C][/ROW]
[ROW][C]R Server[/C][C]'Gwilym Jenkins' @ jenkins.wessa.net[/C][/ROW]
[/TABLE]
Source: https://freestatistics.org/blog/index.php?pk=286262&T=0

Globally Unique Identifier (entire table): ba.freestatistics.org/blog/index.php?pk=286262&T=0

As an alternative you can also use a QR Code:  

The GUIDs for individual cells are displayed in the table below:

Summary of computational transaction
Raw Inputview raw input (R code)
Raw Outputview raw output of R engine
Computing time5 seconds
R Server'Gwilym Jenkins' @ jenkins.wessa.net


Multiple Linear Regression - Estimated Regression Equation
ConverM[t] = -5.90982 -0.393083WerklooshM[t] + e[t]

\begin{tabular}{lllllllll}
\hline
Multiple Linear Regression - Estimated Regression Equation \tabularnewline
ConverM[t] =  -5.90982 -0.393083WerklooshM[t]  + e[t] \tabularnewline
 \tabularnewline
\hline
\end{tabular}
%Source: https://freestatistics.org/blog/index.php?pk=286262&T=1

[TABLE]
[ROW][C]Multiple Linear Regression - Estimated Regression Equation[/C][/ROW]
[ROW][C]ConverM[t] =  -5.90982 -0.393083WerklooshM[t]  + e[t][/C][/ROW]
[ROW][C][/C][/ROW]
[/TABLE]
Source: https://freestatistics.org/blog/index.php?pk=286262&T=1

Globally Unique Identifier (entire table): ba.freestatistics.org/blog/index.php?pk=286262&T=1

As an alternative you can also use a QR Code:  

The GUIDs for individual cells are displayed in the table below:

Multiple Linear Regression - Estimated Regression Equation
ConverM[t] = -5.90982 -0.393083WerklooshM[t] + e[t]


Multiple Linear Regression - Ordinary Least Squares
VariableParameterS.D.T-STATH0: parameter = 02-tail p-value1-tail p-value
(Intercept)-5.91 7.551-7.8270e-01 0.4354 0.2177
WerklooshM-0.3931 0.9493-4.1410e-01 0.6796 0.3398

\begin{tabular}{lllllllll}
\hline
Multiple Linear Regression - Ordinary Least Squares \tabularnewline
Variable & Parameter & S.D. & T-STATH0: parameter = 0 & 2-tail p-value & 1-tail p-value \tabularnewline
(Intercept) & -5.91 &  7.551 & -7.8270e-01 &  0.4354 &  0.2177 \tabularnewline
WerklooshM & -0.3931 &  0.9493 & -4.1410e-01 &  0.6796 &  0.3398 \tabularnewline
\hline
\end{tabular}
%Source: https://freestatistics.org/blog/index.php?pk=286262&T=2

[TABLE]
[ROW][C]Multiple Linear Regression - Ordinary Least Squares[/C][/ROW]
[ROW][C]Variable[/C][C]Parameter[/C][C]S.D.[/C][C]T-STATH0: parameter = 0[/C][C]2-tail p-value[/C][C]1-tail p-value[/C][/ROW]
[ROW][C](Intercept)[/C][C]-5.91[/C][C] 7.551[/C][C]-7.8270e-01[/C][C] 0.4354[/C][C] 0.2177[/C][/ROW]
[ROW][C]WerklooshM[/C][C]-0.3931[/C][C] 0.9493[/C][C]-4.1410e-01[/C][C] 0.6796[/C][C] 0.3398[/C][/ROW]
[/TABLE]
Source: https://freestatistics.org/blog/index.php?pk=286262&T=2

Globally Unique Identifier (entire table): ba.freestatistics.org/blog/index.php?pk=286262&T=2

As an alternative you can also use a QR Code:  

The GUIDs for individual cells are displayed in the table below:

Multiple Linear Regression - Ordinary Least Squares
VariableParameterS.D.T-STATH0: parameter = 02-tail p-value1-tail p-value
(Intercept)-5.91 7.551-7.8270e-01 0.4354 0.2177
WerklooshM-0.3931 0.9493-4.1410e-01 0.6796 0.3398


Multiple Linear Regression - Regression Statistics
Multiple R 0.03809
R-squared 0.001451
Adjusted R-squared-0.007011
F-TEST (value) 0.1714
F-TEST (DF numerator)1
F-TEST (DF denominator)118
p-value 0.6796
Multiple Linear Regression - Residual Statistics
Residual Standard Deviation 7.009
Sum Squared Residuals 5796

\begin{tabular}{lllllllll}
\hline
Multiple Linear Regression - Regression Statistics \tabularnewline
Multiple R &  0.03809 \tabularnewline
R-squared &  0.001451 \tabularnewline
Adjusted R-squared & -0.007011 \tabularnewline
F-TEST (value) &  0.1714 \tabularnewline
F-TEST (DF numerator) & 1 \tabularnewline
F-TEST (DF denominator) & 118 \tabularnewline
p-value &  0.6796 \tabularnewline
Multiple Linear Regression - Residual Statistics \tabularnewline
Residual Standard Deviation &  7.009 \tabularnewline
Sum Squared Residuals &  5796 \tabularnewline
\hline
\end{tabular}
%Source: https://freestatistics.org/blog/index.php?pk=286262&T=3

[TABLE]
[ROW][C]Multiple Linear Regression - Regression Statistics[/C][/ROW]
[ROW][C]Multiple R[/C][C] 0.03809[/C][/ROW]
[ROW][C]R-squared[/C][C] 0.001451[/C][/ROW]
[ROW][C]Adjusted R-squared[/C][C]-0.007011[/C][/ROW]
[ROW][C]F-TEST (value)[/C][C] 0.1714[/C][/ROW]
[ROW][C]F-TEST (DF numerator)[/C][C]1[/C][/ROW]
[ROW][C]F-TEST (DF denominator)[/C][C]118[/C][/ROW]
[ROW][C]p-value[/C][C] 0.6796[/C][/ROW]
[ROW][C]Multiple Linear Regression - Residual Statistics[/C][/ROW]
[ROW][C]Residual Standard Deviation[/C][C] 7.009[/C][/ROW]
[ROW][C]Sum Squared Residuals[/C][C] 5796[/C][/ROW]
[/TABLE]
Source: https://freestatistics.org/blog/index.php?pk=286262&T=3

Globally Unique Identifier (entire table): ba.freestatistics.org/blog/index.php?pk=286262&T=3

As an alternative you can also use a QR Code:  

The GUIDs for individual cells are displayed in the table below:

Multiple Linear Regression - Regression Statistics
Multiple R 0.03809
R-squared 0.001451
Adjusted R-squared-0.007011
F-TEST (value) 0.1714
F-TEST (DF numerator)1
F-TEST (DF denominator)118
p-value 0.6796
Multiple Linear Regression - Residual Statistics
Residual Standard Deviation 7.009
Sum Squared Residuals 5796


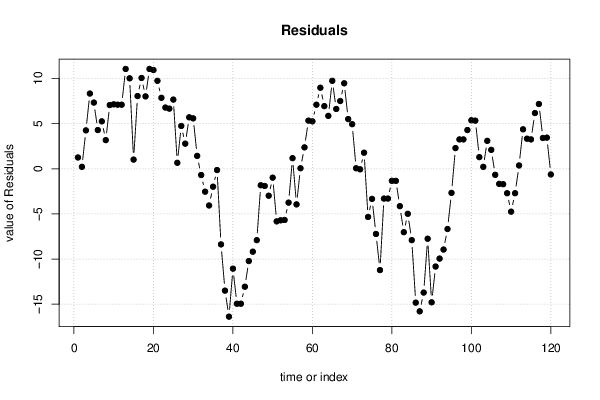
Multiple Linear Regression - Actuals, Interpolation, and Residuals
Time or IndexActualsInterpolationForecastResidualsPrediction Error
1-8-9.251 1.251
2-9-9.212 0.2117
3-5-9.251 4.251
4-1-9.33 8.33
5-2-9.33 7.33
6-5-9.29 4.29
7-4-9.251 5.251
8-6-9.172 3.172
9-2-9.054 7.054
10-2-9.133 7.133
11-2-9.094 7.094
12-2-9.094 7.094
13 2-9.054 11.05
14 1-9.015 10.02
15-8-9.015 1.015
16-1-9.054 8.054
17 1-9.054 10.05
18-1-9.015 8.015
19 2-9.054 11.05
20 2-8.937 10.94
21 1-8.74 9.74
22-1-8.858 7.858
23-2-8.779 6.779
24-2-8.661 6.661
25-1-8.661 7.661
26-8-8.661 0.6614
27-4-8.74 4.74
28-6-8.779 2.779
29-3-8.701 5.701
30-3-8.583 5.583
31-7-8.426 1.426
32-9-8.308-0.6924
33-11-8.465-2.535
34-13-8.937-4.063
35-11-9.015-1.985
36-9-8.858-0.1421
37-17-8.622-8.378
38-22-8.504-13.5
39-25-8.622-16.38
40-20-8.937-11.06
41-24-9.054-14.95
42-24-9.054-14.95
43-22-8.937-13.06
44-19-8.779-10.22
45-18-8.819-9.181
46-17-9.094-7.906
47-11-9.172-1.828
48-11-9.094-1.906
49-12-9.015-2.985
50-10-9.015-0.9848
51-15-9.172-5.828
52-15-9.29-5.71
53-15-9.33-5.67
54-13-9.251-3.749
55-8-9.172 1.172
56-13-9.054-3.946
57-9-9.054 0.05448
58-7-9.369 2.369
59-4-9.33 5.33
60-4-9.251 5.251
61-2-9.094 7.094
62 0-8.976 8.976
63-2-8.937 6.937
64-3-8.858 5.858
65 1-8.74 9.74
66-2-8.622 6.622
67-1-8.504 7.504
68 1-8.465 9.465
69-3-8.504 5.504
70-4-8.937 4.937
71-9-9.054 0.05448
72-9-8.937-0.06344
73-7-8.779 1.779
74-14-8.661-5.339
75-12-8.661-3.339
76-16-8.779-7.221
77-20-8.779-11.22
78-12-8.701-3.299
79-12-8.701-3.299
80-10-8.661-1.339
81-10-8.661-1.339
82-13-8.858-4.142
83-16-8.976-7.024
84-14-9.015-4.985
85-17-9.094-7.906
86-24-9.172-14.83
87-25-9.212-15.79
88-23-9.29-13.71
89-17-9.251-7.749
90-24-9.212-14.79
91-20-9.172-10.83
92-19-9.054-9.946
93-18-9.054-8.946
94-16-9.33-6.67
95-12-9.33-2.67
96-7-9.29 2.29
97-6-9.251 3.251
98-6-9.251 3.251
99-5-9.29 4.29
100-4-9.369 5.369
101-4-9.33 5.33
102-8-9.29 1.29
103-9-9.212 0.2117
104-6-9.094 3.094
105-7-9.094 2.094
106-10-9.33-0.6704
107-11-9.33-1.67
108-11-9.29-1.71
109-12-9.29-2.71
110-14-9.251-4.749
111-12-9.29-2.71
112-9-9.369 0.3689
113-5-9.369 4.369
114-6-9.33 3.33
115-6-9.251 3.251
116-3-9.172 6.172
117-2-9.172 7.172
118-6-9.408 3.408
119-6-9.448 3.448
120-10-9.369-0.6311

\begin{tabular}{lllllllll}
\hline
Multiple Linear Regression - Actuals, Interpolation, and Residuals \tabularnewline
Time or Index & Actuals & InterpolationForecast & ResidualsPrediction Error \tabularnewline
1 & -8 & -9.251 &  1.251 \tabularnewline
2 & -9 & -9.212 &  0.2117 \tabularnewline
3 & -5 & -9.251 &  4.251 \tabularnewline
4 & -1 & -9.33 &  8.33 \tabularnewline
5 & -2 & -9.33 &  7.33 \tabularnewline
6 & -5 & -9.29 &  4.29 \tabularnewline
7 & -4 & -9.251 &  5.251 \tabularnewline
8 & -6 & -9.172 &  3.172 \tabularnewline
9 & -2 & -9.054 &  7.054 \tabularnewline
10 & -2 & -9.133 &  7.133 \tabularnewline
11 & -2 & -9.094 &  7.094 \tabularnewline
12 & -2 & -9.094 &  7.094 \tabularnewline
13 &  2 & -9.054 &  11.05 \tabularnewline
14 &  1 & -9.015 &  10.02 \tabularnewline
15 & -8 & -9.015 &  1.015 \tabularnewline
16 & -1 & -9.054 &  8.054 \tabularnewline
17 &  1 & -9.054 &  10.05 \tabularnewline
18 & -1 & -9.015 &  8.015 \tabularnewline
19 &  2 & -9.054 &  11.05 \tabularnewline
20 &  2 & -8.937 &  10.94 \tabularnewline
21 &  1 & -8.74 &  9.74 \tabularnewline
22 & -1 & -8.858 &  7.858 \tabularnewline
23 & -2 & -8.779 &  6.779 \tabularnewline
24 & -2 & -8.661 &  6.661 \tabularnewline
25 & -1 & -8.661 &  7.661 \tabularnewline
26 & -8 & -8.661 &  0.6614 \tabularnewline
27 & -4 & -8.74 &  4.74 \tabularnewline
28 & -6 & -8.779 &  2.779 \tabularnewline
29 & -3 & -8.701 &  5.701 \tabularnewline
30 & -3 & -8.583 &  5.583 \tabularnewline
31 & -7 & -8.426 &  1.426 \tabularnewline
32 & -9 & -8.308 & -0.6924 \tabularnewline
33 & -11 & -8.465 & -2.535 \tabularnewline
34 & -13 & -8.937 & -4.063 \tabularnewline
35 & -11 & -9.015 & -1.985 \tabularnewline
36 & -9 & -8.858 & -0.1421 \tabularnewline
37 & -17 & -8.622 & -8.378 \tabularnewline
38 & -22 & -8.504 & -13.5 \tabularnewline
39 & -25 & -8.622 & -16.38 \tabularnewline
40 & -20 & -8.937 & -11.06 \tabularnewline
41 & -24 & -9.054 & -14.95 \tabularnewline
42 & -24 & -9.054 & -14.95 \tabularnewline
43 & -22 & -8.937 & -13.06 \tabularnewline
44 & -19 & -8.779 & -10.22 \tabularnewline
45 & -18 & -8.819 & -9.181 \tabularnewline
46 & -17 & -9.094 & -7.906 \tabularnewline
47 & -11 & -9.172 & -1.828 \tabularnewline
48 & -11 & -9.094 & -1.906 \tabularnewline
49 & -12 & -9.015 & -2.985 \tabularnewline
50 & -10 & -9.015 & -0.9848 \tabularnewline
51 & -15 & -9.172 & -5.828 \tabularnewline
52 & -15 & -9.29 & -5.71 \tabularnewline
53 & -15 & -9.33 & -5.67 \tabularnewline
54 & -13 & -9.251 & -3.749 \tabularnewline
55 & -8 & -9.172 &  1.172 \tabularnewline
56 & -13 & -9.054 & -3.946 \tabularnewline
57 & -9 & -9.054 &  0.05448 \tabularnewline
58 & -7 & -9.369 &  2.369 \tabularnewline
59 & -4 & -9.33 &  5.33 \tabularnewline
60 & -4 & -9.251 &  5.251 \tabularnewline
61 & -2 & -9.094 &  7.094 \tabularnewline
62 &  0 & -8.976 &  8.976 \tabularnewline
63 & -2 & -8.937 &  6.937 \tabularnewline
64 & -3 & -8.858 &  5.858 \tabularnewline
65 &  1 & -8.74 &  9.74 \tabularnewline
66 & -2 & -8.622 &  6.622 \tabularnewline
67 & -1 & -8.504 &  7.504 \tabularnewline
68 &  1 & -8.465 &  9.465 \tabularnewline
69 & -3 & -8.504 &  5.504 \tabularnewline
70 & -4 & -8.937 &  4.937 \tabularnewline
71 & -9 & -9.054 &  0.05448 \tabularnewline
72 & -9 & -8.937 & -0.06344 \tabularnewline
73 & -7 & -8.779 &  1.779 \tabularnewline
74 & -14 & -8.661 & -5.339 \tabularnewline
75 & -12 & -8.661 & -3.339 \tabularnewline
76 & -16 & -8.779 & -7.221 \tabularnewline
77 & -20 & -8.779 & -11.22 \tabularnewline
78 & -12 & -8.701 & -3.299 \tabularnewline
79 & -12 & -8.701 & -3.299 \tabularnewline
80 & -10 & -8.661 & -1.339 \tabularnewline
81 & -10 & -8.661 & -1.339 \tabularnewline
82 & -13 & -8.858 & -4.142 \tabularnewline
83 & -16 & -8.976 & -7.024 \tabularnewline
84 & -14 & -9.015 & -4.985 \tabularnewline
85 & -17 & -9.094 & -7.906 \tabularnewline
86 & -24 & -9.172 & -14.83 \tabularnewline
87 & -25 & -9.212 & -15.79 \tabularnewline
88 & -23 & -9.29 & -13.71 \tabularnewline
89 & -17 & -9.251 & -7.749 \tabularnewline
90 & -24 & -9.212 & -14.79 \tabularnewline
91 & -20 & -9.172 & -10.83 \tabularnewline
92 & -19 & -9.054 & -9.946 \tabularnewline
93 & -18 & -9.054 & -8.946 \tabularnewline
94 & -16 & -9.33 & -6.67 \tabularnewline
95 & -12 & -9.33 & -2.67 \tabularnewline
96 & -7 & -9.29 &  2.29 \tabularnewline
97 & -6 & -9.251 &  3.251 \tabularnewline
98 & -6 & -9.251 &  3.251 \tabularnewline
99 & -5 & -9.29 &  4.29 \tabularnewline
100 & -4 & -9.369 &  5.369 \tabularnewline
101 & -4 & -9.33 &  5.33 \tabularnewline
102 & -8 & -9.29 &  1.29 \tabularnewline
103 & -9 & -9.212 &  0.2117 \tabularnewline
104 & -6 & -9.094 &  3.094 \tabularnewline
105 & -7 & -9.094 &  2.094 \tabularnewline
106 & -10 & -9.33 & -0.6704 \tabularnewline
107 & -11 & -9.33 & -1.67 \tabularnewline
108 & -11 & -9.29 & -1.71 \tabularnewline
109 & -12 & -9.29 & -2.71 \tabularnewline
110 & -14 & -9.251 & -4.749 \tabularnewline
111 & -12 & -9.29 & -2.71 \tabularnewline
112 & -9 & -9.369 &  0.3689 \tabularnewline
113 & -5 & -9.369 &  4.369 \tabularnewline
114 & -6 & -9.33 &  3.33 \tabularnewline
115 & -6 & -9.251 &  3.251 \tabularnewline
116 & -3 & -9.172 &  6.172 \tabularnewline
117 & -2 & -9.172 &  7.172 \tabularnewline
118 & -6 & -9.408 &  3.408 \tabularnewline
119 & -6 & -9.448 &  3.448 \tabularnewline
120 & -10 & -9.369 & -0.6311 \tabularnewline
\hline
\end{tabular}
%Source: https://freestatistics.org/blog/index.php?pk=286262&T=4

[TABLE]
[ROW][C]Multiple Linear Regression - Actuals, Interpolation, and Residuals[/C][/ROW]
[ROW][C]Time or Index[/C][C]Actuals[/C][C]InterpolationForecast[/C][C]ResidualsPrediction Error[/C][/ROW]
[ROW][C]1[/C][C]-8[/C][C]-9.251[/C][C] 1.251[/C][/ROW]
[ROW][C]2[/C][C]-9[/C][C]-9.212[/C][C] 0.2117[/C][/ROW]
[ROW][C]3[/C][C]-5[/C][C]-9.251[/C][C] 4.251[/C][/ROW]
[ROW][C]4[/C][C]-1[/C][C]-9.33[/C][C] 8.33[/C][/ROW]
[ROW][C]5[/C][C]-2[/C][C]-9.33[/C][C] 7.33[/C][/ROW]
[ROW][C]6[/C][C]-5[/C][C]-9.29[/C][C] 4.29[/C][/ROW]
[ROW][C]7[/C][C]-4[/C][C]-9.251[/C][C] 5.251[/C][/ROW]
[ROW][C]8[/C][C]-6[/C][C]-9.172[/C][C] 3.172[/C][/ROW]
[ROW][C]9[/C][C]-2[/C][C]-9.054[/C][C] 7.054[/C][/ROW]
[ROW][C]10[/C][C]-2[/C][C]-9.133[/C][C] 7.133[/C][/ROW]
[ROW][C]11[/C][C]-2[/C][C]-9.094[/C][C] 7.094[/C][/ROW]
[ROW][C]12[/C][C]-2[/C][C]-9.094[/C][C] 7.094[/C][/ROW]
[ROW][C]13[/C][C] 2[/C][C]-9.054[/C][C] 11.05[/C][/ROW]
[ROW][C]14[/C][C] 1[/C][C]-9.015[/C][C] 10.02[/C][/ROW]
[ROW][C]15[/C][C]-8[/C][C]-9.015[/C][C] 1.015[/C][/ROW]
[ROW][C]16[/C][C]-1[/C][C]-9.054[/C][C] 8.054[/C][/ROW]
[ROW][C]17[/C][C] 1[/C][C]-9.054[/C][C] 10.05[/C][/ROW]
[ROW][C]18[/C][C]-1[/C][C]-9.015[/C][C] 8.015[/C][/ROW]
[ROW][C]19[/C][C] 2[/C][C]-9.054[/C][C] 11.05[/C][/ROW]
[ROW][C]20[/C][C] 2[/C][C]-8.937[/C][C] 10.94[/C][/ROW]
[ROW][C]21[/C][C] 1[/C][C]-8.74[/C][C] 9.74[/C][/ROW]
[ROW][C]22[/C][C]-1[/C][C]-8.858[/C][C] 7.858[/C][/ROW]
[ROW][C]23[/C][C]-2[/C][C]-8.779[/C][C] 6.779[/C][/ROW]
[ROW][C]24[/C][C]-2[/C][C]-8.661[/C][C] 6.661[/C][/ROW]
[ROW][C]25[/C][C]-1[/C][C]-8.661[/C][C] 7.661[/C][/ROW]
[ROW][C]26[/C][C]-8[/C][C]-8.661[/C][C] 0.6614[/C][/ROW]
[ROW][C]27[/C][C]-4[/C][C]-8.74[/C][C] 4.74[/C][/ROW]
[ROW][C]28[/C][C]-6[/C][C]-8.779[/C][C] 2.779[/C][/ROW]
[ROW][C]29[/C][C]-3[/C][C]-8.701[/C][C] 5.701[/C][/ROW]
[ROW][C]30[/C][C]-3[/C][C]-8.583[/C][C] 5.583[/C][/ROW]
[ROW][C]31[/C][C]-7[/C][C]-8.426[/C][C] 1.426[/C][/ROW]
[ROW][C]32[/C][C]-9[/C][C]-8.308[/C][C]-0.6924[/C][/ROW]
[ROW][C]33[/C][C]-11[/C][C]-8.465[/C][C]-2.535[/C][/ROW]
[ROW][C]34[/C][C]-13[/C][C]-8.937[/C][C]-4.063[/C][/ROW]
[ROW][C]35[/C][C]-11[/C][C]-9.015[/C][C]-1.985[/C][/ROW]
[ROW][C]36[/C][C]-9[/C][C]-8.858[/C][C]-0.1421[/C][/ROW]
[ROW][C]37[/C][C]-17[/C][C]-8.622[/C][C]-8.378[/C][/ROW]
[ROW][C]38[/C][C]-22[/C][C]-8.504[/C][C]-13.5[/C][/ROW]
[ROW][C]39[/C][C]-25[/C][C]-8.622[/C][C]-16.38[/C][/ROW]
[ROW][C]40[/C][C]-20[/C][C]-8.937[/C][C]-11.06[/C][/ROW]
[ROW][C]41[/C][C]-24[/C][C]-9.054[/C][C]-14.95[/C][/ROW]
[ROW][C]42[/C][C]-24[/C][C]-9.054[/C][C]-14.95[/C][/ROW]
[ROW][C]43[/C][C]-22[/C][C]-8.937[/C][C]-13.06[/C][/ROW]
[ROW][C]44[/C][C]-19[/C][C]-8.779[/C][C]-10.22[/C][/ROW]
[ROW][C]45[/C][C]-18[/C][C]-8.819[/C][C]-9.181[/C][/ROW]
[ROW][C]46[/C][C]-17[/C][C]-9.094[/C][C]-7.906[/C][/ROW]
[ROW][C]47[/C][C]-11[/C][C]-9.172[/C][C]-1.828[/C][/ROW]
[ROW][C]48[/C][C]-11[/C][C]-9.094[/C][C]-1.906[/C][/ROW]
[ROW][C]49[/C][C]-12[/C][C]-9.015[/C][C]-2.985[/C][/ROW]
[ROW][C]50[/C][C]-10[/C][C]-9.015[/C][C]-0.9848[/C][/ROW]
[ROW][C]51[/C][C]-15[/C][C]-9.172[/C][C]-5.828[/C][/ROW]
[ROW][C]52[/C][C]-15[/C][C]-9.29[/C][C]-5.71[/C][/ROW]
[ROW][C]53[/C][C]-15[/C][C]-9.33[/C][C]-5.67[/C][/ROW]
[ROW][C]54[/C][C]-13[/C][C]-9.251[/C][C]-3.749[/C][/ROW]
[ROW][C]55[/C][C]-8[/C][C]-9.172[/C][C] 1.172[/C][/ROW]
[ROW][C]56[/C][C]-13[/C][C]-9.054[/C][C]-3.946[/C][/ROW]
[ROW][C]57[/C][C]-9[/C][C]-9.054[/C][C] 0.05448[/C][/ROW]
[ROW][C]58[/C][C]-7[/C][C]-9.369[/C][C] 2.369[/C][/ROW]
[ROW][C]59[/C][C]-4[/C][C]-9.33[/C][C] 5.33[/C][/ROW]
[ROW][C]60[/C][C]-4[/C][C]-9.251[/C][C] 5.251[/C][/ROW]
[ROW][C]61[/C][C]-2[/C][C]-9.094[/C][C] 7.094[/C][/ROW]
[ROW][C]62[/C][C] 0[/C][C]-8.976[/C][C] 8.976[/C][/ROW]
[ROW][C]63[/C][C]-2[/C][C]-8.937[/C][C] 6.937[/C][/ROW]
[ROW][C]64[/C][C]-3[/C][C]-8.858[/C][C] 5.858[/C][/ROW]
[ROW][C]65[/C][C] 1[/C][C]-8.74[/C][C] 9.74[/C][/ROW]
[ROW][C]66[/C][C]-2[/C][C]-8.622[/C][C] 6.622[/C][/ROW]
[ROW][C]67[/C][C]-1[/C][C]-8.504[/C][C] 7.504[/C][/ROW]
[ROW][C]68[/C][C] 1[/C][C]-8.465[/C][C] 9.465[/C][/ROW]
[ROW][C]69[/C][C]-3[/C][C]-8.504[/C][C] 5.504[/C][/ROW]
[ROW][C]70[/C][C]-4[/C][C]-8.937[/C][C] 4.937[/C][/ROW]
[ROW][C]71[/C][C]-9[/C][C]-9.054[/C][C] 0.05448[/C][/ROW]
[ROW][C]72[/C][C]-9[/C][C]-8.937[/C][C]-0.06344[/C][/ROW]
[ROW][C]73[/C][C]-7[/C][C]-8.779[/C][C] 1.779[/C][/ROW]
[ROW][C]74[/C][C]-14[/C][C]-8.661[/C][C]-5.339[/C][/ROW]
[ROW][C]75[/C][C]-12[/C][C]-8.661[/C][C]-3.339[/C][/ROW]
[ROW][C]76[/C][C]-16[/C][C]-8.779[/C][C]-7.221[/C][/ROW]
[ROW][C]77[/C][C]-20[/C][C]-8.779[/C][C]-11.22[/C][/ROW]
[ROW][C]78[/C][C]-12[/C][C]-8.701[/C][C]-3.299[/C][/ROW]
[ROW][C]79[/C][C]-12[/C][C]-8.701[/C][C]-3.299[/C][/ROW]
[ROW][C]80[/C][C]-10[/C][C]-8.661[/C][C]-1.339[/C][/ROW]
[ROW][C]81[/C][C]-10[/C][C]-8.661[/C][C]-1.339[/C][/ROW]
[ROW][C]82[/C][C]-13[/C][C]-8.858[/C][C]-4.142[/C][/ROW]
[ROW][C]83[/C][C]-16[/C][C]-8.976[/C][C]-7.024[/C][/ROW]
[ROW][C]84[/C][C]-14[/C][C]-9.015[/C][C]-4.985[/C][/ROW]
[ROW][C]85[/C][C]-17[/C][C]-9.094[/C][C]-7.906[/C][/ROW]
[ROW][C]86[/C][C]-24[/C][C]-9.172[/C][C]-14.83[/C][/ROW]
[ROW][C]87[/C][C]-25[/C][C]-9.212[/C][C]-15.79[/C][/ROW]
[ROW][C]88[/C][C]-23[/C][C]-9.29[/C][C]-13.71[/C][/ROW]
[ROW][C]89[/C][C]-17[/C][C]-9.251[/C][C]-7.749[/C][/ROW]
[ROW][C]90[/C][C]-24[/C][C]-9.212[/C][C]-14.79[/C][/ROW]
[ROW][C]91[/C][C]-20[/C][C]-9.172[/C][C]-10.83[/C][/ROW]
[ROW][C]92[/C][C]-19[/C][C]-9.054[/C][C]-9.946[/C][/ROW]
[ROW][C]93[/C][C]-18[/C][C]-9.054[/C][C]-8.946[/C][/ROW]
[ROW][C]94[/C][C]-16[/C][C]-9.33[/C][C]-6.67[/C][/ROW]
[ROW][C]95[/C][C]-12[/C][C]-9.33[/C][C]-2.67[/C][/ROW]
[ROW][C]96[/C][C]-7[/C][C]-9.29[/C][C] 2.29[/C][/ROW]
[ROW][C]97[/C][C]-6[/C][C]-9.251[/C][C] 3.251[/C][/ROW]
[ROW][C]98[/C][C]-6[/C][C]-9.251[/C][C] 3.251[/C][/ROW]
[ROW][C]99[/C][C]-5[/C][C]-9.29[/C][C] 4.29[/C][/ROW]
[ROW][C]100[/C][C]-4[/C][C]-9.369[/C][C] 5.369[/C][/ROW]
[ROW][C]101[/C][C]-4[/C][C]-9.33[/C][C] 5.33[/C][/ROW]
[ROW][C]102[/C][C]-8[/C][C]-9.29[/C][C] 1.29[/C][/ROW]
[ROW][C]103[/C][C]-9[/C][C]-9.212[/C][C] 0.2117[/C][/ROW]
[ROW][C]104[/C][C]-6[/C][C]-9.094[/C][C] 3.094[/C][/ROW]
[ROW][C]105[/C][C]-7[/C][C]-9.094[/C][C] 2.094[/C][/ROW]
[ROW][C]106[/C][C]-10[/C][C]-9.33[/C][C]-0.6704[/C][/ROW]
[ROW][C]107[/C][C]-11[/C][C]-9.33[/C][C]-1.67[/C][/ROW]
[ROW][C]108[/C][C]-11[/C][C]-9.29[/C][C]-1.71[/C][/ROW]
[ROW][C]109[/C][C]-12[/C][C]-9.29[/C][C]-2.71[/C][/ROW]
[ROW][C]110[/C][C]-14[/C][C]-9.251[/C][C]-4.749[/C][/ROW]
[ROW][C]111[/C][C]-12[/C][C]-9.29[/C][C]-2.71[/C][/ROW]
[ROW][C]112[/C][C]-9[/C][C]-9.369[/C][C] 0.3689[/C][/ROW]
[ROW][C]113[/C][C]-5[/C][C]-9.369[/C][C] 4.369[/C][/ROW]
[ROW][C]114[/C][C]-6[/C][C]-9.33[/C][C] 3.33[/C][/ROW]
[ROW][C]115[/C][C]-6[/C][C]-9.251[/C][C] 3.251[/C][/ROW]
[ROW][C]116[/C][C]-3[/C][C]-9.172[/C][C] 6.172[/C][/ROW]
[ROW][C]117[/C][C]-2[/C][C]-9.172[/C][C] 7.172[/C][/ROW]
[ROW][C]118[/C][C]-6[/C][C]-9.408[/C][C] 3.408[/C][/ROW]
[ROW][C]119[/C][C]-6[/C][C]-9.448[/C][C] 3.448[/C][/ROW]
[ROW][C]120[/C][C]-10[/C][C]-9.369[/C][C]-0.6311[/C][/ROW]
[/TABLE]
Source: https://freestatistics.org/blog/index.php?pk=286262&T=4

Globally Unique Identifier (entire table): ba.freestatistics.org/blog/index.php?pk=286262&T=4

As an alternative you can also use a QR Code:  

The GUIDs for individual cells are displayed in the table below:

Multiple Linear Regression - Actuals, Interpolation, and Residuals
Time or IndexActualsInterpolationForecastResidualsPrediction Error
1-8-9.251 1.251
2-9-9.212 0.2117
3-5-9.251 4.251
4-1-9.33 8.33
5-2-9.33 7.33
6-5-9.29 4.29
7-4-9.251 5.251
8-6-9.172 3.172
9-2-9.054 7.054
10-2-9.133 7.133
11-2-9.094 7.094
12-2-9.094 7.094
13 2-9.054 11.05
14 1-9.015 10.02
15-8-9.015 1.015
16-1-9.054 8.054
17 1-9.054 10.05
18-1-9.015 8.015
19 2-9.054 11.05
20 2-8.937 10.94
21 1-8.74 9.74
22-1-8.858 7.858
23-2-8.779 6.779
24-2-8.661 6.661
25-1-8.661 7.661
26-8-8.661 0.6614
27-4-8.74 4.74
28-6-8.779 2.779
29-3-8.701 5.701
30-3-8.583 5.583
31-7-8.426 1.426
32-9-8.308-0.6924
33-11-8.465-2.535
34-13-8.937-4.063
35-11-9.015-1.985
36-9-8.858-0.1421
37-17-8.622-8.378
38-22-8.504-13.5
39-25-8.622-16.38
40-20-8.937-11.06
41-24-9.054-14.95
42-24-9.054-14.95
43-22-8.937-13.06
44-19-8.779-10.22
45-18-8.819-9.181
46-17-9.094-7.906
47-11-9.172-1.828
48-11-9.094-1.906
49-12-9.015-2.985
50-10-9.015-0.9848
51-15-9.172-5.828
52-15-9.29-5.71
53-15-9.33-5.67
54-13-9.251-3.749
55-8-9.172 1.172
56-13-9.054-3.946
57-9-9.054 0.05448
58-7-9.369 2.369
59-4-9.33 5.33
60-4-9.251 5.251
61-2-9.094 7.094
62 0-8.976 8.976
63-2-8.937 6.937
64-3-8.858 5.858
65 1-8.74 9.74
66-2-8.622 6.622
67-1-8.504 7.504
68 1-8.465 9.465
69-3-8.504 5.504
70-4-8.937 4.937
71-9-9.054 0.05448
72-9-8.937-0.06344
73-7-8.779 1.779
74-14-8.661-5.339
75-12-8.661-3.339
76-16-8.779-7.221
77-20-8.779-11.22
78-12-8.701-3.299
79-12-8.701-3.299
80-10-8.661-1.339
81-10-8.661-1.339
82-13-8.858-4.142
83-16-8.976-7.024
84-14-9.015-4.985
85-17-9.094-7.906
86-24-9.172-14.83
87-25-9.212-15.79
88-23-9.29-13.71
89-17-9.251-7.749
90-24-9.212-14.79
91-20-9.172-10.83
92-19-9.054-9.946
93-18-9.054-8.946
94-16-9.33-6.67
95-12-9.33-2.67
96-7-9.29 2.29
97-6-9.251 3.251
98-6-9.251 3.251
99-5-9.29 4.29
100-4-9.369 5.369
101-4-9.33 5.33
102-8-9.29 1.29
103-9-9.212 0.2117
104-6-9.094 3.094
105-7-9.094 2.094
106-10-9.33-0.6704
107-11-9.33-1.67
108-11-9.29-1.71
109-12-9.29-2.71
110-14-9.251-4.749
111-12-9.29-2.71
112-9-9.369 0.3689
113-5-9.369 4.369
114-6-9.33 3.33
115-6-9.251 3.251
116-3-9.172 6.172
117-2-9.172 7.172
118-6-9.408 3.408
119-6-9.448 3.448
120-10-9.369-0.6311


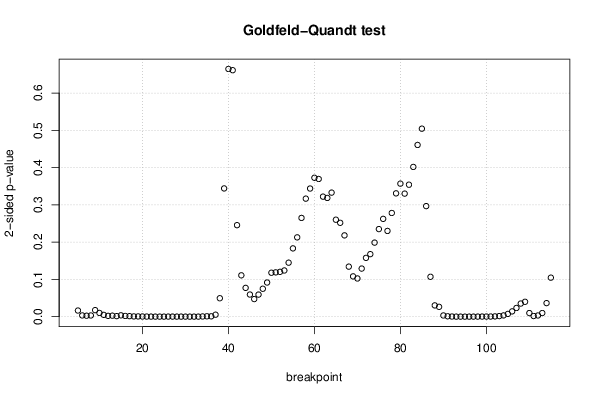
Goldfeld-Quandt test for Heteroskedasticity
p-valuesAlternative Hypothesis
breakpoint indexgreater2-sidedless
5 0.008221 0.01644 0.9918
6 0.001642 0.003284 0.9984
7 0.001254 0.002509 0.9987
8 0.001589 0.003178 0.9984
9 0.008758 0.01752 0.9912
10 0.004957 0.009913 0.995
11 0.002385 0.004769 0.9976
12 0.001037 0.002073 0.999
13 0.001311 0.002622 0.9987
14 0.0007129 0.001426 0.9993
15 0.001777 0.003554 0.9982
16 0.0009177 0.001835 0.9991
17 0.0006905 0.001381 0.9993
18 0.0003332 0.0006664 0.9997
19 0.0003204 0.0006409 0.9997
20 0.0002017 0.0004034 0.9998
21 0.0001177 0.0002355 0.9999
22 6.595e-05 0.0001319 0.9999
23 4.819e-05 9.639e-05 1
24 3.801e-05 7.602e-05 1
25 2.198e-05 4.397e-05 1
26 0.0001041 0.0002083 0.9999
27 6.758e-05 0.0001352 0.9999
28 5.998e-05 0.00012 0.9999
29 3.401e-05 6.803e-05 1
30 1.955e-05 3.91e-05 1
31 2.123e-05 4.247e-05 1
32 2.819e-05 5.638e-05 1
33 5.332e-05 0.0001066 0.9999
34 0.0002792 0.0005584 0.9997
35 0.0005037 0.001007 0.9995
36 0.0004594 0.0009187 0.9995
37 0.002596 0.005192 0.9974
38 0.02471 0.04942 0.9753
39 0.1721 0.3441 0.8279
40 0.3324 0.6649 0.6676
41 0.6692 0.6615 0.3308
42 0.8772 0.2456 0.1228
43 0.9445 0.1109 0.05547
44 0.9614 0.07726 0.03863
45 0.9703 0.05939 0.02969
46 0.9764 0.04723 0.02361
47 0.9704 0.05918 0.02959
48 0.9626 0.07486 0.03743
49 0.9542 0.09162 0.04581
50 0.9411 0.1179 0.05893
51 0.9406 0.1189 0.05943
52 0.9399 0.1202 0.06012
53 0.938 0.124 0.06198
54 0.9275 0.1449 0.07245
55 0.9084 0.1833 0.09164
56 0.8936 0.2129 0.1064
57 0.8675 0.265 0.1325
58 0.8416 0.3168 0.1584
59 0.828 0.3439 0.172
60 0.8136 0.3728 0.1864
61 0.8152 0.3696 0.1848
62 0.8389 0.3221 0.1611
63 0.8407 0.3187 0.1593
64 0.8335 0.3329 0.1665
65 0.8699 0.2601 0.1301
66 0.874 0.2519 0.126
67 0.8909 0.2182 0.1091
68 0.9329 0.1342 0.06712
69 0.9459 0.1082 0.05408
70 0.9488 0.1025 0.05125
71 0.9355 0.1291 0.06453
72 0.9211 0.1578 0.07888
73 0.9161 0.1678 0.0839
74 0.9007 0.1987 0.09934
75 0.8825 0.2351 0.1175
76 0.8688 0.2625 0.1312
77 0.885 0.2301 0.115
78 0.8609 0.2783 0.1391
79 0.8345 0.331 0.1655
80 0.8215 0.357 0.1785
81 0.8349 0.3303 0.1651
82 0.8229 0.3541 0.1771
83 0.7991 0.4019 0.2009
84 0.7696 0.4609 0.2304
85 0.7477 0.5045 0.2523
86 0.8516 0.2967 0.1484
87 0.9465 0.107 0.05351
88 0.9849 0.03024 0.01512
89 0.9868 0.02635 0.01317
90 0.9984 0.003214 0.001607
91 0.9995 0.0009692 0.0004846
92 0.9998 0.0003279 0.0001639
93 1 3.833e-05 1.916e-05
94 1 8.948e-06 4.474e-06
95 1 1.053e-05 5.265e-06
96 1 2.561e-05 1.28e-05
97 1 5.697e-05 2.848e-05
98 0.9999 0.0001239 6.197e-05
99 0.9999 0.00022 0.00011
100 0.9999 0.0002633 0.0001316
101 0.9998 0.0003051 0.0001526
102 0.9996 0.0007249 0.0003625
103 0.9992 0.001551 0.0007757
104 0.9983 0.003402 0.001701
105 0.9963 0.00732 0.00366
106 0.9929 0.01416 0.007079
107 0.9883 0.0233 0.01165
108 0.9824 0.03518 0.01759
109 0.9801 0.03988 0.01994
110 0.9952 0.009655 0.004828
111 0.9992 0.001691 0.0008457
112 0.9984 0.003172 0.001586
113 0.9951 0.009746 0.004873
114 0.9818 0.03636 0.01818
115 0.9477 0.1047 0.05233

\begin{tabular}{lllllllll}
\hline
Goldfeld-Quandt test for Heteroskedasticity \tabularnewline
p-values & Alternative Hypothesis \tabularnewline
breakpoint index & greater & 2-sided & less \tabularnewline
5 &  0.008221 &  0.01644 &  0.9918 \tabularnewline
6 &  0.001642 &  0.003284 &  0.9984 \tabularnewline
7 &  0.001254 &  0.002509 &  0.9987 \tabularnewline
8 &  0.001589 &  0.003178 &  0.9984 \tabularnewline
9 &  0.008758 &  0.01752 &  0.9912 \tabularnewline
10 &  0.004957 &  0.009913 &  0.995 \tabularnewline
11 &  0.002385 &  0.004769 &  0.9976 \tabularnewline
12 &  0.001037 &  0.002073 &  0.999 \tabularnewline
13 &  0.001311 &  0.002622 &  0.9987 \tabularnewline
14 &  0.0007129 &  0.001426 &  0.9993 \tabularnewline
15 &  0.001777 &  0.003554 &  0.9982 \tabularnewline
16 &  0.0009177 &  0.001835 &  0.9991 \tabularnewline
17 &  0.0006905 &  0.001381 &  0.9993 \tabularnewline
18 &  0.0003332 &  0.0006664 &  0.9997 \tabularnewline
19 &  0.0003204 &  0.0006409 &  0.9997 \tabularnewline
20 &  0.0002017 &  0.0004034 &  0.9998 \tabularnewline
21 &  0.0001177 &  0.0002355 &  0.9999 \tabularnewline
22 &  6.595e-05 &  0.0001319 &  0.9999 \tabularnewline
23 &  4.819e-05 &  9.639e-05 &  1 \tabularnewline
24 &  3.801e-05 &  7.602e-05 &  1 \tabularnewline
25 &  2.198e-05 &  4.397e-05 &  1 \tabularnewline
26 &  0.0001041 &  0.0002083 &  0.9999 \tabularnewline
27 &  6.758e-05 &  0.0001352 &  0.9999 \tabularnewline
28 &  5.998e-05 &  0.00012 &  0.9999 \tabularnewline
29 &  3.401e-05 &  6.803e-05 &  1 \tabularnewline
30 &  1.955e-05 &  3.91e-05 &  1 \tabularnewline
31 &  2.123e-05 &  4.247e-05 &  1 \tabularnewline
32 &  2.819e-05 &  5.638e-05 &  1 \tabularnewline
33 &  5.332e-05 &  0.0001066 &  0.9999 \tabularnewline
34 &  0.0002792 &  0.0005584 &  0.9997 \tabularnewline
35 &  0.0005037 &  0.001007 &  0.9995 \tabularnewline
36 &  0.0004594 &  0.0009187 &  0.9995 \tabularnewline
37 &  0.002596 &  0.005192 &  0.9974 \tabularnewline
38 &  0.02471 &  0.04942 &  0.9753 \tabularnewline
39 &  0.1721 &  0.3441 &  0.8279 \tabularnewline
40 &  0.3324 &  0.6649 &  0.6676 \tabularnewline
41 &  0.6692 &  0.6615 &  0.3308 \tabularnewline
42 &  0.8772 &  0.2456 &  0.1228 \tabularnewline
43 &  0.9445 &  0.1109 &  0.05547 \tabularnewline
44 &  0.9614 &  0.07726 &  0.03863 \tabularnewline
45 &  0.9703 &  0.05939 &  0.02969 \tabularnewline
46 &  0.9764 &  0.04723 &  0.02361 \tabularnewline
47 &  0.9704 &  0.05918 &  0.02959 \tabularnewline
48 &  0.9626 &  0.07486 &  0.03743 \tabularnewline
49 &  0.9542 &  0.09162 &  0.04581 \tabularnewline
50 &  0.9411 &  0.1179 &  0.05893 \tabularnewline
51 &  0.9406 &  0.1189 &  0.05943 \tabularnewline
52 &  0.9399 &  0.1202 &  0.06012 \tabularnewline
53 &  0.938 &  0.124 &  0.06198 \tabularnewline
54 &  0.9275 &  0.1449 &  0.07245 \tabularnewline
55 &  0.9084 &  0.1833 &  0.09164 \tabularnewline
56 &  0.8936 &  0.2129 &  0.1064 \tabularnewline
57 &  0.8675 &  0.265 &  0.1325 \tabularnewline
58 &  0.8416 &  0.3168 &  0.1584 \tabularnewline
59 &  0.828 &  0.3439 &  0.172 \tabularnewline
60 &  0.8136 &  0.3728 &  0.1864 \tabularnewline
61 &  0.8152 &  0.3696 &  0.1848 \tabularnewline
62 &  0.8389 &  0.3221 &  0.1611 \tabularnewline
63 &  0.8407 &  0.3187 &  0.1593 \tabularnewline
64 &  0.8335 &  0.3329 &  0.1665 \tabularnewline
65 &  0.8699 &  0.2601 &  0.1301 \tabularnewline
66 &  0.874 &  0.2519 &  0.126 \tabularnewline
67 &  0.8909 &  0.2182 &  0.1091 \tabularnewline
68 &  0.9329 &  0.1342 &  0.06712 \tabularnewline
69 &  0.9459 &  0.1082 &  0.05408 \tabularnewline
70 &  0.9488 &  0.1025 &  0.05125 \tabularnewline
71 &  0.9355 &  0.1291 &  0.06453 \tabularnewline
72 &  0.9211 &  0.1578 &  0.07888 \tabularnewline
73 &  0.9161 &  0.1678 &  0.0839 \tabularnewline
74 &  0.9007 &  0.1987 &  0.09934 \tabularnewline
75 &  0.8825 &  0.2351 &  0.1175 \tabularnewline
76 &  0.8688 &  0.2625 &  0.1312 \tabularnewline
77 &  0.885 &  0.2301 &  0.115 \tabularnewline
78 &  0.8609 &  0.2783 &  0.1391 \tabularnewline
79 &  0.8345 &  0.331 &  0.1655 \tabularnewline
80 &  0.8215 &  0.357 &  0.1785 \tabularnewline
81 &  0.8349 &  0.3303 &  0.1651 \tabularnewline
82 &  0.8229 &  0.3541 &  0.1771 \tabularnewline
83 &  0.7991 &  0.4019 &  0.2009 \tabularnewline
84 &  0.7696 &  0.4609 &  0.2304 \tabularnewline
85 &  0.7477 &  0.5045 &  0.2523 \tabularnewline
86 &  0.8516 &  0.2967 &  0.1484 \tabularnewline
87 &  0.9465 &  0.107 &  0.05351 \tabularnewline
88 &  0.9849 &  0.03024 &  0.01512 \tabularnewline
89 &  0.9868 &  0.02635 &  0.01317 \tabularnewline
90 &  0.9984 &  0.003214 &  0.001607 \tabularnewline
91 &  0.9995 &  0.0009692 &  0.0004846 \tabularnewline
92 &  0.9998 &  0.0003279 &  0.0001639 \tabularnewline
93 &  1 &  3.833e-05 &  1.916e-05 \tabularnewline
94 &  1 &  8.948e-06 &  4.474e-06 \tabularnewline
95 &  1 &  1.053e-05 &  5.265e-06 \tabularnewline
96 &  1 &  2.561e-05 &  1.28e-05 \tabularnewline
97 &  1 &  5.697e-05 &  2.848e-05 \tabularnewline
98 &  0.9999 &  0.0001239 &  6.197e-05 \tabularnewline
99 &  0.9999 &  0.00022 &  0.00011 \tabularnewline
100 &  0.9999 &  0.0002633 &  0.0001316 \tabularnewline
101 &  0.9998 &  0.0003051 &  0.0001526 \tabularnewline
102 &  0.9996 &  0.0007249 &  0.0003625 \tabularnewline
103 &  0.9992 &  0.001551 &  0.0007757 \tabularnewline
104 &  0.9983 &  0.003402 &  0.001701 \tabularnewline
105 &  0.9963 &  0.00732 &  0.00366 \tabularnewline
106 &  0.9929 &  0.01416 &  0.007079 \tabularnewline
107 &  0.9883 &  0.0233 &  0.01165 \tabularnewline
108 &  0.9824 &  0.03518 &  0.01759 \tabularnewline
109 &  0.9801 &  0.03988 &  0.01994 \tabularnewline
110 &  0.9952 &  0.009655 &  0.004828 \tabularnewline
111 &  0.9992 &  0.001691 &  0.0008457 \tabularnewline
112 &  0.9984 &  0.003172 &  0.001586 \tabularnewline
113 &  0.9951 &  0.009746 &  0.004873 \tabularnewline
114 &  0.9818 &  0.03636 &  0.01818 \tabularnewline
115 &  0.9477 &  0.1047 &  0.05233 \tabularnewline
\hline
\end{tabular}
%Source: https://freestatistics.org/blog/index.php?pk=286262&T=5

[TABLE]
[ROW][C]Goldfeld-Quandt test for Heteroskedasticity[/C][/ROW]
[ROW][C]p-values[/C][C]Alternative Hypothesis[/C][/ROW]
[ROW][C]breakpoint index[/C][C]greater[/C][C]2-sided[/C][C]less[/C][/ROW]
[ROW][C]5[/C][C] 0.008221[/C][C] 0.01644[/C][C] 0.9918[/C][/ROW]
[ROW][C]6[/C][C] 0.001642[/C][C] 0.003284[/C][C] 0.9984[/C][/ROW]
[ROW][C]7[/C][C] 0.001254[/C][C] 0.002509[/C][C] 0.9987[/C][/ROW]
[ROW][C]8[/C][C] 0.001589[/C][C] 0.003178[/C][C] 0.9984[/C][/ROW]
[ROW][C]9[/C][C] 0.008758[/C][C] 0.01752[/C][C] 0.9912[/C][/ROW]
[ROW][C]10[/C][C] 0.004957[/C][C] 0.009913[/C][C] 0.995[/C][/ROW]
[ROW][C]11[/C][C] 0.002385[/C][C] 0.004769[/C][C] 0.9976[/C][/ROW]
[ROW][C]12[/C][C] 0.001037[/C][C] 0.002073[/C][C] 0.999[/C][/ROW]
[ROW][C]13[/C][C] 0.001311[/C][C] 0.002622[/C][C] 0.9987[/C][/ROW]
[ROW][C]14[/C][C] 0.0007129[/C][C] 0.001426[/C][C] 0.9993[/C][/ROW]
[ROW][C]15[/C][C] 0.001777[/C][C] 0.003554[/C][C] 0.9982[/C][/ROW]
[ROW][C]16[/C][C] 0.0009177[/C][C] 0.001835[/C][C] 0.9991[/C][/ROW]
[ROW][C]17[/C][C] 0.0006905[/C][C] 0.001381[/C][C] 0.9993[/C][/ROW]
[ROW][C]18[/C][C] 0.0003332[/C][C] 0.0006664[/C][C] 0.9997[/C][/ROW]
[ROW][C]19[/C][C] 0.0003204[/C][C] 0.0006409[/C][C] 0.9997[/C][/ROW]
[ROW][C]20[/C][C] 0.0002017[/C][C] 0.0004034[/C][C] 0.9998[/C][/ROW]
[ROW][C]21[/C][C] 0.0001177[/C][C] 0.0002355[/C][C] 0.9999[/C][/ROW]
[ROW][C]22[/C][C] 6.595e-05[/C][C] 0.0001319[/C][C] 0.9999[/C][/ROW]
[ROW][C]23[/C][C] 4.819e-05[/C][C] 9.639e-05[/C][C] 1[/C][/ROW]
[ROW][C]24[/C][C] 3.801e-05[/C][C] 7.602e-05[/C][C] 1[/C][/ROW]
[ROW][C]25[/C][C] 2.198e-05[/C][C] 4.397e-05[/C][C] 1[/C][/ROW]
[ROW][C]26[/C][C] 0.0001041[/C][C] 0.0002083[/C][C] 0.9999[/C][/ROW]
[ROW][C]27[/C][C] 6.758e-05[/C][C] 0.0001352[/C][C] 0.9999[/C][/ROW]
[ROW][C]28[/C][C] 5.998e-05[/C][C] 0.00012[/C][C] 0.9999[/C][/ROW]
[ROW][C]29[/C][C] 3.401e-05[/C][C] 6.803e-05[/C][C] 1[/C][/ROW]
[ROW][C]30[/C][C] 1.955e-05[/C][C] 3.91e-05[/C][C] 1[/C][/ROW]
[ROW][C]31[/C][C] 2.123e-05[/C][C] 4.247e-05[/C][C] 1[/C][/ROW]
[ROW][C]32[/C][C] 2.819e-05[/C][C] 5.638e-05[/C][C] 1[/C][/ROW]
[ROW][C]33[/C][C] 5.332e-05[/C][C] 0.0001066[/C][C] 0.9999[/C][/ROW]
[ROW][C]34[/C][C] 0.0002792[/C][C] 0.0005584[/C][C] 0.9997[/C][/ROW]
[ROW][C]35[/C][C] 0.0005037[/C][C] 0.001007[/C][C] 0.9995[/C][/ROW]
[ROW][C]36[/C][C] 0.0004594[/C][C] 0.0009187[/C][C] 0.9995[/C][/ROW]
[ROW][C]37[/C][C] 0.002596[/C][C] 0.005192[/C][C] 0.9974[/C][/ROW]
[ROW][C]38[/C][C] 0.02471[/C][C] 0.04942[/C][C] 0.9753[/C][/ROW]
[ROW][C]39[/C][C] 0.1721[/C][C] 0.3441[/C][C] 0.8279[/C][/ROW]
[ROW][C]40[/C][C] 0.3324[/C][C] 0.6649[/C][C] 0.6676[/C][/ROW]
[ROW][C]41[/C][C] 0.6692[/C][C] 0.6615[/C][C] 0.3308[/C][/ROW]
[ROW][C]42[/C][C] 0.8772[/C][C] 0.2456[/C][C] 0.1228[/C][/ROW]
[ROW][C]43[/C][C] 0.9445[/C][C] 0.1109[/C][C] 0.05547[/C][/ROW]
[ROW][C]44[/C][C] 0.9614[/C][C] 0.07726[/C][C] 0.03863[/C][/ROW]
[ROW][C]45[/C][C] 0.9703[/C][C] 0.05939[/C][C] 0.02969[/C][/ROW]
[ROW][C]46[/C][C] 0.9764[/C][C] 0.04723[/C][C] 0.02361[/C][/ROW]
[ROW][C]47[/C][C] 0.9704[/C][C] 0.05918[/C][C] 0.02959[/C][/ROW]
[ROW][C]48[/C][C] 0.9626[/C][C] 0.07486[/C][C] 0.03743[/C][/ROW]
[ROW][C]49[/C][C] 0.9542[/C][C] 0.09162[/C][C] 0.04581[/C][/ROW]
[ROW][C]50[/C][C] 0.9411[/C][C] 0.1179[/C][C] 0.05893[/C][/ROW]
[ROW][C]51[/C][C] 0.9406[/C][C] 0.1189[/C][C] 0.05943[/C][/ROW]
[ROW][C]52[/C][C] 0.9399[/C][C] 0.1202[/C][C] 0.06012[/C][/ROW]
[ROW][C]53[/C][C] 0.938[/C][C] 0.124[/C][C] 0.06198[/C][/ROW]
[ROW][C]54[/C][C] 0.9275[/C][C] 0.1449[/C][C] 0.07245[/C][/ROW]
[ROW][C]55[/C][C] 0.9084[/C][C] 0.1833[/C][C] 0.09164[/C][/ROW]
[ROW][C]56[/C][C] 0.8936[/C][C] 0.2129[/C][C] 0.1064[/C][/ROW]
[ROW][C]57[/C][C] 0.8675[/C][C] 0.265[/C][C] 0.1325[/C][/ROW]
[ROW][C]58[/C][C] 0.8416[/C][C] 0.3168[/C][C] 0.1584[/C][/ROW]
[ROW][C]59[/C][C] 0.828[/C][C] 0.3439[/C][C] 0.172[/C][/ROW]
[ROW][C]60[/C][C] 0.8136[/C][C] 0.3728[/C][C] 0.1864[/C][/ROW]
[ROW][C]61[/C][C] 0.8152[/C][C] 0.3696[/C][C] 0.1848[/C][/ROW]
[ROW][C]62[/C][C] 0.8389[/C][C] 0.3221[/C][C] 0.1611[/C][/ROW]
[ROW][C]63[/C][C] 0.8407[/C][C] 0.3187[/C][C] 0.1593[/C][/ROW]
[ROW][C]64[/C][C] 0.8335[/C][C] 0.3329[/C][C] 0.1665[/C][/ROW]
[ROW][C]65[/C][C] 0.8699[/C][C] 0.2601[/C][C] 0.1301[/C][/ROW]
[ROW][C]66[/C][C] 0.874[/C][C] 0.2519[/C][C] 0.126[/C][/ROW]
[ROW][C]67[/C][C] 0.8909[/C][C] 0.2182[/C][C] 0.1091[/C][/ROW]
[ROW][C]68[/C][C] 0.9329[/C][C] 0.1342[/C][C] 0.06712[/C][/ROW]
[ROW][C]69[/C][C] 0.9459[/C][C] 0.1082[/C][C] 0.05408[/C][/ROW]
[ROW][C]70[/C][C] 0.9488[/C][C] 0.1025[/C][C] 0.05125[/C][/ROW]
[ROW][C]71[/C][C] 0.9355[/C][C] 0.1291[/C][C] 0.06453[/C][/ROW]
[ROW][C]72[/C][C] 0.9211[/C][C] 0.1578[/C][C] 0.07888[/C][/ROW]
[ROW][C]73[/C][C] 0.9161[/C][C] 0.1678[/C][C] 0.0839[/C][/ROW]
[ROW][C]74[/C][C] 0.9007[/C][C] 0.1987[/C][C] 0.09934[/C][/ROW]
[ROW][C]75[/C][C] 0.8825[/C][C] 0.2351[/C][C] 0.1175[/C][/ROW]
[ROW][C]76[/C][C] 0.8688[/C][C] 0.2625[/C][C] 0.1312[/C][/ROW]
[ROW][C]77[/C][C] 0.885[/C][C] 0.2301[/C][C] 0.115[/C][/ROW]
[ROW][C]78[/C][C] 0.8609[/C][C] 0.2783[/C][C] 0.1391[/C][/ROW]
[ROW][C]79[/C][C] 0.8345[/C][C] 0.331[/C][C] 0.1655[/C][/ROW]
[ROW][C]80[/C][C] 0.8215[/C][C] 0.357[/C][C] 0.1785[/C][/ROW]
[ROW][C]81[/C][C] 0.8349[/C][C] 0.3303[/C][C] 0.1651[/C][/ROW]
[ROW][C]82[/C][C] 0.8229[/C][C] 0.3541[/C][C] 0.1771[/C][/ROW]
[ROW][C]83[/C][C] 0.7991[/C][C] 0.4019[/C][C] 0.2009[/C][/ROW]
[ROW][C]84[/C][C] 0.7696[/C][C] 0.4609[/C][C] 0.2304[/C][/ROW]
[ROW][C]85[/C][C] 0.7477[/C][C] 0.5045[/C][C] 0.2523[/C][/ROW]
[ROW][C]86[/C][C] 0.8516[/C][C] 0.2967[/C][C] 0.1484[/C][/ROW]
[ROW][C]87[/C][C] 0.9465[/C][C] 0.107[/C][C] 0.05351[/C][/ROW]
[ROW][C]88[/C][C] 0.9849[/C][C] 0.03024[/C][C] 0.01512[/C][/ROW]
[ROW][C]89[/C][C] 0.9868[/C][C] 0.02635[/C][C] 0.01317[/C][/ROW]
[ROW][C]90[/C][C] 0.9984[/C][C] 0.003214[/C][C] 0.001607[/C][/ROW]
[ROW][C]91[/C][C] 0.9995[/C][C] 0.0009692[/C][C] 0.0004846[/C][/ROW]
[ROW][C]92[/C][C] 0.9998[/C][C] 0.0003279[/C][C] 0.0001639[/C][/ROW]
[ROW][C]93[/C][C] 1[/C][C] 3.833e-05[/C][C] 1.916e-05[/C][/ROW]
[ROW][C]94[/C][C] 1[/C][C] 8.948e-06[/C][C] 4.474e-06[/C][/ROW]
[ROW][C]95[/C][C] 1[/C][C] 1.053e-05[/C][C] 5.265e-06[/C][/ROW]
[ROW][C]96[/C][C] 1[/C][C] 2.561e-05[/C][C] 1.28e-05[/C][/ROW]
[ROW][C]97[/C][C] 1[/C][C] 5.697e-05[/C][C] 2.848e-05[/C][/ROW]
[ROW][C]98[/C][C] 0.9999[/C][C] 0.0001239[/C][C] 6.197e-05[/C][/ROW]
[ROW][C]99[/C][C] 0.9999[/C][C] 0.00022[/C][C] 0.00011[/C][/ROW]
[ROW][C]100[/C][C] 0.9999[/C][C] 0.0002633[/C][C] 0.0001316[/C][/ROW]
[ROW][C]101[/C][C] 0.9998[/C][C] 0.0003051[/C][C] 0.0001526[/C][/ROW]
[ROW][C]102[/C][C] 0.9996[/C][C] 0.0007249[/C][C] 0.0003625[/C][/ROW]
[ROW][C]103[/C][C] 0.9992[/C][C] 0.001551[/C][C] 0.0007757[/C][/ROW]
[ROW][C]104[/C][C] 0.9983[/C][C] 0.003402[/C][C] 0.001701[/C][/ROW]
[ROW][C]105[/C][C] 0.9963[/C][C] 0.00732[/C][C] 0.00366[/C][/ROW]
[ROW][C]106[/C][C] 0.9929[/C][C] 0.01416[/C][C] 0.007079[/C][/ROW]
[ROW][C]107[/C][C] 0.9883[/C][C] 0.0233[/C][C] 0.01165[/C][/ROW]
[ROW][C]108[/C][C] 0.9824[/C][C] 0.03518[/C][C] 0.01759[/C][/ROW]
[ROW][C]109[/C][C] 0.9801[/C][C] 0.03988[/C][C] 0.01994[/C][/ROW]
[ROW][C]110[/C][C] 0.9952[/C][C] 0.009655[/C][C] 0.004828[/C][/ROW]
[ROW][C]111[/C][C] 0.9992[/C][C] 0.001691[/C][C] 0.0008457[/C][/ROW]
[ROW][C]112[/C][C] 0.9984[/C][C] 0.003172[/C][C] 0.001586[/C][/ROW]
[ROW][C]113[/C][C] 0.9951[/C][C] 0.009746[/C][C] 0.004873[/C][/ROW]
[ROW][C]114[/C][C] 0.9818[/C][C] 0.03636[/C][C] 0.01818[/C][/ROW]
[ROW][C]115[/C][C] 0.9477[/C][C] 0.1047[/C][C] 0.05233[/C][/ROW]
[/TABLE]
Source: https://freestatistics.org/blog/index.php?pk=286262&T=5

Globally Unique Identifier (entire table): ba.freestatistics.org/blog/index.php?pk=286262&T=5

As an alternative you can also use a QR Code:  

The GUIDs for individual cells are displayed in the table below:

Goldfeld-Quandt test for Heteroskedasticity
p-valuesAlternative Hypothesis
breakpoint indexgreater2-sidedless
5 0.008221 0.01644 0.9918
6 0.001642 0.003284 0.9984
7 0.001254 0.002509 0.9987
8 0.001589 0.003178 0.9984
9 0.008758 0.01752 0.9912
10 0.004957 0.009913 0.995
11 0.002385 0.004769 0.9976
12 0.001037 0.002073 0.999
13 0.001311 0.002622 0.9987
14 0.0007129 0.001426 0.9993
15 0.001777 0.003554 0.9982
16 0.0009177 0.001835 0.9991
17 0.0006905 0.001381 0.9993
18 0.0003332 0.0006664 0.9997
19 0.0003204 0.0006409 0.9997
20 0.0002017 0.0004034 0.9998
21 0.0001177 0.0002355 0.9999
22 6.595e-05 0.0001319 0.9999
23 4.819e-05 9.639e-05 1
24 3.801e-05 7.602e-05 1
25 2.198e-05 4.397e-05 1
26 0.0001041 0.0002083 0.9999
27 6.758e-05 0.0001352 0.9999
28 5.998e-05 0.00012 0.9999
29 3.401e-05 6.803e-05 1
30 1.955e-05 3.91e-05 1
31 2.123e-05 4.247e-05 1
32 2.819e-05 5.638e-05 1
33 5.332e-05 0.0001066 0.9999
34 0.0002792 0.0005584 0.9997
35 0.0005037 0.001007 0.9995
36 0.0004594 0.0009187 0.9995
37 0.002596 0.005192 0.9974
38 0.02471 0.04942 0.9753
39 0.1721 0.3441 0.8279
40 0.3324 0.6649 0.6676
41 0.6692 0.6615 0.3308
42 0.8772 0.2456 0.1228
43 0.9445 0.1109 0.05547
44 0.9614 0.07726 0.03863
45 0.9703 0.05939 0.02969
46 0.9764 0.04723 0.02361
47 0.9704 0.05918 0.02959
48 0.9626 0.07486 0.03743
49 0.9542 0.09162 0.04581
50 0.9411 0.1179 0.05893
51 0.9406 0.1189 0.05943
52 0.9399 0.1202 0.06012
53 0.938 0.124 0.06198
54 0.9275 0.1449 0.07245
55 0.9084 0.1833 0.09164
56 0.8936 0.2129 0.1064
57 0.8675 0.265 0.1325
58 0.8416 0.3168 0.1584
59 0.828 0.3439 0.172
60 0.8136 0.3728 0.1864
61 0.8152 0.3696 0.1848
62 0.8389 0.3221 0.1611
63 0.8407 0.3187 0.1593
64 0.8335 0.3329 0.1665
65 0.8699 0.2601 0.1301
66 0.874 0.2519 0.126
67 0.8909 0.2182 0.1091
68 0.9329 0.1342 0.06712
69 0.9459 0.1082 0.05408
70 0.9488 0.1025 0.05125
71 0.9355 0.1291 0.06453
72 0.9211 0.1578 0.07888
73 0.9161 0.1678 0.0839
74 0.9007 0.1987 0.09934
75 0.8825 0.2351 0.1175
76 0.8688 0.2625 0.1312
77 0.885 0.2301 0.115
78 0.8609 0.2783 0.1391
79 0.8345 0.331 0.1655
80 0.8215 0.357 0.1785
81 0.8349 0.3303 0.1651
82 0.8229 0.3541 0.1771
83 0.7991 0.4019 0.2009
84 0.7696 0.4609 0.2304
85 0.7477 0.5045 0.2523
86 0.8516 0.2967 0.1484
87 0.9465 0.107 0.05351
88 0.9849 0.03024 0.01512
89 0.9868 0.02635 0.01317
90 0.9984 0.003214 0.001607
91 0.9995 0.0009692 0.0004846
92 0.9998 0.0003279 0.0001639
93 1 3.833e-05 1.916e-05
94 1 8.948e-06 4.474e-06
95 1 1.053e-05 5.265e-06
96 1 2.561e-05 1.28e-05
97 1 5.697e-05 2.848e-05
98 0.9999 0.0001239 6.197e-05
99 0.9999 0.00022 0.00011
100 0.9999 0.0002633 0.0001316
101 0.9998 0.0003051 0.0001526
102 0.9996 0.0007249 0.0003625
103 0.9992 0.001551 0.0007757
104 0.9983 0.003402 0.001701
105 0.9963 0.00732 0.00366
106 0.9929 0.01416 0.007079
107 0.9883 0.0233 0.01165
108 0.9824 0.03518 0.01759
109 0.9801 0.03988 0.01994
110 0.9952 0.009655 0.004828
111 0.9992 0.001691 0.0008457
112 0.9984 0.003172 0.001586
113 0.9951 0.009746 0.004873
114 0.9818 0.03636 0.01818
115 0.9477 0.1047 0.05233


Meta Analysis of Goldfeld-Quandt test for Heteroskedasticity
Description# significant tests% significant testsOK/NOK
1% type I error level51 0.4595NOK
5% type I error level620.558559NOK
10% type I error level670.603604NOK

\begin{tabular}{lllllllll}
\hline
Meta Analysis of Goldfeld-Quandt test for Heteroskedasticity \tabularnewline
Description & # significant tests & % significant tests & OK/NOK \tabularnewline
1% type I error level & 51 &  0.4595 & NOK \tabularnewline
5% type I error level & 62 & 0.558559 & NOK \tabularnewline
10% type I error level & 67 & 0.603604 & NOK \tabularnewline
\hline
\end{tabular}
%Source: https://freestatistics.org/blog/index.php?pk=286262&T=6

[TABLE]
[ROW][C]Meta Analysis of Goldfeld-Quandt test for Heteroskedasticity[/C][/ROW]
[ROW][C]Description[/C][C]# significant tests[/C][C]% significant tests[/C][C]OK/NOK[/C][/ROW]
[ROW][C]1% type I error level[/C][C]51[/C][C] 0.4595[/C][C]NOK[/C][/ROW]
[ROW][C]5% type I error level[/C][C]62[/C][C]0.558559[/C][C]NOK[/C][/ROW]
[ROW][C]10% type I error level[/C][C]67[/C][C]0.603604[/C][C]NOK[/C][/ROW]
[/TABLE]
Source: https://freestatistics.org/blog/index.php?pk=286262&T=6

Globally Unique Identifier (entire table): ba.freestatistics.org/blog/index.php?pk=286262&T=6

As an alternative you can also use a QR Code:  

The GUIDs for individual cells are displayed in the table below:

Meta Analysis of Goldfeld-Quandt test for Heteroskedasticity
Description# significant tests% significant testsOK/NOK
1% type I error level51 0.4595NOK
5% type I error level620.558559NOK
10% type I error level670.603604NOK


Parameters (Session):
Parameters (R input):
par1 = ; par2 = ; par3 = ; par4 = ; par5 = ; par6 = ; par7 = ; par8 = ; par9 = ; par10 = ; par11 = ; par12 = ; par13 = ; par14 = ; par15 = ; par16 = ; par17 = ; par18 = ; par19 = ; par20 = ;
R code (references can be found in the software module):
par5 <- '0'
par4 <- '0'
par3 <- 'No Linear Trend'
par2 <- 'Do not include Seasonal Dummies'
par1 <- '1'
library(lattice)
library(lmtest)
n25 <- 25 #minimum number of obs. for Goldfeld-Quandt test
mywarning <- ''
par1 <- as.numeric(par1)
if(is.na(par1)) {
par1 <- 1
mywarning = 'Warning: you did not specify the column number of the endogenous series! The first column was selected by default.'
}
if (par4=='') par4 <- 0
par4 <- as.numeric(par4)
if (par5=='') par5 <- 0
par5 <- as.numeric(par5)
x <- na.omit(t(y))
k <- length(x[1,])
n <- length(x[,1])
x1 <- cbind(x[,par1], x[,1:k!=par1])
mycolnames <- c(colnames(x)[par1], colnames(x)[1:k!=par1])
colnames(x1) <- mycolnames #colnames(x)[par1]
x <- x1
if (par3 == 'First Differences'){
(n <- n -1)
x2 <- array(0, dim=c(n,k), dimnames=list(1:n, paste('(1-B)',colnames(x),sep='')))
for (i in 1:n) {
for (j in 1:k) {
x2[i,j] <- x[i+1,j] - x[i,j]
}
}
x <- x2
}
if (par3 == 'Seasonal Differences (s=12)'){
(n <- n - 12)
x2 <- array(0, dim=c(n,k), dimnames=list(1:n, paste('(1-B12)',colnames(x),sep='')))
for (i in 1:n) {
for (j in 1:k) {
x2[i,j] <- x[i+12,j] - x[i,j]
}
}
x <- x2
}
if (par3 == 'First and Seasonal Differences (s=12)'){
(n <- n -1)
x2 <- array(0, dim=c(n,k), dimnames=list(1:n, paste('(1-B)',colnames(x),sep='')))
for (i in 1:n) {
for (j in 1:k) {
x2[i,j] <- x[i+1,j] - x[i,j]
}
}
x <- x2
(n <- n - 12)
x2 <- array(0, dim=c(n,k), dimnames=list(1:n, paste('(1-B12)',colnames(x),sep='')))
for (i in 1:n) {
for (j in 1:k) {
x2[i,j] <- x[i+12,j] - x[i,j]
}
}
x <- x2
}
if(par4 > 0) {
x2 <- array(0, dim=c(n-par4,par4), dimnames=list(1:(n-par4), paste(colnames(x)[par1],'(t-',1:par4,')',sep='')))
for (i in 1:(n-par4)) {
for (j in 1:par4) {
x2[i,j] <- x[i+par4-j,par1]
}
}
x <- cbind(x[(par4+1):n,], x2)
n <- n - par4
}
if(par5 > 0) {
x2 <- array(0, dim=c(n-par5*12,par5), dimnames=list(1:(n-par5*12), paste(colnames(x)[par1],'(t-',1:par5,'s)',sep='')))
for (i in 1:(n-par5*12)) {
for (j in 1:par5) {
x2[i,j] <- x[i+par5*12-j*12,par1]
}
}
x <- cbind(x[(par5*12+1):n,], x2)
n <- n - par5*12
}
if (par2 == 'Include Monthly Dummies'){
x2 <- array(0, dim=c(n,11), dimnames=list(1:n, paste('M', seq(1:11), sep ='')))
for (i in 1:11){
x2[seq(i,n,12),i] <- 1
}
x <- cbind(x, x2)
}
if (par2 == 'Include Quarterly Dummies'){
x2 <- array(0, dim=c(n,3), dimnames=list(1:n, paste('Q', seq(1:3), sep ='')))
for (i in 1:3){
x2[seq(i,n,4),i] <- 1
}
x <- cbind(x, x2)
}
(k <- length(x[n,]))
if (par3 == 'Linear Trend'){
x <- cbind(x, c(1:n))
colnames(x)[k+1] <- 't'
}
x
(k <- length(x[n,]))
head(x)
df <- as.data.frame(x)
(mylm <- lm(df))
(mysum <- summary(mylm))
if (n > n25) {
kp3 <- k + 3
nmkm3 <- n - k - 3
gqarr <- array(NA, dim=c(nmkm3-kp3+1,3))
numgqtests <- 0
numsignificant1 <- 0
numsignificant5 <- 0
numsignificant10 <- 0
for (mypoint in kp3:nmkm3) {
j <- 0
numgqtests <- numgqtests + 1
for (myalt in c('greater', 'two.sided', 'less')) {
j <- j + 1
gqarr[mypoint-kp3+1,j] <- gqtest(mylm, point=mypoint, alternative=myalt)$p.value
}
if (gqarr[mypoint-kp3+1,2] < 0.01) numsignificant1 <- numsignificant1 + 1
if (gqarr[mypoint-kp3+1,2] < 0.05) numsignificant5 <- numsignificant5 + 1
if (gqarr[mypoint-kp3+1,2] < 0.10) numsignificant10 <- numsignificant10 + 1
}
gqarr
}
bitmap(file='test0.png')
plot(x[,1], type='l', main='Actuals and Interpolation', ylab='value of Actuals and Interpolation (dots)', xlab='time or index')
points(x[,1]-mysum$resid)
grid()
dev.off()
bitmap(file='test1.png')
plot(mysum$resid, type='b', pch=19, main='Residuals', ylab='value of Residuals', xlab='time or index')
grid()
dev.off()
bitmap(file='test2.png')
hist(mysum$resid, main='Residual Histogram', xlab='values of Residuals')
grid()
dev.off()
bitmap(file='test3.png')
densityplot(~mysum$resid,col='black',main='Residual Density Plot', xlab='values of Residuals')
dev.off()
bitmap(file='test4.png')
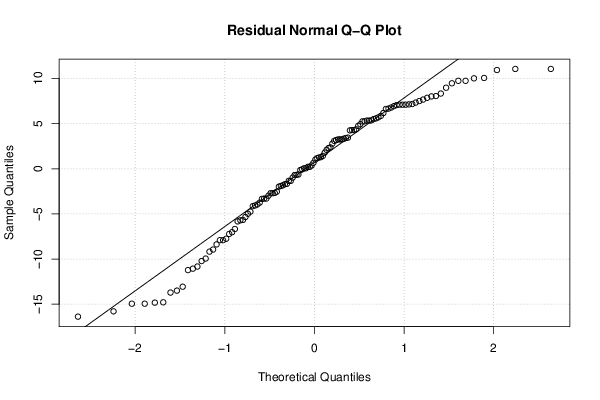
qqnorm(mysum$resid, main='Residual Normal Q-Q Plot')
qqline(mysum$resid)
grid()
dev.off()
(myerror <- as.ts(mysum$resid))
bitmap(file='test5.png')
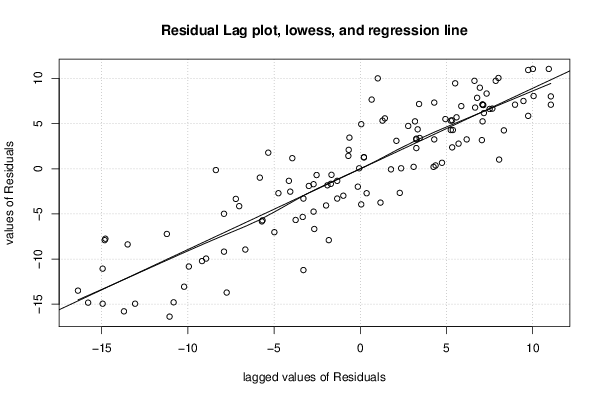
dum <- cbind(lag(myerror,k=1),myerror)
dum
dum1 <- dum[2:length(myerror),]
dum1
z <- as.data.frame(dum1)
z
plot(z,main=paste('Residual Lag plot, lowess, and regression line'), ylab='values of Residuals', xlab='lagged values of Residuals')
lines(lowess(z))
abline(lm(z))
grid()
dev.off()
bitmap(file='test6.png')
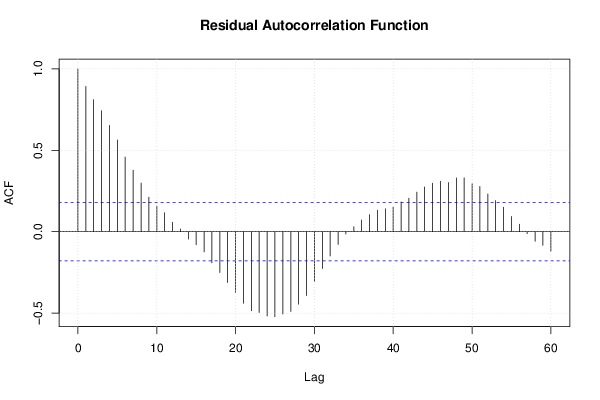
acf(mysum$resid, lag.max=length(mysum$resid)/2, main='Residual Autocorrelation Function')
grid()
dev.off()
bitmap(file='test7.png')
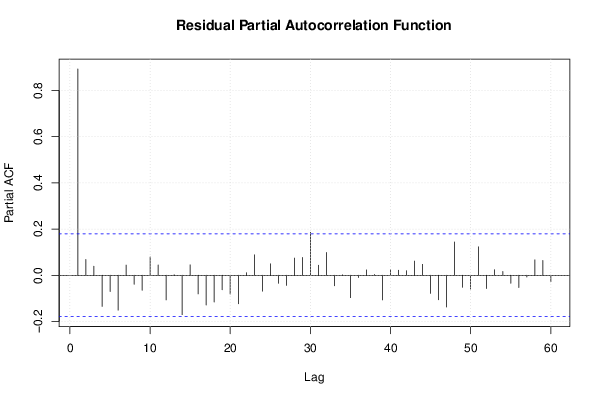
pacf(mysum$resid, lag.max=length(mysum$resid)/2, main='Residual Partial Autocorrelation Function')
grid()
dev.off()
bitmap(file='test8.png')
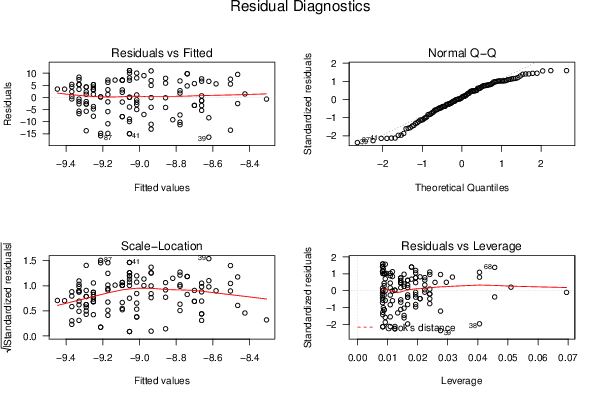
opar <- par(mfrow = c(2,2), oma = c(0, 0, 1.1, 0))
plot(mylm, las = 1, sub='Residual Diagnostics')
par(opar)
dev.off()
if (n > n25) {
bitmap(file='test9.png')
plot(kp3:nmkm3,gqarr[,2], main='Goldfeld-Quandt test',ylab='2-sided p-value',xlab='breakpoint')
grid()
dev.off()
}
load(file='createtable')
a<-table.start()
a<-table.row.start(a)
a<-table.element(a, 'Multiple Linear Regression - Estimated Regression Equation', 1, TRUE)
a<-table.row.end(a)
myeq <- colnames(x)[1]
myeq <- paste(myeq, '[t] = ', sep='')
for (i in 1:k){
if (mysum$coefficients[i,1] > 0) myeq <- paste(myeq, '+', '')
myeq <- paste(myeq, signif(mysum$coefficients[i,1],6), sep=' ')
if (rownames(mysum$coefficients)[i] != '(Intercept)') {
myeq <- paste(myeq, rownames(mysum$coefficients)[i], sep='')
if (rownames(mysum$coefficients)[i] != 't') myeq <- paste(myeq, '[t]', sep='')
}
}
myeq <- paste(myeq, ' + e[t]')
a<-table.row.start(a)
a<-table.element(a, myeq)
a<-table.row.end(a)
a<-table.row.start(a)
a<-table.element(a, mywarning)
a<-table.row.end(a)
a<-table.end(a)
table.save(a,file='mytable1.tab')
a<-table.start()
a<-table.row.start(a)
a<-table.element(a,hyperlink('ols1.htm','Multiple Linear Regression - Ordinary Least Squares',''), 6, TRUE)
a<-table.row.end(a)
a<-table.row.start(a)
a<-table.element(a,'Variable',header=TRUE)
a<-table.element(a,'Parameter',header=TRUE)
a<-table.element(a,'S.D.',header=TRUE)
a<-table.element(a,'T-STAT
H0: parameter = 0',header=TRUE)
a<-table.element(a,'2-tail p-value',header=TRUE)
a<-table.element(a,'1-tail p-value',header=TRUE)
a<-table.row.end(a)
for (i in 1:k){
a<-table.row.start(a)
a<-table.element(a,rownames(mysum$coefficients)[i],header=TRUE)
a<-table.element(a,formatC(signif(mysum$coefficients[i,1],5),format='g',flag='+'))
a<-table.element(a,formatC(signif(mysum$coefficients[i,2],5),format='g',flag=' '))
a<-table.element(a,formatC(signif(mysum$coefficients[i,3],4),format='e',flag='+'))
a<-table.element(a,formatC(signif(mysum$coefficients[i,4],4),format='g',flag=' '))
a<-table.element(a,formatC(signif(mysum$coefficients[i,4]/2,4),format='g',flag=' '))
a<-table.row.end(a)
}
a<-table.end(a)
table.save(a,file='mytable2.tab')
a<-table.start()
a<-table.row.start(a)
a<-table.element(a, 'Multiple Linear Regression - Regression Statistics', 2, TRUE)
a<-table.row.end(a)
a<-table.row.start(a)
a<-table.element(a, 'Multiple R',1,TRUE)
a<-table.element(a,formatC(signif(sqrt(mysum$r.squared),6),format='g',flag=' '))
a<-table.row.end(a)
a<-table.row.start(a)
a<-table.element(a, 'R-squared',1,TRUE)
a<-table.element(a,formatC(signif(mysum$r.squared,6),format='g',flag=' '))
a<-table.row.end(a)
a<-table.row.start(a)
a<-table.element(a, 'Adjusted R-squared',1,TRUE)
a<-table.element(a,formatC(signif(mysum$adj.r.squared,6),format='g',flag=' '))
a<-table.row.end(a)
a<-table.row.start(a)
a<-table.element(a, 'F-TEST (value)',1,TRUE)
a<-table.element(a,formatC(signif(mysum$fstatistic[1],6),format='g',flag=' '))
a<-table.row.end(a)
a<-table.row.start(a)
a<-table.element(a, 'F-TEST (DF numerator)',1,TRUE)
a<-table.element(a, signif(mysum$fstatistic[2],6))
a<-table.row.end(a)
a<-table.row.start(a)
a<-table.element(a, 'F-TEST (DF denominator)',1,TRUE)
a<-table.element(a, signif(mysum$fstatistic[3],6))
a<-table.row.end(a)
a<-table.row.start(a)
a<-table.element(a, 'p-value',1,TRUE)
a<-table.element(a,formatC(signif(1-pf(mysum$fstatistic[1],mysum$fstatistic[2],mysum$fstatistic[3]),6),format='g',flag=' '))
a<-table.row.end(a)
a<-table.row.start(a)
a<-table.element(a, 'Multiple Linear Regression - Residual Statistics', 2, TRUE)
a<-table.row.end(a)
a<-table.row.start(a)
a<-table.element(a, 'Residual Standard Deviation',1,TRUE)
a<-table.element(a,formatC(signif(mysum$sigma,6),format='g',flag=' '))
a<-table.row.end(a)
a<-table.row.start(a)
a<-table.element(a, 'Sum Squared Residuals',1,TRUE)
a<-table.element(a,formatC(signif(sum(myerror*myerror),6),format='g',flag=' '))
a<-table.row.end(a)
a<-table.end(a)
table.save(a,file='mytable3.tab')
if(n < 200) {
a<-table.start()
a<-table.row.start(a)
a<-table.element(a, 'Multiple Linear Regression - Actuals, Interpolation, and Residuals', 4, TRUE)
a<-table.row.end(a)
a<-table.row.start(a)
a<-table.element(a, 'Time or Index', 1, TRUE)
a<-table.element(a, 'Actuals', 1, TRUE)
a<-table.element(a, 'Interpolation
Forecast', 1, TRUE)
a<-table.element(a, 'Residuals
Prediction Error', 1, TRUE)
a<-table.row.end(a)
for (i in 1:n) {
a<-table.row.start(a)
a<-table.element(a,i, 1, TRUE)
a<-table.element(a,formatC(signif(x[i],6),format='g',flag=' '))
a<-table.element(a,formatC(signif(x[i]-mysum$resid[i],6),format='g',flag=' '))
a<-table.element(a,formatC(signif(mysum$resid[i],6),format='g',flag=' '))
a<-table.row.end(a)
}
a<-table.end(a)
table.save(a,file='mytable4.tab')
if (n > n25) {
a<-table.start()
a<-table.row.start(a)
a<-table.element(a,'Goldfeld-Quandt test for Heteroskedasticity',4,TRUE)
a<-table.row.end(a)
a<-table.row.start(a)
a<-table.element(a,'p-values',header=TRUE)
a<-table.element(a,'Alternative Hypothesis',3,header=TRUE)
a<-table.row.end(a)
a<-table.row.start(a)
a<-table.element(a,'breakpoint index',header=TRUE)
a<-table.element(a,'greater',header=TRUE)
a<-table.element(a,'2-sided',header=TRUE)
a<-table.element(a,'less',header=TRUE)
a<-table.row.end(a)
for (mypoint in kp3:nmkm3) {
a<-table.row.start(a)
a<-table.element(a,mypoint,header=TRUE)
a<-table.element(a,formatC(signif(gqarr[mypoint-kp3+1,1],6),format='g',flag=' '))
a<-table.element(a,formatC(signif(gqarr[mypoint-kp3+1,2],6),format='g',flag=' '))
a<-table.element(a,formatC(signif(gqarr[mypoint-kp3+1,3],6),format='g',flag=' '))
a<-table.row.end(a)
}
a<-table.end(a)
table.save(a,file='mytable5.tab')
a<-table.start()
a<-table.row.start(a)
a<-table.element(a,'Meta Analysis of Goldfeld-Quandt test for Heteroskedasticity',4,TRUE)
a<-table.row.end(a)
a<-table.row.start(a)
a<-table.element(a,'Description',header=TRUE)
a<-table.element(a,'# significant tests',header=TRUE)
a<-table.element(a,'% significant tests',header=TRUE)
a<-table.element(a,'OK/NOK',header=TRUE)
a<-table.row.end(a)
a<-table.row.start(a)
a<-table.element(a,'1% type I error level',header=TRUE)
a<-table.element(a,signif(numsignificant1,6))
a<-table.element(a,formatC(signif(numsignificant1/numgqtests,6),format='g',flag=' '))
if (numsignificant1/numgqtests < 0.01) dum <- 'OK' else dum <- 'NOK'
a<-table.element(a,dum)
a<-table.row.end(a)
a<-table.row.start(a)
a<-table.element(a,'5% type I error level',header=TRUE)
a<-table.element(a,signif(numsignificant5,6))
a<-table.element(a,signif(numsignificant5/numgqtests,6))
if (numsignificant5/numgqtests < 0.05) dum <- 'OK' else dum <- 'NOK'
a<-table.element(a,dum)
a<-table.row.end(a)
a<-table.row.start(a)
a<-table.element(a,'10% type I error level',header=TRUE)
a<-table.element(a,signif(numsignificant10,6))
a<-table.element(a,signif(numsignificant10/numgqtests,6))
if (numsignificant10/numgqtests < 0.1) dum <- 'OK' else dum <- 'NOK'
a<-table.element(a,dum)
a<-table.row.end(a)
a<-table.end(a)
table.save(a,file='mytable6.tab')
}
}