Free Statistics

of Irreproducible Research!

Author's title

Author*The author of this computation has been verified*
R Software Modulerwasp_autocorrelation.wasp
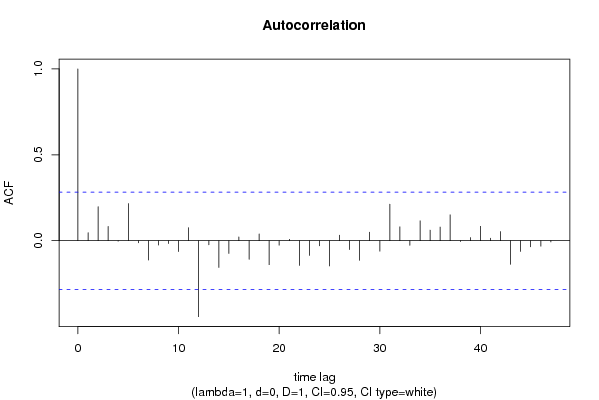
Title produced by software(Partial) Autocorrelation Function
Date of computationWed, 09 Dec 2009 01:53:49 -0700
Cite this page as followsStatistical Computations at FreeStatistics.org, Office for Research Development and Education, URL https://freestatistics.org/blog/index.php?v=date/2009/Dec/09/t1260351157s41hetkl5q6m4ok.htm/, Retrieved Thu, 31 Oct 2024 23:27:24 +0000
Statistical Computations at FreeStatistics.org, Office for Research Development and Education, URL https://freestatistics.org/blog/index.php?pk=64896, Retrieved Thu, 31 Oct 2024 23:27:24 +0000
QR Codes:

Original text written by user:
IsPrivate?No (this computation is public)
User-defined keywords
Estimated Impact212
Family? (F = Feedback message, R = changed R code, M = changed R Module, P = changed Parameters, D = changed Data)
-       [(Partial) Autocorrelation Function] [acf met d=0 en D=1] [2009-12-09 08:53:49] [b42c0aeada8a5fa89825c81e73c10645] [Current]
Feedback Forum

Post a new message
Dataseries X:
104.1
90.2
99.2
116.5
98.4
90.6
130.5
107.4
106
196.5
107.8
90.5
123.8
114.7
115.3
197
88.4
93.8
111.3
105.9
123.6
171
97
99.2
126.6
103.4
121.3
129.6
110.8
98.9
122.8
120.9
133.1
203.1
110.2
119.5
135.1
113.9
137.4
157.1
126.4
112.2
128.8
136.8
156.5
215.2
146.7
130.8
133.1
153.4
159.9
174.6
145
112.9
137.8
150.6
162.1
226.4
112.3
126.3


Summary of computational transaction
Raw Inputview raw input (R code)
Raw Outputview raw output of R engine
Computing time1 seconds
R Server'Gwilym Jenkins' @ 72.249.127.135

\begin{tabular}{lllllllll}
\hline
Summary of computational transaction \tabularnewline
Raw Input & view raw input (R code)  \tabularnewline
Raw Output & view raw output of R engine  \tabularnewline
Computing time & 1 seconds \tabularnewline
R Server & 'Gwilym Jenkins' @ 72.249.127.135 \tabularnewline
\hline
\end{tabular}
%Source: https://freestatistics.org/blog/index.php?pk=64896&T=0

[TABLE]
[ROW][C]Summary of computational transaction[/C][/ROW]
[ROW][C]Raw Input[/C][C]view raw input (R code) [/C][/ROW]
[ROW][C]Raw Output[/C][C]view raw output of R engine [/C][/ROW]
[ROW][C]Computing time[/C][C]1 seconds[/C][/ROW]
[ROW][C]R Server[/C][C]'Gwilym Jenkins' @ 72.249.127.135[/C][/ROW]
[/TABLE]
Source: https://freestatistics.org/blog/index.php?pk=64896&T=0

Globally Unique Identifier (entire table): ba.freestatistics.org/blog/index.php?pk=64896&T=0

As an alternative you can also use a QR Code:  

The GUIDs for individual cells are displayed in the table below:

Summary of computational transaction
Raw Inputview raw input (R code)
Raw Outputview raw output of R engine
Computing time1 seconds
R Server'Gwilym Jenkins' @ 72.249.127.135


Autocorrelation Function
Time lag kACF(k)T-STATP-value
10.0466690.32330.373924
20.1983761.37440.087852
30.0833760.57760.283103
4-0.003059-0.02120.49159
50.2164191.49940.07016
6-0.012001-0.08310.467041
7-0.112423-0.77890.219935
8-0.025492-0.17660.430277
9-0.016847-0.11670.453784
10-0.063473-0.43980.331045
110.0754340.52260.301822
12-0.442227-3.06380.001789
13-0.024137-0.16720.433948
14-0.155318-1.07610.143636
15-0.074216-0.51420.304742
160.0220110.15250.439716
17-0.108203-0.74970.228561
180.0391870.27150.393588
19-0.139728-0.96810.168933
20-0.026206-0.18160.428345
210.0083170.05760.477143
22-0.143861-0.99670.161954
23-0.085617-0.59320.277926
24-0.029826-0.20660.418583
25-0.146877-1.01760.156986
260.0320320.22190.412657
27-0.051743-0.35850.360777
28-0.114456-0.7930.215848
290.0496730.34410.36612
30-0.06077-0.4210.337806
310.2126181.47310.073631
320.0806090.55850.289559
33-0.026836-0.18590.426644
340.1155930.80090.213581
350.0616160.42690.335686
360.0792360.5490.292787
370.1508721.04530.150566
38-0.004893-0.03390.486548
390.0186120.1290.448968
400.0840170.58210.281616
410.0144510.10010.460333
420.0529610.36690.357645
43-0.137317-0.95140.173093
44-0.062621-0.43380.333171
45-0.035355-0.24490.403771
46-0.031695-0.21960.413561
47-0.006883-0.04770.481081
48NANANA
49NANANA
50NANANA
51NANANA
52NANANA
53NANANA
54NANANA
55NANANA
56NANANA
57NANANA
58NANANA
59NANANA
60NANANA

\begin{tabular}{lllllllll}
\hline
Autocorrelation Function \tabularnewline
Time lag k & ACF(k) & T-STAT & P-value \tabularnewline
1 & 0.046669 & 0.3233 & 0.373924 \tabularnewline
2 & 0.198376 & 1.3744 & 0.087852 \tabularnewline
3 & 0.083376 & 0.5776 & 0.283103 \tabularnewline
4 & -0.003059 & -0.0212 & 0.49159 \tabularnewline
5 & 0.216419 & 1.4994 & 0.07016 \tabularnewline
6 & -0.012001 & -0.0831 & 0.467041 \tabularnewline
7 & -0.112423 & -0.7789 & 0.219935 \tabularnewline
8 & -0.025492 & -0.1766 & 0.430277 \tabularnewline
9 & -0.016847 & -0.1167 & 0.453784 \tabularnewline
10 & -0.063473 & -0.4398 & 0.331045 \tabularnewline
11 & 0.075434 & 0.5226 & 0.301822 \tabularnewline
12 & -0.442227 & -3.0638 & 0.001789 \tabularnewline
13 & -0.024137 & -0.1672 & 0.433948 \tabularnewline
14 & -0.155318 & -1.0761 & 0.143636 \tabularnewline
15 & -0.074216 & -0.5142 & 0.304742 \tabularnewline
16 & 0.022011 & 0.1525 & 0.439716 \tabularnewline
17 & -0.108203 & -0.7497 & 0.228561 \tabularnewline
18 & 0.039187 & 0.2715 & 0.393588 \tabularnewline
19 & -0.139728 & -0.9681 & 0.168933 \tabularnewline
20 & -0.026206 & -0.1816 & 0.428345 \tabularnewline
21 & 0.008317 & 0.0576 & 0.477143 \tabularnewline
22 & -0.143861 & -0.9967 & 0.161954 \tabularnewline
23 & -0.085617 & -0.5932 & 0.277926 \tabularnewline
24 & -0.029826 & -0.2066 & 0.418583 \tabularnewline
25 & -0.146877 & -1.0176 & 0.156986 \tabularnewline
26 & 0.032032 & 0.2219 & 0.412657 \tabularnewline
27 & -0.051743 & -0.3585 & 0.360777 \tabularnewline
28 & -0.114456 & -0.793 & 0.215848 \tabularnewline
29 & 0.049673 & 0.3441 & 0.36612 \tabularnewline
30 & -0.06077 & -0.421 & 0.337806 \tabularnewline
31 & 0.212618 & 1.4731 & 0.073631 \tabularnewline
32 & 0.080609 & 0.5585 & 0.289559 \tabularnewline
33 & -0.026836 & -0.1859 & 0.426644 \tabularnewline
34 & 0.115593 & 0.8009 & 0.213581 \tabularnewline
35 & 0.061616 & 0.4269 & 0.335686 \tabularnewline
36 & 0.079236 & 0.549 & 0.292787 \tabularnewline
37 & 0.150872 & 1.0453 & 0.150566 \tabularnewline
38 & -0.004893 & -0.0339 & 0.486548 \tabularnewline
39 & 0.018612 & 0.129 & 0.448968 \tabularnewline
40 & 0.084017 & 0.5821 & 0.281616 \tabularnewline
41 & 0.014451 & 0.1001 & 0.460333 \tabularnewline
42 & 0.052961 & 0.3669 & 0.357645 \tabularnewline
43 & -0.137317 & -0.9514 & 0.173093 \tabularnewline
44 & -0.062621 & -0.4338 & 0.333171 \tabularnewline
45 & -0.035355 & -0.2449 & 0.403771 \tabularnewline
46 & -0.031695 & -0.2196 & 0.413561 \tabularnewline
47 & -0.006883 & -0.0477 & 0.481081 \tabularnewline
48 & NA & NA & NA \tabularnewline
49 & NA & NA & NA \tabularnewline
50 & NA & NA & NA \tabularnewline
51 & NA & NA & NA \tabularnewline
52 & NA & NA & NA \tabularnewline
53 & NA & NA & NA \tabularnewline
54 & NA & NA & NA \tabularnewline
55 & NA & NA & NA \tabularnewline
56 & NA & NA & NA \tabularnewline
57 & NA & NA & NA \tabularnewline
58 & NA & NA & NA \tabularnewline
59 & NA & NA & NA \tabularnewline
60 & NA & NA & NA \tabularnewline
\hline
\end{tabular}
%Source: https://freestatistics.org/blog/index.php?pk=64896&T=1

[TABLE]
[ROW][C]Autocorrelation Function[/C][/ROW]
[ROW][C]Time lag k[/C][C]ACF(k)[/C][C]T-STAT[/C][C]P-value[/C][/ROW]
[ROW][C]1[/C][C]0.046669[/C][C]0.3233[/C][C]0.373924[/C][/ROW]
[ROW][C]2[/C][C]0.198376[/C][C]1.3744[/C][C]0.087852[/C][/ROW]
[ROW][C]3[/C][C]0.083376[/C][C]0.5776[/C][C]0.283103[/C][/ROW]
[ROW][C]4[/C][C]-0.003059[/C][C]-0.0212[/C][C]0.49159[/C][/ROW]
[ROW][C]5[/C][C]0.216419[/C][C]1.4994[/C][C]0.07016[/C][/ROW]
[ROW][C]6[/C][C]-0.012001[/C][C]-0.0831[/C][C]0.467041[/C][/ROW]
[ROW][C]7[/C][C]-0.112423[/C][C]-0.7789[/C][C]0.219935[/C][/ROW]
[ROW][C]8[/C][C]-0.025492[/C][C]-0.1766[/C][C]0.430277[/C][/ROW]
[ROW][C]9[/C][C]-0.016847[/C][C]-0.1167[/C][C]0.453784[/C][/ROW]
[ROW][C]10[/C][C]-0.063473[/C][C]-0.4398[/C][C]0.331045[/C][/ROW]
[ROW][C]11[/C][C]0.075434[/C][C]0.5226[/C][C]0.301822[/C][/ROW]
[ROW][C]12[/C][C]-0.442227[/C][C]-3.0638[/C][C]0.001789[/C][/ROW]
[ROW][C]13[/C][C]-0.024137[/C][C]-0.1672[/C][C]0.433948[/C][/ROW]
[ROW][C]14[/C][C]-0.155318[/C][C]-1.0761[/C][C]0.143636[/C][/ROW]
[ROW][C]15[/C][C]-0.074216[/C][C]-0.5142[/C][C]0.304742[/C][/ROW]
[ROW][C]16[/C][C]0.022011[/C][C]0.1525[/C][C]0.439716[/C][/ROW]
[ROW][C]17[/C][C]-0.108203[/C][C]-0.7497[/C][C]0.228561[/C][/ROW]
[ROW][C]18[/C][C]0.039187[/C][C]0.2715[/C][C]0.393588[/C][/ROW]
[ROW][C]19[/C][C]-0.139728[/C][C]-0.9681[/C][C]0.168933[/C][/ROW]
[ROW][C]20[/C][C]-0.026206[/C][C]-0.1816[/C][C]0.428345[/C][/ROW]
[ROW][C]21[/C][C]0.008317[/C][C]0.0576[/C][C]0.477143[/C][/ROW]
[ROW][C]22[/C][C]-0.143861[/C][C]-0.9967[/C][C]0.161954[/C][/ROW]
[ROW][C]23[/C][C]-0.085617[/C][C]-0.5932[/C][C]0.277926[/C][/ROW]
[ROW][C]24[/C][C]-0.029826[/C][C]-0.2066[/C][C]0.418583[/C][/ROW]
[ROW][C]25[/C][C]-0.146877[/C][C]-1.0176[/C][C]0.156986[/C][/ROW]
[ROW][C]26[/C][C]0.032032[/C][C]0.2219[/C][C]0.412657[/C][/ROW]
[ROW][C]27[/C][C]-0.051743[/C][C]-0.3585[/C][C]0.360777[/C][/ROW]
[ROW][C]28[/C][C]-0.114456[/C][C]-0.793[/C][C]0.215848[/C][/ROW]
[ROW][C]29[/C][C]0.049673[/C][C]0.3441[/C][C]0.36612[/C][/ROW]
[ROW][C]30[/C][C]-0.06077[/C][C]-0.421[/C][C]0.337806[/C][/ROW]
[ROW][C]31[/C][C]0.212618[/C][C]1.4731[/C][C]0.073631[/C][/ROW]
[ROW][C]32[/C][C]0.080609[/C][C]0.5585[/C][C]0.289559[/C][/ROW]
[ROW][C]33[/C][C]-0.026836[/C][C]-0.1859[/C][C]0.426644[/C][/ROW]
[ROW][C]34[/C][C]0.115593[/C][C]0.8009[/C][C]0.213581[/C][/ROW]
[ROW][C]35[/C][C]0.061616[/C][C]0.4269[/C][C]0.335686[/C][/ROW]
[ROW][C]36[/C][C]0.079236[/C][C]0.549[/C][C]0.292787[/C][/ROW]
[ROW][C]37[/C][C]0.150872[/C][C]1.0453[/C][C]0.150566[/C][/ROW]
[ROW][C]38[/C][C]-0.004893[/C][C]-0.0339[/C][C]0.486548[/C][/ROW]
[ROW][C]39[/C][C]0.018612[/C][C]0.129[/C][C]0.448968[/C][/ROW]
[ROW][C]40[/C][C]0.084017[/C][C]0.5821[/C][C]0.281616[/C][/ROW]
[ROW][C]41[/C][C]0.014451[/C][C]0.1001[/C][C]0.460333[/C][/ROW]
[ROW][C]42[/C][C]0.052961[/C][C]0.3669[/C][C]0.357645[/C][/ROW]
[ROW][C]43[/C][C]-0.137317[/C][C]-0.9514[/C][C]0.173093[/C][/ROW]
[ROW][C]44[/C][C]-0.062621[/C][C]-0.4338[/C][C]0.333171[/C][/ROW]
[ROW][C]45[/C][C]-0.035355[/C][C]-0.2449[/C][C]0.403771[/C][/ROW]
[ROW][C]46[/C][C]-0.031695[/C][C]-0.2196[/C][C]0.413561[/C][/ROW]
[ROW][C]47[/C][C]-0.006883[/C][C]-0.0477[/C][C]0.481081[/C][/ROW]
[ROW][C]48[/C][C]NA[/C][C]NA[/C][C]NA[/C][/ROW]
[ROW][C]49[/C][C]NA[/C][C]NA[/C][C]NA[/C][/ROW]
[ROW][C]50[/C][C]NA[/C][C]NA[/C][C]NA[/C][/ROW]
[ROW][C]51[/C][C]NA[/C][C]NA[/C][C]NA[/C][/ROW]
[ROW][C]52[/C][C]NA[/C][C]NA[/C][C]NA[/C][/ROW]
[ROW][C]53[/C][C]NA[/C][C]NA[/C][C]NA[/C][/ROW]
[ROW][C]54[/C][C]NA[/C][C]NA[/C][C]NA[/C][/ROW]
[ROW][C]55[/C][C]NA[/C][C]NA[/C][C]NA[/C][/ROW]
[ROW][C]56[/C][C]NA[/C][C]NA[/C][C]NA[/C][/ROW]
[ROW][C]57[/C][C]NA[/C][C]NA[/C][C]NA[/C][/ROW]
[ROW][C]58[/C][C]NA[/C][C]NA[/C][C]NA[/C][/ROW]
[ROW][C]59[/C][C]NA[/C][C]NA[/C][C]NA[/C][/ROW]
[ROW][C]60[/C][C]NA[/C][C]NA[/C][C]NA[/C][/ROW]
[/TABLE]
Source: https://freestatistics.org/blog/index.php?pk=64896&T=1

Globally Unique Identifier (entire table): ba.freestatistics.org/blog/index.php?pk=64896&T=1

As an alternative you can also use a QR Code:  

The GUIDs for individual cells are displayed in the table below:

Autocorrelation Function
Time lag kACF(k)T-STATP-value
10.0466690.32330.373924
20.1983761.37440.087852
30.0833760.57760.283103
4-0.003059-0.02120.49159
50.2164191.49940.07016
6-0.012001-0.08310.467041
7-0.112423-0.77890.219935
8-0.025492-0.17660.430277
9-0.016847-0.11670.453784
10-0.063473-0.43980.331045
110.0754340.52260.301822
12-0.442227-3.06380.001789
13-0.024137-0.16720.433948
14-0.155318-1.07610.143636
15-0.074216-0.51420.304742
160.0220110.15250.439716
17-0.108203-0.74970.228561
180.0391870.27150.393588
19-0.139728-0.96810.168933
20-0.026206-0.18160.428345
210.0083170.05760.477143
22-0.143861-0.99670.161954
23-0.085617-0.59320.277926
24-0.029826-0.20660.418583
25-0.146877-1.01760.156986
260.0320320.22190.412657
27-0.051743-0.35850.360777
28-0.114456-0.7930.215848
290.0496730.34410.36612
30-0.06077-0.4210.337806
310.2126181.47310.073631
320.0806090.55850.289559
33-0.026836-0.18590.426644
340.1155930.80090.213581
350.0616160.42690.335686
360.0792360.5490.292787
370.1508721.04530.150566
38-0.004893-0.03390.486548
390.0186120.1290.448968
400.0840170.58210.281616
410.0144510.10010.460333
420.0529610.36690.357645
43-0.137317-0.95140.173093
44-0.062621-0.43380.333171
45-0.035355-0.24490.403771
46-0.031695-0.21960.413561
47-0.006883-0.04770.481081
48NANANA
49NANANA
50NANANA
51NANANA
52NANANA
53NANANA
54NANANA
55NANANA
56NANANA
57NANANA
58NANANA
59NANANA
60NANANA


Partial Autocorrelation Function
Time lag kPACF(k)T-STATP-value
10.0466690.32330.373924
20.1966261.36230.089736
30.0695980.48220.315931
4-0.049005-0.33950.36785
50.1971871.36620.089129
6-0.022259-0.15420.439043
7-0.204035-1.41360.081967
8-0.035084-0.24310.404493
90.071710.49680.310791
10-0.096303-0.66720.253917
110.0827180.57310.28463
12-0.403311-2.79420.003727
130.0029040.02010.492015
14-0.035547-0.24630.403258
150.0037420.02590.489711
160.0062760.04350.48275
170.1037580.71890.237858
180.0362760.25130.401318
19-0.271789-1.8830.032883
20-0.057237-0.39650.346729
210.1070660.74180.230918
22-0.245387-1.70010.047793
23-0.021764-0.15080.44039
24-0.092867-0.64340.261512
25-0.14788-1.02450.155358
26-0.091473-0.63370.264628
270.0053860.03730.485195
28-0.119749-0.82960.205423
290.033730.23370.408111
300.1006890.69760.244397
310.0690050.47810.317383
32-0.038076-0.26380.396533
33-0.000471-0.00330.498704
34-0.14511-1.00540.159884
35-0.002305-0.0160.493661
36-0.039797-0.27570.391973
370.013050.09040.464168
38-0.076692-0.53130.298817
39-0.031254-0.21650.414745
40-0.061352-0.42510.336345
41-0.021402-0.14830.441374
42-0.032214-0.22320.412169
43-0.014833-0.10280.459289
44-0.072605-0.5030.308624
45-0.031245-0.21650.41477
46-0.046335-0.3210.374794
47-0.069617-0.48230.315885
48NANANA
49NANANA
50NANANA
51NANANA
52NANANA
53NANANA
54NANANA
55NANANA
56NANANA
57NANANA
58NANANA
59NANANA
60NANANA

\begin{tabular}{lllllllll}
\hline
Partial Autocorrelation Function \tabularnewline
Time lag k & PACF(k) & T-STAT & P-value \tabularnewline
1 & 0.046669 & 0.3233 & 0.373924 \tabularnewline
2 & 0.196626 & 1.3623 & 0.089736 \tabularnewline
3 & 0.069598 & 0.4822 & 0.315931 \tabularnewline
4 & -0.049005 & -0.3395 & 0.36785 \tabularnewline
5 & 0.197187 & 1.3662 & 0.089129 \tabularnewline
6 & -0.022259 & -0.1542 & 0.439043 \tabularnewline
7 & -0.204035 & -1.4136 & 0.081967 \tabularnewline
8 & -0.035084 & -0.2431 & 0.404493 \tabularnewline
9 & 0.07171 & 0.4968 & 0.310791 \tabularnewline
10 & -0.096303 & -0.6672 & 0.253917 \tabularnewline
11 & 0.082718 & 0.5731 & 0.28463 \tabularnewline
12 & -0.403311 & -2.7942 & 0.003727 \tabularnewline
13 & 0.002904 & 0.0201 & 0.492015 \tabularnewline
14 & -0.035547 & -0.2463 & 0.403258 \tabularnewline
15 & 0.003742 & 0.0259 & 0.489711 \tabularnewline
16 & 0.006276 & 0.0435 & 0.48275 \tabularnewline
17 & 0.103758 & 0.7189 & 0.237858 \tabularnewline
18 & 0.036276 & 0.2513 & 0.401318 \tabularnewline
19 & -0.271789 & -1.883 & 0.032883 \tabularnewline
20 & -0.057237 & -0.3965 & 0.346729 \tabularnewline
21 & 0.107066 & 0.7418 & 0.230918 \tabularnewline
22 & -0.245387 & -1.7001 & 0.047793 \tabularnewline
23 & -0.021764 & -0.1508 & 0.44039 \tabularnewline
24 & -0.092867 & -0.6434 & 0.261512 \tabularnewline
25 & -0.14788 & -1.0245 & 0.155358 \tabularnewline
26 & -0.091473 & -0.6337 & 0.264628 \tabularnewline
27 & 0.005386 & 0.0373 & 0.485195 \tabularnewline
28 & -0.119749 & -0.8296 & 0.205423 \tabularnewline
29 & 0.03373 & 0.2337 & 0.408111 \tabularnewline
30 & 0.100689 & 0.6976 & 0.244397 \tabularnewline
31 & 0.069005 & 0.4781 & 0.317383 \tabularnewline
32 & -0.038076 & -0.2638 & 0.396533 \tabularnewline
33 & -0.000471 & -0.0033 & 0.498704 \tabularnewline
34 & -0.14511 & -1.0054 & 0.159884 \tabularnewline
35 & -0.002305 & -0.016 & 0.493661 \tabularnewline
36 & -0.039797 & -0.2757 & 0.391973 \tabularnewline
37 & 0.01305 & 0.0904 & 0.464168 \tabularnewline
38 & -0.076692 & -0.5313 & 0.298817 \tabularnewline
39 & -0.031254 & -0.2165 & 0.414745 \tabularnewline
40 & -0.061352 & -0.4251 & 0.336345 \tabularnewline
41 & -0.021402 & -0.1483 & 0.441374 \tabularnewline
42 & -0.032214 & -0.2232 & 0.412169 \tabularnewline
43 & -0.014833 & -0.1028 & 0.459289 \tabularnewline
44 & -0.072605 & -0.503 & 0.308624 \tabularnewline
45 & -0.031245 & -0.2165 & 0.41477 \tabularnewline
46 & -0.046335 & -0.321 & 0.374794 \tabularnewline
47 & -0.069617 & -0.4823 & 0.315885 \tabularnewline
48 & NA & NA & NA \tabularnewline
49 & NA & NA & NA \tabularnewline
50 & NA & NA & NA \tabularnewline
51 & NA & NA & NA \tabularnewline
52 & NA & NA & NA \tabularnewline
53 & NA & NA & NA \tabularnewline
54 & NA & NA & NA \tabularnewline
55 & NA & NA & NA \tabularnewline
56 & NA & NA & NA \tabularnewline
57 & NA & NA & NA \tabularnewline
58 & NA & NA & NA \tabularnewline
59 & NA & NA & NA \tabularnewline
60 & NA & NA & NA \tabularnewline
\hline
\end{tabular}
%Source: https://freestatistics.org/blog/index.php?pk=64896&T=2

[TABLE]
[ROW][C]Partial Autocorrelation Function[/C][/ROW]
[ROW][C]Time lag k[/C][C]PACF(k)[/C][C]T-STAT[/C][C]P-value[/C][/ROW]
[ROW][C]1[/C][C]0.046669[/C][C]0.3233[/C][C]0.373924[/C][/ROW]
[ROW][C]2[/C][C]0.196626[/C][C]1.3623[/C][C]0.089736[/C][/ROW]
[ROW][C]3[/C][C]0.069598[/C][C]0.4822[/C][C]0.315931[/C][/ROW]
[ROW][C]4[/C][C]-0.049005[/C][C]-0.3395[/C][C]0.36785[/C][/ROW]
[ROW][C]5[/C][C]0.197187[/C][C]1.3662[/C][C]0.089129[/C][/ROW]
[ROW][C]6[/C][C]-0.022259[/C][C]-0.1542[/C][C]0.439043[/C][/ROW]
[ROW][C]7[/C][C]-0.204035[/C][C]-1.4136[/C][C]0.081967[/C][/ROW]
[ROW][C]8[/C][C]-0.035084[/C][C]-0.2431[/C][C]0.404493[/C][/ROW]
[ROW][C]9[/C][C]0.07171[/C][C]0.4968[/C][C]0.310791[/C][/ROW]
[ROW][C]10[/C][C]-0.096303[/C][C]-0.6672[/C][C]0.253917[/C][/ROW]
[ROW][C]11[/C][C]0.082718[/C][C]0.5731[/C][C]0.28463[/C][/ROW]
[ROW][C]12[/C][C]-0.403311[/C][C]-2.7942[/C][C]0.003727[/C][/ROW]
[ROW][C]13[/C][C]0.002904[/C][C]0.0201[/C][C]0.492015[/C][/ROW]
[ROW][C]14[/C][C]-0.035547[/C][C]-0.2463[/C][C]0.403258[/C][/ROW]
[ROW][C]15[/C][C]0.003742[/C][C]0.0259[/C][C]0.489711[/C][/ROW]
[ROW][C]16[/C][C]0.006276[/C][C]0.0435[/C][C]0.48275[/C][/ROW]
[ROW][C]17[/C][C]0.103758[/C][C]0.7189[/C][C]0.237858[/C][/ROW]
[ROW][C]18[/C][C]0.036276[/C][C]0.2513[/C][C]0.401318[/C][/ROW]
[ROW][C]19[/C][C]-0.271789[/C][C]-1.883[/C][C]0.032883[/C][/ROW]
[ROW][C]20[/C][C]-0.057237[/C][C]-0.3965[/C][C]0.346729[/C][/ROW]
[ROW][C]21[/C][C]0.107066[/C][C]0.7418[/C][C]0.230918[/C][/ROW]
[ROW][C]22[/C][C]-0.245387[/C][C]-1.7001[/C][C]0.047793[/C][/ROW]
[ROW][C]23[/C][C]-0.021764[/C][C]-0.1508[/C][C]0.44039[/C][/ROW]
[ROW][C]24[/C][C]-0.092867[/C][C]-0.6434[/C][C]0.261512[/C][/ROW]
[ROW][C]25[/C][C]-0.14788[/C][C]-1.0245[/C][C]0.155358[/C][/ROW]
[ROW][C]26[/C][C]-0.091473[/C][C]-0.6337[/C][C]0.264628[/C][/ROW]
[ROW][C]27[/C][C]0.005386[/C][C]0.0373[/C][C]0.485195[/C][/ROW]
[ROW][C]28[/C][C]-0.119749[/C][C]-0.8296[/C][C]0.205423[/C][/ROW]
[ROW][C]29[/C][C]0.03373[/C][C]0.2337[/C][C]0.408111[/C][/ROW]
[ROW][C]30[/C][C]0.100689[/C][C]0.6976[/C][C]0.244397[/C][/ROW]
[ROW][C]31[/C][C]0.069005[/C][C]0.4781[/C][C]0.317383[/C][/ROW]
[ROW][C]32[/C][C]-0.038076[/C][C]-0.2638[/C][C]0.396533[/C][/ROW]
[ROW][C]33[/C][C]-0.000471[/C][C]-0.0033[/C][C]0.498704[/C][/ROW]
[ROW][C]34[/C][C]-0.14511[/C][C]-1.0054[/C][C]0.159884[/C][/ROW]
[ROW][C]35[/C][C]-0.002305[/C][C]-0.016[/C][C]0.493661[/C][/ROW]
[ROW][C]36[/C][C]-0.039797[/C][C]-0.2757[/C][C]0.391973[/C][/ROW]
[ROW][C]37[/C][C]0.01305[/C][C]0.0904[/C][C]0.464168[/C][/ROW]
[ROW][C]38[/C][C]-0.076692[/C][C]-0.5313[/C][C]0.298817[/C][/ROW]
[ROW][C]39[/C][C]-0.031254[/C][C]-0.2165[/C][C]0.414745[/C][/ROW]
[ROW][C]40[/C][C]-0.061352[/C][C]-0.4251[/C][C]0.336345[/C][/ROW]
[ROW][C]41[/C][C]-0.021402[/C][C]-0.1483[/C][C]0.441374[/C][/ROW]
[ROW][C]42[/C][C]-0.032214[/C][C]-0.2232[/C][C]0.412169[/C][/ROW]
[ROW][C]43[/C][C]-0.014833[/C][C]-0.1028[/C][C]0.459289[/C][/ROW]
[ROW][C]44[/C][C]-0.072605[/C][C]-0.503[/C][C]0.308624[/C][/ROW]
[ROW][C]45[/C][C]-0.031245[/C][C]-0.2165[/C][C]0.41477[/C][/ROW]
[ROW][C]46[/C][C]-0.046335[/C][C]-0.321[/C][C]0.374794[/C][/ROW]
[ROW][C]47[/C][C]-0.069617[/C][C]-0.4823[/C][C]0.315885[/C][/ROW]
[ROW][C]48[/C][C]NA[/C][C]NA[/C][C]NA[/C][/ROW]
[ROW][C]49[/C][C]NA[/C][C]NA[/C][C]NA[/C][/ROW]
[ROW][C]50[/C][C]NA[/C][C]NA[/C][C]NA[/C][/ROW]
[ROW][C]51[/C][C]NA[/C][C]NA[/C][C]NA[/C][/ROW]
[ROW][C]52[/C][C]NA[/C][C]NA[/C][C]NA[/C][/ROW]
[ROW][C]53[/C][C]NA[/C][C]NA[/C][C]NA[/C][/ROW]
[ROW][C]54[/C][C]NA[/C][C]NA[/C][C]NA[/C][/ROW]
[ROW][C]55[/C][C]NA[/C][C]NA[/C][C]NA[/C][/ROW]
[ROW][C]56[/C][C]NA[/C][C]NA[/C][C]NA[/C][/ROW]
[ROW][C]57[/C][C]NA[/C][C]NA[/C][C]NA[/C][/ROW]
[ROW][C]58[/C][C]NA[/C][C]NA[/C][C]NA[/C][/ROW]
[ROW][C]59[/C][C]NA[/C][C]NA[/C][C]NA[/C][/ROW]
[ROW][C]60[/C][C]NA[/C][C]NA[/C][C]NA[/C][/ROW]
[/TABLE]
Source: https://freestatistics.org/blog/index.php?pk=64896&T=2

Globally Unique Identifier (entire table): ba.freestatistics.org/blog/index.php?pk=64896&T=2

As an alternative you can also use a QR Code:  

The GUIDs for individual cells are displayed in the table below:

Partial Autocorrelation Function
Time lag kPACF(k)T-STATP-value
10.0466690.32330.373924
20.1966261.36230.089736
30.0695980.48220.315931
4-0.049005-0.33950.36785
50.1971871.36620.089129
6-0.022259-0.15420.439043
7-0.204035-1.41360.081967
8-0.035084-0.24310.404493
90.071710.49680.310791
10-0.096303-0.66720.253917
110.0827180.57310.28463
12-0.403311-2.79420.003727
130.0029040.02010.492015
14-0.035547-0.24630.403258
150.0037420.02590.489711
160.0062760.04350.48275
170.1037580.71890.237858
180.0362760.25130.401318
19-0.271789-1.8830.032883
20-0.057237-0.39650.346729
210.1070660.74180.230918
22-0.245387-1.70010.047793
23-0.021764-0.15080.44039
24-0.092867-0.64340.261512
25-0.14788-1.02450.155358
26-0.091473-0.63370.264628
270.0053860.03730.485195
28-0.119749-0.82960.205423
290.033730.23370.408111
300.1006890.69760.244397
310.0690050.47810.317383
32-0.038076-0.26380.396533
33-0.000471-0.00330.498704
34-0.14511-1.00540.159884
35-0.002305-0.0160.493661
36-0.039797-0.27570.391973
370.013050.09040.464168
38-0.076692-0.53130.298817
39-0.031254-0.21650.414745
40-0.061352-0.42510.336345
41-0.021402-0.14830.441374
42-0.032214-0.22320.412169
43-0.014833-0.10280.459289
44-0.072605-0.5030.308624
45-0.031245-0.21650.41477
46-0.046335-0.3210.374794
47-0.069617-0.48230.315885
48NANANA
49NANANA
50NANANA
51NANANA
52NANANA
53NANANA
54NANANA
55NANANA
56NANANA
57NANANA
58NANANA
59NANANA
60NANANA


Parameters (Session):
par1 = 60 ; par2 = 1 ; par3 = 0 ; par4 = 1 ; par5 = 12 ; par6 = White Noise ; par7 = 0.95 ;
Parameters (R input):
par1 = 60 ; par2 = 1 ; par3 = 0 ; par4 = 1 ; par5 = 12 ; par6 = White Noise ; par7 = 0.95 ;
R code (references can be found in the software module):
if (par1 == 'Default') {
par1 = 10*log10(length(x))
} else {
par1 <- as.numeric(par1)
}
par2 <- as.numeric(par2)
par3 <- as.numeric(par3)
par4 <- as.numeric(par4)
par5 <- as.numeric(par5)
if (par6 == 'White Noise') par6 <- 'white' else par6 <- 'ma'
par7 <- as.numeric(par7)
if (par2 == 0) {
x <- log(x)
} else {
x <- (x ^ par2 - 1) / par2
}
if (par3 > 0) x <- diff(x,lag=1,difference=par3)
if (par4 > 0) x <- diff(x,lag=par5,difference=par4)
bitmap(file='pic1.png')
racf <- acf(x, par1, main='Autocorrelation', xlab='time lag', ylab='ACF', ci.type=par6, ci=par7, sub=paste('(lambda=',par2,', d=',par3,', D=',par4,', CI=', par7, ', CI type=',par6,')',sep=''))
dev.off()
bitmap(file='pic2.png')
rpacf <- pacf(x,par1,main='Partial Autocorrelation',xlab='lags',ylab='PACF')
dev.off()
(myacf <- c(racf$acf))
(mypacf <- c(rpacf$acf))
lengthx <- length(x)
sqrtn <- sqrt(lengthx)
load(file='createtable')
a<-table.start()
a<-table.row.start(a)
a<-table.element(a,'Autocorrelation Function',4,TRUE)
a<-table.row.end(a)
a<-table.row.start(a)
a<-table.element(a,'Time lag k',header=TRUE)
a<-table.element(a,hyperlink('basics.htm','ACF(k)','click here for more information about the Autocorrelation Function'),header=TRUE)
a<-table.element(a,'T-STAT',header=TRUE)
a<-table.element(a,'P-value',header=TRUE)
a<-table.row.end(a)
for (i in 2:(par1+1)) {
a<-table.row.start(a)
a<-table.element(a,i-1,header=TRUE)
a<-table.element(a,round(myacf[i],6))
mytstat <- myacf[i]*sqrtn
a<-table.element(a,round(mytstat,4))
a<-table.element(a,round(1-pt(abs(mytstat),lengthx),6))
a<-table.row.end(a)
}
a<-table.end(a)
table.save(a,file='mytable.tab')
a<-table.start()
a<-table.row.start(a)
a<-table.element(a,'Partial Autocorrelation Function',4,TRUE)
a<-table.row.end(a)
a<-table.row.start(a)
a<-table.element(a,'Time lag k',header=TRUE)
a<-table.element(a,hyperlink('basics.htm','PACF(k)','click here for more information about the Partial Autocorrelation Function'),header=TRUE)
a<-table.element(a,'T-STAT',header=TRUE)
a<-table.element(a,'P-value',header=TRUE)
a<-table.row.end(a)
for (i in 1:par1) {
a<-table.row.start(a)
a<-table.element(a,i,header=TRUE)
a<-table.element(a,round(mypacf[i],6))
mytstat <- mypacf[i]*sqrtn
a<-table.element(a,round(mytstat,4))
a<-table.element(a,round(1-pt(abs(mytstat),lengthx),6))
a<-table.row.end(a)
}
a<-table.end(a)
table.save(a,file='mytable1.tab')