Free Statistics

of Irreproducible Research!

Author's title

Author*The author of this computation has been verified*
R Software Modulerwasp_multipleregression.wasp
Title produced by softwareMultiple Regression
Date of computationTue, 15 Nov 2011 14:34:05 -0500
Cite this page as followsStatistical Computations at FreeStatistics.org, Office for Research Development and Education, URL https://freestatistics.org/blog/index.php?v=date/2011/Nov/15/t1321385679a7pcxmayvx1ee19.htm/, Retrieved Thu, 31 Oct 2024 23:48:24 +0000
Statistical Computations at FreeStatistics.org, Office for Research Development and Education, URL https://freestatistics.org/blog/index.php?pk=143428, Retrieved Thu, 31 Oct 2024 23:48:24 +0000
QR Codes:

Original text written by user:
IsPrivate?No (this computation is public)
User-defined keywords
Estimated Impact113
Family? (F = Feedback message, R = changed R code, M = changed R Module, P = changed Parameters, D = changed Data)
-     [Central Tendency] [Arabica Price in ...] [2008-01-06 21:28:17] [74be16979710d4c4e7c6647856088456]
- RMPD    [Multiple Regression] [] [2011-11-15 19:34:05] [2e63149daec6ba44c7d6fab36a0b0c34] [Current]
Feedback Forum

Post a new message
Dataseries X:
20	115
21	112
22	109
23	101
24	107
25	99
26	120
27	133
28	128
29	135
30	160
31	144
32	168
33	112
34	170
35	110
36	150
37	144
38	124
39	156
40	160
41	133
42	177
43	186
44	190
45	133
46	154
47	179
48	166
49	177
50	160
51	150
52	177
53	159
54	147
55	161
56	168
57	120
58	170
59	180
60	123
61	167
62	150
63	123
64	144
65	154
66	178
67	181
68	100
69	132
70	120
71	146
72	160
73	120
74	158
75	148
76	190
77	138
78	189
79	170
80	156
81	177
82	165
83	181
84	147
85	163
86	169
87	173
88	133
89	156
90	179
91	126
92	163
93	156
94	136
95	183
96	189
97	170
98	167
99	189
100	178


Summary of computational transaction
Raw Inputview raw input (R code)
Raw Outputview raw output of R engine
Computing time4 seconds
R Server'Herman Ole Andreas Wold' @ wold.wessa.net

\begin{tabular}{lllllllll}
\hline
Summary of computational transaction \tabularnewline
Raw Input & view raw input (R code)  \tabularnewline
Raw Output & view raw output of R engine  \tabularnewline
Computing time & 4 seconds \tabularnewline
R Server & 'Herman Ole Andreas Wold' @ wold.wessa.net \tabularnewline
\hline
\end{tabular}
%Source: https://freestatistics.org/blog/index.php?pk=143428&T=0

[TABLE]
[ROW][C]Summary of computational transaction[/C][/ROW]
[ROW][C]Raw Input[/C][C]view raw input (R code) [/C][/ROW]
[ROW][C]Raw Output[/C][C]view raw output of R engine [/C][/ROW]
[ROW][C]Computing time[/C][C]4 seconds[/C][/ROW]
[ROW][C]R Server[/C][C]'Herman Ole Andreas Wold' @ wold.wessa.net[/C][/ROW]
[/TABLE]
Source: https://freestatistics.org/blog/index.php?pk=143428&T=0

Globally Unique Identifier (entire table): ba.freestatistics.org/blog/index.php?pk=143428&T=0

As an alternative you can also use a QR Code:  

The GUIDs for individual cells are displayed in the table below:

Summary of computational transaction
Raw Inputview raw input (R code)
Raw Outputview raw output of R engine
Computing time4 seconds
R Server'Herman Ole Andreas Wold' @ wold.wessa.net


Multiple Linear Regression - Estimated Regression Equation
Leeftijd[t] = + 19 0Bloeddruk[t] + 1t + e[t]

\begin{tabular}{lllllllll}
\hline
Multiple Linear Regression - Estimated Regression Equation \tabularnewline
Leeftijd[t] =  +  19 0Bloeddruk[t] +  1t  + e[t] \tabularnewline
\hline
\end{tabular}
%Source: https://freestatistics.org/blog/index.php?pk=143428&T=1

[TABLE]
[ROW][C]Multiple Linear Regression - Estimated Regression Equation[/C][/ROW]
[ROW][C]Leeftijd[t] =  +  19 0Bloeddruk[t] +  1t  + e[t][/C][/ROW]
[/TABLE]
Source: https://freestatistics.org/blog/index.php?pk=143428&T=1

Globally Unique Identifier (entire table): ba.freestatistics.org/blog/index.php?pk=143428&T=1

As an alternative you can also use a QR Code:  

The GUIDs for individual cells are displayed in the table below:

Multiple Linear Regression - Estimated Regression Equation
Leeftijd[t] = + 19 0Bloeddruk[t] + 1t + e[t]


Multiple Linear Regression - Ordinary Least Squares
VariableParameterS.D.T-STATH0: parameter = 02-tail p-value1-tail p-value
(Intercept)1901141763461969858800
Bloeddruk00010.5
t107874779782296003200

\begin{tabular}{lllllllll}
\hline
Multiple Linear Regression - Ordinary Least Squares \tabularnewline
Variable & Parameter & S.D. & T-STATH0: parameter = 0 & 2-tail p-value & 1-tail p-value \tabularnewline
(Intercept) & 19 & 0 & 11417634619698588 & 0 & 0 \tabularnewline
Bloeddruk & 0 & 0 & 0 & 1 & 0.5 \tabularnewline
t & 1 & 0 & 78747797822960032 & 0 & 0 \tabularnewline
\hline
\end{tabular}
%Source: https://freestatistics.org/blog/index.php?pk=143428&T=2

[TABLE]
[ROW][C]Multiple Linear Regression - Ordinary Least Squares[/C][/ROW]
[ROW][C]Variable[/C][C]Parameter[/C][C]S.D.[/C][C]T-STATH0: parameter = 0[/C][C]2-tail p-value[/C][C]1-tail p-value[/C][/ROW]
[ROW][C](Intercept)[/C][C]19[/C][C]0[/C][C]11417634619698588[/C][C]0[/C][C]0[/C][/ROW]
[ROW][C]Bloeddruk[/C][C]0[/C][C]0[/C][C]0[/C][C]1[/C][C]0.5[/C][/ROW]
[ROW][C]t[/C][C]1[/C][C]0[/C][C]78747797822960032[/C][C]0[/C][C]0[/C][/ROW]
[/TABLE]
Source: https://freestatistics.org/blog/index.php?pk=143428&T=2

Globally Unique Identifier (entire table): ba.freestatistics.org/blog/index.php?pk=143428&T=2

As an alternative you can also use a QR Code:  

The GUIDs for individual cells are displayed in the table below:

Multiple Linear Regression - Ordinary Least Squares
VariableParameterS.D.T-STATH0: parameter = 02-tail p-value1-tail p-value
(Intercept)1901141763461969858800
Bloeddruk00010.5
t107874779782296003200


Multiple Linear Regression - Regression Statistics
Multiple R1
R-squared1
Adjusted R-squared1
F-TEST (value)3.91241871997838e+33
F-TEST (DF numerator)2
F-TEST (DF denominator)78
p-value0
Multiple Linear Regression - Residual Statistics
Residual Standard Deviation2.37884499349572e-15
Sum Squared Residuals4.41394473240211e-28

\begin{tabular}{lllllllll}
\hline
Multiple Linear Regression - Regression Statistics \tabularnewline
Multiple R & 1 \tabularnewline
R-squared & 1 \tabularnewline
Adjusted R-squared & 1 \tabularnewline
F-TEST (value) & 3.91241871997838e+33 \tabularnewline
F-TEST (DF numerator) & 2 \tabularnewline
F-TEST (DF denominator) & 78 \tabularnewline
p-value & 0 \tabularnewline
Multiple Linear Regression - Residual Statistics \tabularnewline
Residual Standard Deviation & 2.37884499349572e-15 \tabularnewline
Sum Squared Residuals & 4.41394473240211e-28 \tabularnewline
\hline
\end{tabular}
%Source: https://freestatistics.org/blog/index.php?pk=143428&T=3

[TABLE]
[ROW][C]Multiple Linear Regression - Regression Statistics[/C][/ROW]
[ROW][C]Multiple R[/C][C]1[/C][/ROW]
[ROW][C]R-squared[/C][C]1[/C][/ROW]
[ROW][C]Adjusted R-squared[/C][C]1[/C][/ROW]
[ROW][C]F-TEST (value)[/C][C]3.91241871997838e+33[/C][/ROW]
[ROW][C]F-TEST (DF numerator)[/C][C]2[/C][/ROW]
[ROW][C]F-TEST (DF denominator)[/C][C]78[/C][/ROW]
[ROW][C]p-value[/C][C]0[/C][/ROW]
[ROW][C]Multiple Linear Regression - Residual Statistics[/C][/ROW]
[ROW][C]Residual Standard Deviation[/C][C]2.37884499349572e-15[/C][/ROW]
[ROW][C]Sum Squared Residuals[/C][C]4.41394473240211e-28[/C][/ROW]
[/TABLE]
Source: https://freestatistics.org/blog/index.php?pk=143428&T=3

Globally Unique Identifier (entire table): ba.freestatistics.org/blog/index.php?pk=143428&T=3

As an alternative you can also use a QR Code:  

The GUIDs for individual cells are displayed in the table below:

Multiple Linear Regression - Regression Statistics
Multiple R1
R-squared1
Adjusted R-squared1
F-TEST (value)3.91241871997838e+33
F-TEST (DF numerator)2
F-TEST (DF denominator)78
p-value0
Multiple Linear Regression - Residual Statistics
Residual Standard Deviation2.37884499349572e-15
Sum Squared Residuals4.41394473240211e-28


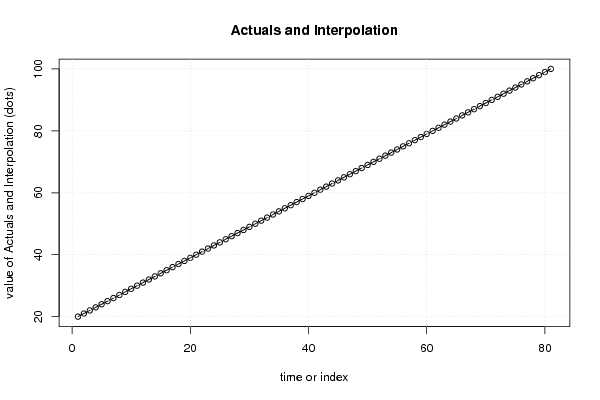
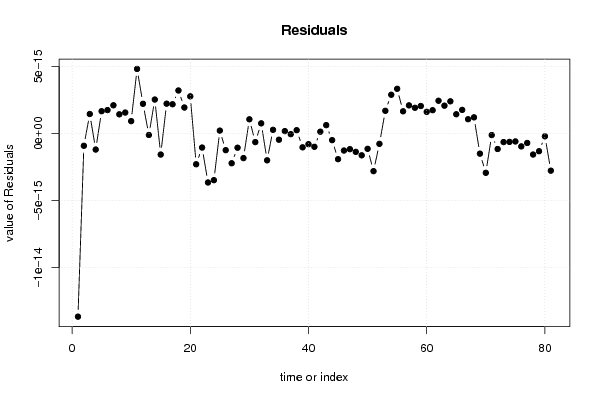
Multiple Linear Regression - Actuals, Interpolation, and Residuals
Time or IndexActualsInterpolationForecastResidualsPrediction Error
12020-1.36458209119004e-14
22121-9.11624882713986e-16
322221.45737940301266e-15
42323-1.19214784627053e-15
524241.66476391063576e-15
625251.7500840561023e-15
726262.10756370097566e-15
827271.43298073051107e-15
928281.56537276554652e-15
1029299.26750276642387e-16
1130304.81456010912892e-15
1231312.21896297534156e-15
133232-1.05205517927696e-16
1433332.53378102051722e-15
153434-1.56553388358363e-15
1635352.226659011951e-15
1736362.18323934342024e-15
1837373.2090804103009e-15
1938381.94037882163542e-15
2039392.77157447829972e-15
214040-2.28865882571782e-15
224141-1.04371468654181e-15
234242-3.64590040857248e-15
244343-3.47280519415377e-15
2544442.18641438131678e-16
264545-1.23907191065998e-15
274646-2.21320937403331e-15
284747-1.05672165447226e-15
294848-1.82932374015947e-15
3049491.06195027768058e-15
315050-6.37595739047603e-16
3251517.60175599429704e-16
335252-1.99570468364025e-15
3453532.75597777859632e-16
355454-4.5890683307324e-16
3655551.81364149535437e-16
375656-4.43941520862121e-17
3857572.49582074838803e-16
395858-1.02680620011053e-15
405959-7.93929467487783e-16
416060-9.85945200119861e-16
4261611.37621423378656e-16
4362626.25995390726218e-16
446363-4.90886482640193e-16
456464-1.90932999629809e-15
466565-1.26532379986883e-15
476666-1.16434887372251e-15
486767-1.36512159894287e-15
496868-1.62276326505731e-15
506969-1.13894598445736e-15
517070-2.8032623785138e-15
527171-7.66468936611677e-16
5372721.69439433403466e-15
5473732.89076259646836e-15
5574743.33688467203187e-15
5675751.65769024499532e-15
5776762.10051078760725e-15
5877771.92073959159022e-15
5978782.05233823633066e-15
6079791.61634589463414e-15
6180801.73979492600611e-15
6281812.44465294694383e-15
6382822.07790971291804e-15
6483832.40232813946462e-15
6584841.43769966226627e-15
6685851.76298545055085e-15
6786861.06718352865664e-15
6887871.20765120561757e-15
698888-1.49737362942058e-15
708989-2.92635836736864e-15
719090-1.1220948307744e-16
729191-1.15103603885482e-15
739292-6.34591220797092e-16
749393-6.21762222169739e-16
759494-5.88987522983616e-16
769595-9.57916094845614e-16
779696-7.01354828428555e-16
789797-1.56376388456362e-15
799898-1.31701298354802e-15
809999-2.06296110948886e-16
81100100-2.76579626032651e-15

\begin{tabular}{lllllllll}
\hline
Multiple Linear Regression - Actuals, Interpolation, and Residuals \tabularnewline
Time or Index & Actuals & InterpolationForecast & ResidualsPrediction Error \tabularnewline
1 & 20 & 20 & -1.36458209119004e-14 \tabularnewline
2 & 21 & 21 & -9.11624882713986e-16 \tabularnewline
3 & 22 & 22 & 1.45737940301266e-15 \tabularnewline
4 & 23 & 23 & -1.19214784627053e-15 \tabularnewline
5 & 24 & 24 & 1.66476391063576e-15 \tabularnewline
6 & 25 & 25 & 1.7500840561023e-15 \tabularnewline
7 & 26 & 26 & 2.10756370097566e-15 \tabularnewline
8 & 27 & 27 & 1.43298073051107e-15 \tabularnewline
9 & 28 & 28 & 1.56537276554652e-15 \tabularnewline
10 & 29 & 29 & 9.26750276642387e-16 \tabularnewline
11 & 30 & 30 & 4.81456010912892e-15 \tabularnewline
12 & 31 & 31 & 2.21896297534156e-15 \tabularnewline
13 & 32 & 32 & -1.05205517927696e-16 \tabularnewline
14 & 33 & 33 & 2.53378102051722e-15 \tabularnewline
15 & 34 & 34 & -1.56553388358363e-15 \tabularnewline
16 & 35 & 35 & 2.226659011951e-15 \tabularnewline
17 & 36 & 36 & 2.18323934342024e-15 \tabularnewline
18 & 37 & 37 & 3.2090804103009e-15 \tabularnewline
19 & 38 & 38 & 1.94037882163542e-15 \tabularnewline
20 & 39 & 39 & 2.77157447829972e-15 \tabularnewline
21 & 40 & 40 & -2.28865882571782e-15 \tabularnewline
22 & 41 & 41 & -1.04371468654181e-15 \tabularnewline
23 & 42 & 42 & -3.64590040857248e-15 \tabularnewline
24 & 43 & 43 & -3.47280519415377e-15 \tabularnewline
25 & 44 & 44 & 2.18641438131678e-16 \tabularnewline
26 & 45 & 45 & -1.23907191065998e-15 \tabularnewline
27 & 46 & 46 & -2.21320937403331e-15 \tabularnewline
28 & 47 & 47 & -1.05672165447226e-15 \tabularnewline
29 & 48 & 48 & -1.82932374015947e-15 \tabularnewline
30 & 49 & 49 & 1.06195027768058e-15 \tabularnewline
31 & 50 & 50 & -6.37595739047603e-16 \tabularnewline
32 & 51 & 51 & 7.60175599429704e-16 \tabularnewline
33 & 52 & 52 & -1.99570468364025e-15 \tabularnewline
34 & 53 & 53 & 2.75597777859632e-16 \tabularnewline
35 & 54 & 54 & -4.5890683307324e-16 \tabularnewline
36 & 55 & 55 & 1.81364149535437e-16 \tabularnewline
37 & 56 & 56 & -4.43941520862121e-17 \tabularnewline
38 & 57 & 57 & 2.49582074838803e-16 \tabularnewline
39 & 58 & 58 & -1.02680620011053e-15 \tabularnewline
40 & 59 & 59 & -7.93929467487783e-16 \tabularnewline
41 & 60 & 60 & -9.85945200119861e-16 \tabularnewline
42 & 61 & 61 & 1.37621423378656e-16 \tabularnewline
43 & 62 & 62 & 6.25995390726218e-16 \tabularnewline
44 & 63 & 63 & -4.90886482640193e-16 \tabularnewline
45 & 64 & 64 & -1.90932999629809e-15 \tabularnewline
46 & 65 & 65 & -1.26532379986883e-15 \tabularnewline
47 & 66 & 66 & -1.16434887372251e-15 \tabularnewline
48 & 67 & 67 & -1.36512159894287e-15 \tabularnewline
49 & 68 & 68 & -1.62276326505731e-15 \tabularnewline
50 & 69 & 69 & -1.13894598445736e-15 \tabularnewline
51 & 70 & 70 & -2.8032623785138e-15 \tabularnewline
52 & 71 & 71 & -7.66468936611677e-16 \tabularnewline
53 & 72 & 72 & 1.69439433403466e-15 \tabularnewline
54 & 73 & 73 & 2.89076259646836e-15 \tabularnewline
55 & 74 & 74 & 3.33688467203187e-15 \tabularnewline
56 & 75 & 75 & 1.65769024499532e-15 \tabularnewline
57 & 76 & 76 & 2.10051078760725e-15 \tabularnewline
58 & 77 & 77 & 1.92073959159022e-15 \tabularnewline
59 & 78 & 78 & 2.05233823633066e-15 \tabularnewline
60 & 79 & 79 & 1.61634589463414e-15 \tabularnewline
61 & 80 & 80 & 1.73979492600611e-15 \tabularnewline
62 & 81 & 81 & 2.44465294694383e-15 \tabularnewline
63 & 82 & 82 & 2.07790971291804e-15 \tabularnewline
64 & 83 & 83 & 2.40232813946462e-15 \tabularnewline
65 & 84 & 84 & 1.43769966226627e-15 \tabularnewline
66 & 85 & 85 & 1.76298545055085e-15 \tabularnewline
67 & 86 & 86 & 1.06718352865664e-15 \tabularnewline
68 & 87 & 87 & 1.20765120561757e-15 \tabularnewline
69 & 88 & 88 & -1.49737362942058e-15 \tabularnewline
70 & 89 & 89 & -2.92635836736864e-15 \tabularnewline
71 & 90 & 90 & -1.1220948307744e-16 \tabularnewline
72 & 91 & 91 & -1.15103603885482e-15 \tabularnewline
73 & 92 & 92 & -6.34591220797092e-16 \tabularnewline
74 & 93 & 93 & -6.21762222169739e-16 \tabularnewline
75 & 94 & 94 & -5.88987522983616e-16 \tabularnewline
76 & 95 & 95 & -9.57916094845614e-16 \tabularnewline
77 & 96 & 96 & -7.01354828428555e-16 \tabularnewline
78 & 97 & 97 & -1.56376388456362e-15 \tabularnewline
79 & 98 & 98 & -1.31701298354802e-15 \tabularnewline
80 & 99 & 99 & -2.06296110948886e-16 \tabularnewline
81 & 100 & 100 & -2.76579626032651e-15 \tabularnewline
\hline
\end{tabular}
%Source: https://freestatistics.org/blog/index.php?pk=143428&T=4

[TABLE]
[ROW][C]Multiple Linear Regression - Actuals, Interpolation, and Residuals[/C][/ROW]
[ROW][C]Time or Index[/C][C]Actuals[/C][C]InterpolationForecast[/C][C]ResidualsPrediction Error[/C][/ROW]
[ROW][C]1[/C][C]20[/C][C]20[/C][C]-1.36458209119004e-14[/C][/ROW]
[ROW][C]2[/C][C]21[/C][C]21[/C][C]-9.11624882713986e-16[/C][/ROW]
[ROW][C]3[/C][C]22[/C][C]22[/C][C]1.45737940301266e-15[/C][/ROW]
[ROW][C]4[/C][C]23[/C][C]23[/C][C]-1.19214784627053e-15[/C][/ROW]
[ROW][C]5[/C][C]24[/C][C]24[/C][C]1.66476391063576e-15[/C][/ROW]
[ROW][C]6[/C][C]25[/C][C]25[/C][C]1.7500840561023e-15[/C][/ROW]
[ROW][C]7[/C][C]26[/C][C]26[/C][C]2.10756370097566e-15[/C][/ROW]
[ROW][C]8[/C][C]27[/C][C]27[/C][C]1.43298073051107e-15[/C][/ROW]
[ROW][C]9[/C][C]28[/C][C]28[/C][C]1.56537276554652e-15[/C][/ROW]
[ROW][C]10[/C][C]29[/C][C]29[/C][C]9.26750276642387e-16[/C][/ROW]
[ROW][C]11[/C][C]30[/C][C]30[/C][C]4.81456010912892e-15[/C][/ROW]
[ROW][C]12[/C][C]31[/C][C]31[/C][C]2.21896297534156e-15[/C][/ROW]
[ROW][C]13[/C][C]32[/C][C]32[/C][C]-1.05205517927696e-16[/C][/ROW]
[ROW][C]14[/C][C]33[/C][C]33[/C][C]2.53378102051722e-15[/C][/ROW]
[ROW][C]15[/C][C]34[/C][C]34[/C][C]-1.56553388358363e-15[/C][/ROW]
[ROW][C]16[/C][C]35[/C][C]35[/C][C]2.226659011951e-15[/C][/ROW]
[ROW][C]17[/C][C]36[/C][C]36[/C][C]2.18323934342024e-15[/C][/ROW]
[ROW][C]18[/C][C]37[/C][C]37[/C][C]3.2090804103009e-15[/C][/ROW]
[ROW][C]19[/C][C]38[/C][C]38[/C][C]1.94037882163542e-15[/C][/ROW]
[ROW][C]20[/C][C]39[/C][C]39[/C][C]2.77157447829972e-15[/C][/ROW]
[ROW][C]21[/C][C]40[/C][C]40[/C][C]-2.28865882571782e-15[/C][/ROW]
[ROW][C]22[/C][C]41[/C][C]41[/C][C]-1.04371468654181e-15[/C][/ROW]
[ROW][C]23[/C][C]42[/C][C]42[/C][C]-3.64590040857248e-15[/C][/ROW]
[ROW][C]24[/C][C]43[/C][C]43[/C][C]-3.47280519415377e-15[/C][/ROW]
[ROW][C]25[/C][C]44[/C][C]44[/C][C]2.18641438131678e-16[/C][/ROW]
[ROW][C]26[/C][C]45[/C][C]45[/C][C]-1.23907191065998e-15[/C][/ROW]
[ROW][C]27[/C][C]46[/C][C]46[/C][C]-2.21320937403331e-15[/C][/ROW]
[ROW][C]28[/C][C]47[/C][C]47[/C][C]-1.05672165447226e-15[/C][/ROW]
[ROW][C]29[/C][C]48[/C][C]48[/C][C]-1.82932374015947e-15[/C][/ROW]
[ROW][C]30[/C][C]49[/C][C]49[/C][C]1.06195027768058e-15[/C][/ROW]
[ROW][C]31[/C][C]50[/C][C]50[/C][C]-6.37595739047603e-16[/C][/ROW]
[ROW][C]32[/C][C]51[/C][C]51[/C][C]7.60175599429704e-16[/C][/ROW]
[ROW][C]33[/C][C]52[/C][C]52[/C][C]-1.99570468364025e-15[/C][/ROW]
[ROW][C]34[/C][C]53[/C][C]53[/C][C]2.75597777859632e-16[/C][/ROW]
[ROW][C]35[/C][C]54[/C][C]54[/C][C]-4.5890683307324e-16[/C][/ROW]
[ROW][C]36[/C][C]55[/C][C]55[/C][C]1.81364149535437e-16[/C][/ROW]
[ROW][C]37[/C][C]56[/C][C]56[/C][C]-4.43941520862121e-17[/C][/ROW]
[ROW][C]38[/C][C]57[/C][C]57[/C][C]2.49582074838803e-16[/C][/ROW]
[ROW][C]39[/C][C]58[/C][C]58[/C][C]-1.02680620011053e-15[/C][/ROW]
[ROW][C]40[/C][C]59[/C][C]59[/C][C]-7.93929467487783e-16[/C][/ROW]
[ROW][C]41[/C][C]60[/C][C]60[/C][C]-9.85945200119861e-16[/C][/ROW]
[ROW][C]42[/C][C]61[/C][C]61[/C][C]1.37621423378656e-16[/C][/ROW]
[ROW][C]43[/C][C]62[/C][C]62[/C][C]6.25995390726218e-16[/C][/ROW]
[ROW][C]44[/C][C]63[/C][C]63[/C][C]-4.90886482640193e-16[/C][/ROW]
[ROW][C]45[/C][C]64[/C][C]64[/C][C]-1.90932999629809e-15[/C][/ROW]
[ROW][C]46[/C][C]65[/C][C]65[/C][C]-1.26532379986883e-15[/C][/ROW]
[ROW][C]47[/C][C]66[/C][C]66[/C][C]-1.16434887372251e-15[/C][/ROW]
[ROW][C]48[/C][C]67[/C][C]67[/C][C]-1.36512159894287e-15[/C][/ROW]
[ROW][C]49[/C][C]68[/C][C]68[/C][C]-1.62276326505731e-15[/C][/ROW]
[ROW][C]50[/C][C]69[/C][C]69[/C][C]-1.13894598445736e-15[/C][/ROW]
[ROW][C]51[/C][C]70[/C][C]70[/C][C]-2.8032623785138e-15[/C][/ROW]
[ROW][C]52[/C][C]71[/C][C]71[/C][C]-7.66468936611677e-16[/C][/ROW]
[ROW][C]53[/C][C]72[/C][C]72[/C][C]1.69439433403466e-15[/C][/ROW]
[ROW][C]54[/C][C]73[/C][C]73[/C][C]2.89076259646836e-15[/C][/ROW]
[ROW][C]55[/C][C]74[/C][C]74[/C][C]3.33688467203187e-15[/C][/ROW]
[ROW][C]56[/C][C]75[/C][C]75[/C][C]1.65769024499532e-15[/C][/ROW]
[ROW][C]57[/C][C]76[/C][C]76[/C][C]2.10051078760725e-15[/C][/ROW]
[ROW][C]58[/C][C]77[/C][C]77[/C][C]1.92073959159022e-15[/C][/ROW]
[ROW][C]59[/C][C]78[/C][C]78[/C][C]2.05233823633066e-15[/C][/ROW]
[ROW][C]60[/C][C]79[/C][C]79[/C][C]1.61634589463414e-15[/C][/ROW]
[ROW][C]61[/C][C]80[/C][C]80[/C][C]1.73979492600611e-15[/C][/ROW]
[ROW][C]62[/C][C]81[/C][C]81[/C][C]2.44465294694383e-15[/C][/ROW]
[ROW][C]63[/C][C]82[/C][C]82[/C][C]2.07790971291804e-15[/C][/ROW]
[ROW][C]64[/C][C]83[/C][C]83[/C][C]2.40232813946462e-15[/C][/ROW]
[ROW][C]65[/C][C]84[/C][C]84[/C][C]1.43769966226627e-15[/C][/ROW]
[ROW][C]66[/C][C]85[/C][C]85[/C][C]1.76298545055085e-15[/C][/ROW]
[ROW][C]67[/C][C]86[/C][C]86[/C][C]1.06718352865664e-15[/C][/ROW]
[ROW][C]68[/C][C]87[/C][C]87[/C][C]1.20765120561757e-15[/C][/ROW]
[ROW][C]69[/C][C]88[/C][C]88[/C][C]-1.49737362942058e-15[/C][/ROW]
[ROW][C]70[/C][C]89[/C][C]89[/C][C]-2.92635836736864e-15[/C][/ROW]
[ROW][C]71[/C][C]90[/C][C]90[/C][C]-1.1220948307744e-16[/C][/ROW]
[ROW][C]72[/C][C]91[/C][C]91[/C][C]-1.15103603885482e-15[/C][/ROW]
[ROW][C]73[/C][C]92[/C][C]92[/C][C]-6.34591220797092e-16[/C][/ROW]
[ROW][C]74[/C][C]93[/C][C]93[/C][C]-6.21762222169739e-16[/C][/ROW]
[ROW][C]75[/C][C]94[/C][C]94[/C][C]-5.88987522983616e-16[/C][/ROW]
[ROW][C]76[/C][C]95[/C][C]95[/C][C]-9.57916094845614e-16[/C][/ROW]
[ROW][C]77[/C][C]96[/C][C]96[/C][C]-7.01354828428555e-16[/C][/ROW]
[ROW][C]78[/C][C]97[/C][C]97[/C][C]-1.56376388456362e-15[/C][/ROW]
[ROW][C]79[/C][C]98[/C][C]98[/C][C]-1.31701298354802e-15[/C][/ROW]
[ROW][C]80[/C][C]99[/C][C]99[/C][C]-2.06296110948886e-16[/C][/ROW]
[ROW][C]81[/C][C]100[/C][C]100[/C][C]-2.76579626032651e-15[/C][/ROW]
[/TABLE]
Source: https://freestatistics.org/blog/index.php?pk=143428&T=4

Globally Unique Identifier (entire table): ba.freestatistics.org/blog/index.php?pk=143428&T=4

As an alternative you can also use a QR Code:  

The GUIDs for individual cells are displayed in the table below:

Multiple Linear Regression - Actuals, Interpolation, and Residuals
Time or IndexActualsInterpolationForecastResidualsPrediction Error
12020-1.36458209119004e-14
22121-9.11624882713986e-16
322221.45737940301266e-15
42323-1.19214784627053e-15
524241.66476391063576e-15
625251.7500840561023e-15
726262.10756370097566e-15
827271.43298073051107e-15
928281.56537276554652e-15
1029299.26750276642387e-16
1130304.81456010912892e-15
1231312.21896297534156e-15
133232-1.05205517927696e-16
1433332.53378102051722e-15
153434-1.56553388358363e-15
1635352.226659011951e-15
1736362.18323934342024e-15
1837373.2090804103009e-15
1938381.94037882163542e-15
2039392.77157447829972e-15
214040-2.28865882571782e-15
224141-1.04371468654181e-15
234242-3.64590040857248e-15
244343-3.47280519415377e-15
2544442.18641438131678e-16
264545-1.23907191065998e-15
274646-2.21320937403331e-15
284747-1.05672165447226e-15
294848-1.82932374015947e-15
3049491.06195027768058e-15
315050-6.37595739047603e-16
3251517.60175599429704e-16
335252-1.99570468364025e-15
3453532.75597777859632e-16
355454-4.5890683307324e-16
3655551.81364149535437e-16
375656-4.43941520862121e-17
3857572.49582074838803e-16
395858-1.02680620011053e-15
405959-7.93929467487783e-16
416060-9.85945200119861e-16
4261611.37621423378656e-16
4362626.25995390726218e-16
446363-4.90886482640193e-16
456464-1.90932999629809e-15
466565-1.26532379986883e-15
476666-1.16434887372251e-15
486767-1.36512159894287e-15
496868-1.62276326505731e-15
506969-1.13894598445736e-15
517070-2.8032623785138e-15
527171-7.66468936611677e-16
5372721.69439433403466e-15
5473732.89076259646836e-15
5574743.33688467203187e-15
5675751.65769024499532e-15
5776762.10051078760725e-15
5877771.92073959159022e-15
5978782.05233823633066e-15
6079791.61634589463414e-15
6180801.73979492600611e-15
6281812.44465294694383e-15
6382822.07790971291804e-15
6483832.40232813946462e-15
6584841.43769966226627e-15
6685851.76298545055085e-15
6786861.06718352865664e-15
6887871.20765120561757e-15
698888-1.49737362942058e-15
708989-2.92635836736864e-15
719090-1.1220948307744e-16
729191-1.15103603885482e-15
739292-6.34591220797092e-16
749393-6.21762222169739e-16
759494-5.88987522983616e-16
769595-9.57916094845614e-16
779696-7.01354828428555e-16
789797-1.56376388456362e-15
799898-1.31701298354802e-15
809999-2.06296110948886e-16
81100100-2.76579626032651e-15


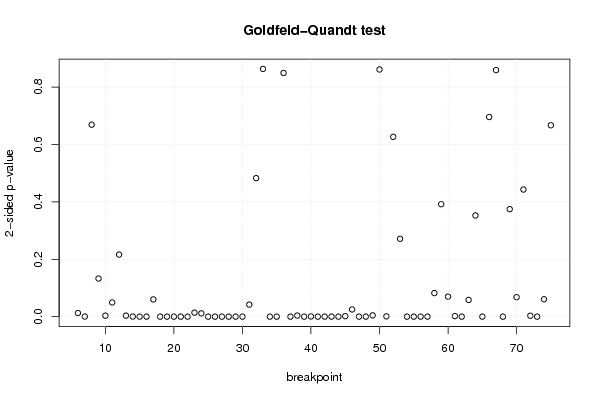
Goldfeld-Quandt test for Heteroskedasticity
p-valuesAlternative Hypothesis
breakpoint indexgreater2-sidedless
60.006312014868989380.01262402973797880.993687985131011
70.0001602779006886810.0003205558013773620.999839722099311
80.3344273114327620.6688546228655240.665572688567238
90.06641261880923770.1328252376184750.933587381190762
100.00170206378924030.003404127578480590.99829793621076
110.02470931047778290.04941862095556580.975290689522217
120.1081477214213640.2162954428427290.891852278578636
130.001772383995241740.003544767990483480.998227616004758
140.0002072695089610250.000414539017922050.999792730491039
156.64773642011007e-081.32954728402201e-070.999999933522636
162.76260983119251e-175.52521966238503e-171
170.02999090941461720.05998181882923450.970009090585383
189.15056670847599e-091.8301133416952e-080.999999990849433
193.10329092812587e-156.20658185625175e-150.999999999999997
203.09964150833352e-126.19928301666704e-120.9999999999969
211.49525358025865e-102.99050716051731e-100.999999999850475
221.8228614155648e-063.64572283112959e-060.999998177138584
230.006947335035240680.01389467007048140.993052664964759
240.9943094915894310.01138101682113880.00569050841056941
256.41206674107593e-151.28241334821519e-140.999999999999994
261.32903457826793e-142.65806915653586e-140.999999999999987
279.22813731941478e-061.84562746388296e-050.999990771862681
283.38175519302065e-156.7635103860413e-150.999999999999997
294.02841712676944e-078.05683425353887e-070.999999597158287
300.9999999754273814.91452381265891e-082.45726190632945e-08
310.02102939805799950.0420587961159990.978970601942
320.7586783581222380.4826432837555250.241321641877762
330.5684411664681030.8631176670637940.431558833531897
341.2401651445682e-102.48033028913641e-100.999999999875984
351.20665620364379e-122.41331240728758e-120.999999999998793
360.4245459022864620.8490918045729240.575454097713538
375.86560224224041e-121.17312044844808e-110.999999999994134
380.001890938263167330.003781876526334650.998109061736833
392.41465188215453e-154.82930376430906e-150.999999999999998
400.0003488786510325550.000697757302065110.999651121348967
414.18846083332277e-098.37692166664554e-090.999999995811539
4212.04382879283427e-161.02191439641714e-16
436.56596104627026e-081.31319220925405e-070.99999993434039
440.9999999999999852.95494393315502e-141.47747196657751e-14
450.0007999329538776840.001599865907755370.999200067046122
460.01257162217681240.02514324435362490.987428377823188
470.9999990152993891.96940122112577e-069.84700610562886e-07
481.74797954762369e-133.49595909524738e-130.999999999999825
490.002326767391957580.004653534783915160.997673232608042
500.4306873167167490.8613746334334990.569312683283251
510.0004940602864098270.0009881205728196540.99950593971359
520.6867435166947440.6265129666105130.313256483305256
530.1356841161735740.2713682323471480.864315883826426
540.9999998034014563.93197087213668e-071.96598543606834e-07
552.8790164894163e-065.7580329788326e-060.999997120983511
563.64841857665103e-307.29683715330206e-301
573.72688045885185e-117.4537609177037e-110.999999999962731
580.9589347241972190.0821305516055610.0410652758027805
590.8040764357168460.3918471285663090.195923564283154
600.03495482766690140.06990965533380280.965045172333099
610.999065475632430.00186904873513980.000934524367569899
621.2406457690369e-252.4812915380738e-251
630.02918574785801110.05837149571602230.970814252141989
640.176342852891090.352685705782180.82365714710891
650.9999999999740265.1948497676836e-112.5974248838418e-11
660.6522026866781750.6955946266436490.347797313321824
670.4296076959741850.8592153919483690.570392304025815
680.9999868249138432.63501723143178e-051.31750861571589e-05
690.1872912162086550.374582432417310.812708783791345
700.03389244081622940.06778488163245880.966107559183771
710.2214941244203340.4429882488406680.778505875579666
720.998431222119040.003137555761919020.00156877788095951
733.16876120406551e-106.33752240813101e-100.999999999683124
740.9696952696932870.06060946061342660.0303047303067133
750.6665617911302630.6668764177394740.333438208869737

\begin{tabular}{lllllllll}
\hline
Goldfeld-Quandt test for Heteroskedasticity \tabularnewline
p-values & Alternative Hypothesis \tabularnewline
breakpoint index & greater & 2-sided & less \tabularnewline
6 & 0.00631201486898938 & 0.0126240297379788 & 0.993687985131011 \tabularnewline
7 & 0.000160277900688681 & 0.000320555801377362 & 0.999839722099311 \tabularnewline
8 & 0.334427311432762 & 0.668854622865524 & 0.665572688567238 \tabularnewline
9 & 0.0664126188092377 & 0.132825237618475 & 0.933587381190762 \tabularnewline
10 & 0.0017020637892403 & 0.00340412757848059 & 0.99829793621076 \tabularnewline
11 & 0.0247093104777829 & 0.0494186209555658 & 0.975290689522217 \tabularnewline
12 & 0.108147721421364 & 0.216295442842729 & 0.891852278578636 \tabularnewline
13 & 0.00177238399524174 & 0.00354476799048348 & 0.998227616004758 \tabularnewline
14 & 0.000207269508961025 & 0.00041453901792205 & 0.999792730491039 \tabularnewline
15 & 6.64773642011007e-08 & 1.32954728402201e-07 & 0.999999933522636 \tabularnewline
16 & 2.76260983119251e-17 & 5.52521966238503e-17 & 1 \tabularnewline
17 & 0.0299909094146172 & 0.0599818188292345 & 0.970009090585383 \tabularnewline
18 & 9.15056670847599e-09 & 1.8301133416952e-08 & 0.999999990849433 \tabularnewline
19 & 3.10329092812587e-15 & 6.20658185625175e-15 & 0.999999999999997 \tabularnewline
20 & 3.09964150833352e-12 & 6.19928301666704e-12 & 0.9999999999969 \tabularnewline
21 & 1.49525358025865e-10 & 2.99050716051731e-10 & 0.999999999850475 \tabularnewline
22 & 1.8228614155648e-06 & 3.64572283112959e-06 & 0.999998177138584 \tabularnewline
23 & 0.00694733503524068 & 0.0138946700704814 & 0.993052664964759 \tabularnewline
24 & 0.994309491589431 & 0.0113810168211388 & 0.00569050841056941 \tabularnewline
25 & 6.41206674107593e-15 & 1.28241334821519e-14 & 0.999999999999994 \tabularnewline
26 & 1.32903457826793e-14 & 2.65806915653586e-14 & 0.999999999999987 \tabularnewline
27 & 9.22813731941478e-06 & 1.84562746388296e-05 & 0.999990771862681 \tabularnewline
28 & 3.38175519302065e-15 & 6.7635103860413e-15 & 0.999999999999997 \tabularnewline
29 & 4.02841712676944e-07 & 8.05683425353887e-07 & 0.999999597158287 \tabularnewline
30 & 0.999999975427381 & 4.91452381265891e-08 & 2.45726190632945e-08 \tabularnewline
31 & 0.0210293980579995 & 0.042058796115999 & 0.978970601942 \tabularnewline
32 & 0.758678358122238 & 0.482643283755525 & 0.241321641877762 \tabularnewline
33 & 0.568441166468103 & 0.863117667063794 & 0.431558833531897 \tabularnewline
34 & 1.2401651445682e-10 & 2.48033028913641e-10 & 0.999999999875984 \tabularnewline
35 & 1.20665620364379e-12 & 2.41331240728758e-12 & 0.999999999998793 \tabularnewline
36 & 0.424545902286462 & 0.849091804572924 & 0.575454097713538 \tabularnewline
37 & 5.86560224224041e-12 & 1.17312044844808e-11 & 0.999999999994134 \tabularnewline
38 & 0.00189093826316733 & 0.00378187652633465 & 0.998109061736833 \tabularnewline
39 & 2.41465188215453e-15 & 4.82930376430906e-15 & 0.999999999999998 \tabularnewline
40 & 0.000348878651032555 & 0.00069775730206511 & 0.999651121348967 \tabularnewline
41 & 4.18846083332277e-09 & 8.37692166664554e-09 & 0.999999995811539 \tabularnewline
42 & 1 & 2.04382879283427e-16 & 1.02191439641714e-16 \tabularnewline
43 & 6.56596104627026e-08 & 1.31319220925405e-07 & 0.99999993434039 \tabularnewline
44 & 0.999999999999985 & 2.95494393315502e-14 & 1.47747196657751e-14 \tabularnewline
45 & 0.000799932953877684 & 0.00159986590775537 & 0.999200067046122 \tabularnewline
46 & 0.0125716221768124 & 0.0251432443536249 & 0.987428377823188 \tabularnewline
47 & 0.999999015299389 & 1.96940122112577e-06 & 9.84700610562886e-07 \tabularnewline
48 & 1.74797954762369e-13 & 3.49595909524738e-13 & 0.999999999999825 \tabularnewline
49 & 0.00232676739195758 & 0.00465353478391516 & 0.997673232608042 \tabularnewline
50 & 0.430687316716749 & 0.861374633433499 & 0.569312683283251 \tabularnewline
51 & 0.000494060286409827 & 0.000988120572819654 & 0.99950593971359 \tabularnewline
52 & 0.686743516694744 & 0.626512966610513 & 0.313256483305256 \tabularnewline
53 & 0.135684116173574 & 0.271368232347148 & 0.864315883826426 \tabularnewline
54 & 0.999999803401456 & 3.93197087213668e-07 & 1.96598543606834e-07 \tabularnewline
55 & 2.8790164894163e-06 & 5.7580329788326e-06 & 0.999997120983511 \tabularnewline
56 & 3.64841857665103e-30 & 7.29683715330206e-30 & 1 \tabularnewline
57 & 3.72688045885185e-11 & 7.4537609177037e-11 & 0.999999999962731 \tabularnewline
58 & 0.958934724197219 & 0.082130551605561 & 0.0410652758027805 \tabularnewline
59 & 0.804076435716846 & 0.391847128566309 & 0.195923564283154 \tabularnewline
60 & 0.0349548276669014 & 0.0699096553338028 & 0.965045172333099 \tabularnewline
61 & 0.99906547563243 & 0.0018690487351398 & 0.000934524367569899 \tabularnewline
62 & 1.2406457690369e-25 & 2.4812915380738e-25 & 1 \tabularnewline
63 & 0.0291857478580111 & 0.0583714957160223 & 0.970814252141989 \tabularnewline
64 & 0.17634285289109 & 0.35268570578218 & 0.82365714710891 \tabularnewline
65 & 0.999999999974026 & 5.1948497676836e-11 & 2.5974248838418e-11 \tabularnewline
66 & 0.652202686678175 & 0.695594626643649 & 0.347797313321824 \tabularnewline
67 & 0.429607695974185 & 0.859215391948369 & 0.570392304025815 \tabularnewline
68 & 0.999986824913843 & 2.63501723143178e-05 & 1.31750861571589e-05 \tabularnewline
69 & 0.187291216208655 & 0.37458243241731 & 0.812708783791345 \tabularnewline
70 & 0.0338924408162294 & 0.0677848816324588 & 0.966107559183771 \tabularnewline
71 & 0.221494124420334 & 0.442988248840668 & 0.778505875579666 \tabularnewline
72 & 0.99843122211904 & 0.00313755576191902 & 0.00156877788095951 \tabularnewline
73 & 3.16876120406551e-10 & 6.33752240813101e-10 & 0.999999999683124 \tabularnewline
74 & 0.969695269693287 & 0.0606094606134266 & 0.0303047303067133 \tabularnewline
75 & 0.666561791130263 & 0.666876417739474 & 0.333438208869737 \tabularnewline
\hline
\end{tabular}
%Source: https://freestatistics.org/blog/index.php?pk=143428&T=5

[TABLE]
[ROW][C]Goldfeld-Quandt test for Heteroskedasticity[/C][/ROW]
[ROW][C]p-values[/C][C]Alternative Hypothesis[/C][/ROW]
[ROW][C]breakpoint index[/C][C]greater[/C][C]2-sided[/C][C]less[/C][/ROW]
[ROW][C]6[/C][C]0.00631201486898938[/C][C]0.0126240297379788[/C][C]0.993687985131011[/C][/ROW]
[ROW][C]7[/C][C]0.000160277900688681[/C][C]0.000320555801377362[/C][C]0.999839722099311[/C][/ROW]
[ROW][C]8[/C][C]0.334427311432762[/C][C]0.668854622865524[/C][C]0.665572688567238[/C][/ROW]
[ROW][C]9[/C][C]0.0664126188092377[/C][C]0.132825237618475[/C][C]0.933587381190762[/C][/ROW]
[ROW][C]10[/C][C]0.0017020637892403[/C][C]0.00340412757848059[/C][C]0.99829793621076[/C][/ROW]
[ROW][C]11[/C][C]0.0247093104777829[/C][C]0.0494186209555658[/C][C]0.975290689522217[/C][/ROW]
[ROW][C]12[/C][C]0.108147721421364[/C][C]0.216295442842729[/C][C]0.891852278578636[/C][/ROW]
[ROW][C]13[/C][C]0.00177238399524174[/C][C]0.00354476799048348[/C][C]0.998227616004758[/C][/ROW]
[ROW][C]14[/C][C]0.000207269508961025[/C][C]0.00041453901792205[/C][C]0.999792730491039[/C][/ROW]
[ROW][C]15[/C][C]6.64773642011007e-08[/C][C]1.32954728402201e-07[/C][C]0.999999933522636[/C][/ROW]
[ROW][C]16[/C][C]2.76260983119251e-17[/C][C]5.52521966238503e-17[/C][C]1[/C][/ROW]
[ROW][C]17[/C][C]0.0299909094146172[/C][C]0.0599818188292345[/C][C]0.970009090585383[/C][/ROW]
[ROW][C]18[/C][C]9.15056670847599e-09[/C][C]1.8301133416952e-08[/C][C]0.999999990849433[/C][/ROW]
[ROW][C]19[/C][C]3.10329092812587e-15[/C][C]6.20658185625175e-15[/C][C]0.999999999999997[/C][/ROW]
[ROW][C]20[/C][C]3.09964150833352e-12[/C][C]6.19928301666704e-12[/C][C]0.9999999999969[/C][/ROW]
[ROW][C]21[/C][C]1.49525358025865e-10[/C][C]2.99050716051731e-10[/C][C]0.999999999850475[/C][/ROW]
[ROW][C]22[/C][C]1.8228614155648e-06[/C][C]3.64572283112959e-06[/C][C]0.999998177138584[/C][/ROW]
[ROW][C]23[/C][C]0.00694733503524068[/C][C]0.0138946700704814[/C][C]0.993052664964759[/C][/ROW]
[ROW][C]24[/C][C]0.994309491589431[/C][C]0.0113810168211388[/C][C]0.00569050841056941[/C][/ROW]
[ROW][C]25[/C][C]6.41206674107593e-15[/C][C]1.28241334821519e-14[/C][C]0.999999999999994[/C][/ROW]
[ROW][C]26[/C][C]1.32903457826793e-14[/C][C]2.65806915653586e-14[/C][C]0.999999999999987[/C][/ROW]
[ROW][C]27[/C][C]9.22813731941478e-06[/C][C]1.84562746388296e-05[/C][C]0.999990771862681[/C][/ROW]
[ROW][C]28[/C][C]3.38175519302065e-15[/C][C]6.7635103860413e-15[/C][C]0.999999999999997[/C][/ROW]
[ROW][C]29[/C][C]4.02841712676944e-07[/C][C]8.05683425353887e-07[/C][C]0.999999597158287[/C][/ROW]
[ROW][C]30[/C][C]0.999999975427381[/C][C]4.91452381265891e-08[/C][C]2.45726190632945e-08[/C][/ROW]
[ROW][C]31[/C][C]0.0210293980579995[/C][C]0.042058796115999[/C][C]0.978970601942[/C][/ROW]
[ROW][C]32[/C][C]0.758678358122238[/C][C]0.482643283755525[/C][C]0.241321641877762[/C][/ROW]
[ROW][C]33[/C][C]0.568441166468103[/C][C]0.863117667063794[/C][C]0.431558833531897[/C][/ROW]
[ROW][C]34[/C][C]1.2401651445682e-10[/C][C]2.48033028913641e-10[/C][C]0.999999999875984[/C][/ROW]
[ROW][C]35[/C][C]1.20665620364379e-12[/C][C]2.41331240728758e-12[/C][C]0.999999999998793[/C][/ROW]
[ROW][C]36[/C][C]0.424545902286462[/C][C]0.849091804572924[/C][C]0.575454097713538[/C][/ROW]
[ROW][C]37[/C][C]5.86560224224041e-12[/C][C]1.17312044844808e-11[/C][C]0.999999999994134[/C][/ROW]
[ROW][C]38[/C][C]0.00189093826316733[/C][C]0.00378187652633465[/C][C]0.998109061736833[/C][/ROW]
[ROW][C]39[/C][C]2.41465188215453e-15[/C][C]4.82930376430906e-15[/C][C]0.999999999999998[/C][/ROW]
[ROW][C]40[/C][C]0.000348878651032555[/C][C]0.00069775730206511[/C][C]0.999651121348967[/C][/ROW]
[ROW][C]41[/C][C]4.18846083332277e-09[/C][C]8.37692166664554e-09[/C][C]0.999999995811539[/C][/ROW]
[ROW][C]42[/C][C]1[/C][C]2.04382879283427e-16[/C][C]1.02191439641714e-16[/C][/ROW]
[ROW][C]43[/C][C]6.56596104627026e-08[/C][C]1.31319220925405e-07[/C][C]0.99999993434039[/C][/ROW]
[ROW][C]44[/C][C]0.999999999999985[/C][C]2.95494393315502e-14[/C][C]1.47747196657751e-14[/C][/ROW]
[ROW][C]45[/C][C]0.000799932953877684[/C][C]0.00159986590775537[/C][C]0.999200067046122[/C][/ROW]
[ROW][C]46[/C][C]0.0125716221768124[/C][C]0.0251432443536249[/C][C]0.987428377823188[/C][/ROW]
[ROW][C]47[/C][C]0.999999015299389[/C][C]1.96940122112577e-06[/C][C]9.84700610562886e-07[/C][/ROW]
[ROW][C]48[/C][C]1.74797954762369e-13[/C][C]3.49595909524738e-13[/C][C]0.999999999999825[/C][/ROW]
[ROW][C]49[/C][C]0.00232676739195758[/C][C]0.00465353478391516[/C][C]0.997673232608042[/C][/ROW]
[ROW][C]50[/C][C]0.430687316716749[/C][C]0.861374633433499[/C][C]0.569312683283251[/C][/ROW]
[ROW][C]51[/C][C]0.000494060286409827[/C][C]0.000988120572819654[/C][C]0.99950593971359[/C][/ROW]
[ROW][C]52[/C][C]0.686743516694744[/C][C]0.626512966610513[/C][C]0.313256483305256[/C][/ROW]
[ROW][C]53[/C][C]0.135684116173574[/C][C]0.271368232347148[/C][C]0.864315883826426[/C][/ROW]
[ROW][C]54[/C][C]0.999999803401456[/C][C]3.93197087213668e-07[/C][C]1.96598543606834e-07[/C][/ROW]
[ROW][C]55[/C][C]2.8790164894163e-06[/C][C]5.7580329788326e-06[/C][C]0.999997120983511[/C][/ROW]
[ROW][C]56[/C][C]3.64841857665103e-30[/C][C]7.29683715330206e-30[/C][C]1[/C][/ROW]
[ROW][C]57[/C][C]3.72688045885185e-11[/C][C]7.4537609177037e-11[/C][C]0.999999999962731[/C][/ROW]
[ROW][C]58[/C][C]0.958934724197219[/C][C]0.082130551605561[/C][C]0.0410652758027805[/C][/ROW]
[ROW][C]59[/C][C]0.804076435716846[/C][C]0.391847128566309[/C][C]0.195923564283154[/C][/ROW]
[ROW][C]60[/C][C]0.0349548276669014[/C][C]0.0699096553338028[/C][C]0.965045172333099[/C][/ROW]
[ROW][C]61[/C][C]0.99906547563243[/C][C]0.0018690487351398[/C][C]0.000934524367569899[/C][/ROW]
[ROW][C]62[/C][C]1.2406457690369e-25[/C][C]2.4812915380738e-25[/C][C]1[/C][/ROW]
[ROW][C]63[/C][C]0.0291857478580111[/C][C]0.0583714957160223[/C][C]0.970814252141989[/C][/ROW]
[ROW][C]64[/C][C]0.17634285289109[/C][C]0.35268570578218[/C][C]0.82365714710891[/C][/ROW]
[ROW][C]65[/C][C]0.999999999974026[/C][C]5.1948497676836e-11[/C][C]2.5974248838418e-11[/C][/ROW]
[ROW][C]66[/C][C]0.652202686678175[/C][C]0.695594626643649[/C][C]0.347797313321824[/C][/ROW]
[ROW][C]67[/C][C]0.429607695974185[/C][C]0.859215391948369[/C][C]0.570392304025815[/C][/ROW]
[ROW][C]68[/C][C]0.999986824913843[/C][C]2.63501723143178e-05[/C][C]1.31750861571589e-05[/C][/ROW]
[ROW][C]69[/C][C]0.187291216208655[/C][C]0.37458243241731[/C][C]0.812708783791345[/C][/ROW]
[ROW][C]70[/C][C]0.0338924408162294[/C][C]0.0677848816324588[/C][C]0.966107559183771[/C][/ROW]
[ROW][C]71[/C][C]0.221494124420334[/C][C]0.442988248840668[/C][C]0.778505875579666[/C][/ROW]
[ROW][C]72[/C][C]0.99843122211904[/C][C]0.00313755576191902[/C][C]0.00156877788095951[/C][/ROW]
[ROW][C]73[/C][C]3.16876120406551e-10[/C][C]6.33752240813101e-10[/C][C]0.999999999683124[/C][/ROW]
[ROW][C]74[/C][C]0.969695269693287[/C][C]0.0606094606134266[/C][C]0.0303047303067133[/C][/ROW]
[ROW][C]75[/C][C]0.666561791130263[/C][C]0.666876417739474[/C][C]0.333438208869737[/C][/ROW]
[/TABLE]
Source: https://freestatistics.org/blog/index.php?pk=143428&T=5

Globally Unique Identifier (entire table): ba.freestatistics.org/blog/index.php?pk=143428&T=5

As an alternative you can also use a QR Code:  

The GUIDs for individual cells are displayed in the table below:

Goldfeld-Quandt test for Heteroskedasticity
p-valuesAlternative Hypothesis
breakpoint indexgreater2-sidedless
60.006312014868989380.01262402973797880.993687985131011
70.0001602779006886810.0003205558013773620.999839722099311
80.3344273114327620.6688546228655240.665572688567238
90.06641261880923770.1328252376184750.933587381190762
100.00170206378924030.003404127578480590.99829793621076
110.02470931047778290.04941862095556580.975290689522217
120.1081477214213640.2162954428427290.891852278578636
130.001772383995241740.003544767990483480.998227616004758
140.0002072695089610250.000414539017922050.999792730491039
156.64773642011007e-081.32954728402201e-070.999999933522636
162.76260983119251e-175.52521966238503e-171
170.02999090941461720.05998181882923450.970009090585383
189.15056670847599e-091.8301133416952e-080.999999990849433
193.10329092812587e-156.20658185625175e-150.999999999999997
203.09964150833352e-126.19928301666704e-120.9999999999969
211.49525358025865e-102.99050716051731e-100.999999999850475
221.8228614155648e-063.64572283112959e-060.999998177138584
230.006947335035240680.01389467007048140.993052664964759
240.9943094915894310.01138101682113880.00569050841056941
256.41206674107593e-151.28241334821519e-140.999999999999994
261.32903457826793e-142.65806915653586e-140.999999999999987
279.22813731941478e-061.84562746388296e-050.999990771862681
283.38175519302065e-156.7635103860413e-150.999999999999997
294.02841712676944e-078.05683425353887e-070.999999597158287
300.9999999754273814.91452381265891e-082.45726190632945e-08
310.02102939805799950.0420587961159990.978970601942
320.7586783581222380.4826432837555250.241321641877762
330.5684411664681030.8631176670637940.431558833531897
341.2401651445682e-102.48033028913641e-100.999999999875984
351.20665620364379e-122.41331240728758e-120.999999999998793
360.4245459022864620.8490918045729240.575454097713538
375.86560224224041e-121.17312044844808e-110.999999999994134
380.001890938263167330.003781876526334650.998109061736833
392.41465188215453e-154.82930376430906e-150.999999999999998
400.0003488786510325550.000697757302065110.999651121348967
414.18846083332277e-098.37692166664554e-090.999999995811539
4212.04382879283427e-161.02191439641714e-16
436.56596104627026e-081.31319220925405e-070.99999993434039
440.9999999999999852.95494393315502e-141.47747196657751e-14
450.0007999329538776840.001599865907755370.999200067046122
460.01257162217681240.02514324435362490.987428377823188
470.9999990152993891.96940122112577e-069.84700610562886e-07
481.74797954762369e-133.49595909524738e-130.999999999999825
490.002326767391957580.004653534783915160.997673232608042
500.4306873167167490.8613746334334990.569312683283251
510.0004940602864098270.0009881205728196540.99950593971359
520.6867435166947440.6265129666105130.313256483305256
530.1356841161735740.2713682323471480.864315883826426
540.9999998034014563.93197087213668e-071.96598543606834e-07
552.8790164894163e-065.7580329788326e-060.999997120983511
563.64841857665103e-307.29683715330206e-301
573.72688045885185e-117.4537609177037e-110.999999999962731
580.9589347241972190.0821305516055610.0410652758027805
590.8040764357168460.3918471285663090.195923564283154
600.03495482766690140.06990965533380280.965045172333099
610.999065475632430.00186904873513980.000934524367569899
621.2406457690369e-252.4812915380738e-251
630.02918574785801110.05837149571602230.970814252141989
640.176342852891090.352685705782180.82365714710891
650.9999999999740265.1948497676836e-112.5974248838418e-11
660.6522026866781750.6955946266436490.347797313321824
670.4296076959741850.8592153919483690.570392304025815
680.9999868249138432.63501723143178e-051.31750861571589e-05
690.1872912162086550.374582432417310.812708783791345
700.03389244081622940.06778488163245880.966107559183771
710.2214941244203340.4429882488406680.778505875579666
720.998431222119040.003137555761919020.00156877788095951
733.16876120406551e-106.33752240813101e-100.999999999683124
740.9696952696932870.06060946061342660.0303047303067133
750.6665617911302630.6668764177394740.333438208869737


Meta Analysis of Goldfeld-Quandt test for Heteroskedasticity
Description# significant tests% significant testsOK/NOK
1% type I error level420.6NOK
5% type I error level480.685714285714286NOK
10% type I error level540.771428571428571NOK

\begin{tabular}{lllllllll}
\hline
Meta Analysis of Goldfeld-Quandt test for Heteroskedasticity \tabularnewline
Description & # significant tests & % significant tests & OK/NOK \tabularnewline
1% type I error level & 42 & 0.6 & NOK \tabularnewline
5% type I error level & 48 & 0.685714285714286 & NOK \tabularnewline
10% type I error level & 54 & 0.771428571428571 & NOK \tabularnewline
\hline
\end{tabular}
%Source: https://freestatistics.org/blog/index.php?pk=143428&T=6

[TABLE]
[ROW][C]Meta Analysis of Goldfeld-Quandt test for Heteroskedasticity[/C][/ROW]
[ROW][C]Description[/C][C]# significant tests[/C][C]% significant tests[/C][C]OK/NOK[/C][/ROW]
[ROW][C]1% type I error level[/C][C]42[/C][C]0.6[/C][C]NOK[/C][/ROW]
[ROW][C]5% type I error level[/C][C]48[/C][C]0.685714285714286[/C][C]NOK[/C][/ROW]
[ROW][C]10% type I error level[/C][C]54[/C][C]0.771428571428571[/C][C]NOK[/C][/ROW]
[/TABLE]
Source: https://freestatistics.org/blog/index.php?pk=143428&T=6

Globally Unique Identifier (entire table): ba.freestatistics.org/blog/index.php?pk=143428&T=6

As an alternative you can also use a QR Code:  

The GUIDs for individual cells are displayed in the table below:

Meta Analysis of Goldfeld-Quandt test for Heteroskedasticity
Description# significant tests% significant testsOK/NOK
1% type I error level420.6NOK
5% type I error level480.685714285714286NOK
10% type I error level540.771428571428571NOK


Parameters (Session):
par1 = 1 ; par2 = Do not include Seasonal Dummies ; par3 = Linear Trend ;
Parameters (R input):
par1 = 1 ; par2 = Do not include Seasonal Dummies ; par3 = Linear Trend ;
R code (references can be found in the software module):
library(lattice)
library(lmtest)
n25 <- 25 #minimum number of obs. for Goldfeld-Quandt test
par1 <- as.numeric(par1)
x <- t(y)
k <- length(x[1,])
n <- length(x[,1])
x1 <- cbind(x[,par1], x[,1:k!=par1])
mycolnames <- c(colnames(x)[par1], colnames(x)[1:k!=par1])
colnames(x1) <- mycolnames #colnames(x)[par1]
x <- x1
if (par3 == 'First Differences'){
x2 <- array(0, dim=c(n-1,k), dimnames=list(1:(n-1), paste('(1-B)',colnames(x),sep='')))
for (i in 1:n-1) {
for (j in 1:k) {
x2[i,j] <- x[i+1,j] - x[i,j]
}
}
x <- x2
}
if (par2 == 'Include Monthly Dummies'){
x2 <- array(0, dim=c(n,11), dimnames=list(1:n, paste('M', seq(1:11), sep ='')))
for (i in 1:11){
x2[seq(i,n,12),i] <- 1
}
x <- cbind(x, x2)
}
if (par2 == 'Include Quarterly Dummies'){
x2 <- array(0, dim=c(n,3), dimnames=list(1:n, paste('Q', seq(1:3), sep ='')))
for (i in 1:3){
x2[seq(i,n,4),i] <- 1
}
x <- cbind(x, x2)
}
k <- length(x[1,])
if (par3 == 'Linear Trend'){
x <- cbind(x, c(1:n))
colnames(x)[k+1] <- 't'
}
x
k <- length(x[1,])
df <- as.data.frame(x)
(mylm <- lm(df))
(mysum <- summary(mylm))
if (n > n25) {
kp3 <- k + 3
nmkm3 <- n - k - 3
gqarr <- array(NA, dim=c(nmkm3-kp3+1,3))
numgqtests <- 0
numsignificant1 <- 0
numsignificant5 <- 0
numsignificant10 <- 0
for (mypoint in kp3:nmkm3) {
j <- 0
numgqtests <- numgqtests + 1
for (myalt in c('greater', 'two.sided', 'less')) {
j <- j + 1
gqarr[mypoint-kp3+1,j] <- gqtest(mylm, point=mypoint, alternative=myalt)$p.value
}
if (gqarr[mypoint-kp3+1,2] < 0.01) numsignificant1 <- numsignificant1 + 1
if (gqarr[mypoint-kp3+1,2] < 0.05) numsignificant5 <- numsignificant5 + 1
if (gqarr[mypoint-kp3+1,2] < 0.10) numsignificant10 <- numsignificant10 + 1
}
gqarr
}
bitmap(file='test0.png')
plot(x[,1], type='l', main='Actuals and Interpolation', ylab='value of Actuals and Interpolation (dots)', xlab='time or index')
points(x[,1]-mysum$resid)
grid()
dev.off()
bitmap(file='test1.png')
plot(mysum$resid, type='b', pch=19, main='Residuals', ylab='value of Residuals', xlab='time or index')
grid()
dev.off()
bitmap(file='test2.png')
hist(mysum$resid, main='Residual Histogram', xlab='values of Residuals')
grid()
dev.off()
bitmap(file='test3.png')
densityplot(~mysum$resid,col='black',main='Residual Density Plot', xlab='values of Residuals')
dev.off()
bitmap(file='test4.png')
qqnorm(mysum$resid, main='Residual Normal Q-Q Plot')
qqline(mysum$resid)
grid()
dev.off()
(myerror <- as.ts(mysum$resid))
bitmap(file='test5.png')
dum <- cbind(lag(myerror,k=1),myerror)
dum
dum1 <- dum[2:length(myerror),]
dum1
z <- as.data.frame(dum1)
z
plot(z,main=paste('Residual Lag plot, lowess, and regression line'), ylab='values of Residuals', xlab='lagged values of Residuals')
lines(lowess(z))
abline(lm(z))
grid()
dev.off()
bitmap(file='test6.png')
acf(mysum$resid, lag.max=length(mysum$resid)/2, main='Residual Autocorrelation Function')
grid()
dev.off()
bitmap(file='test7.png')
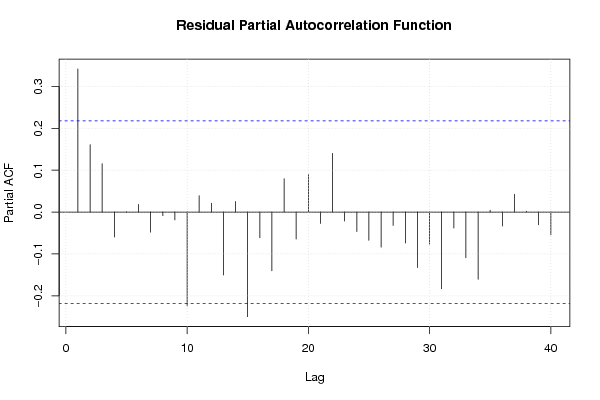
pacf(mysum$resid, lag.max=length(mysum$resid)/2, main='Residual Partial Autocorrelation Function')
grid()
dev.off()
bitmap(file='test8.png')
opar <- par(mfrow = c(2,2), oma = c(0, 0, 1.1, 0))
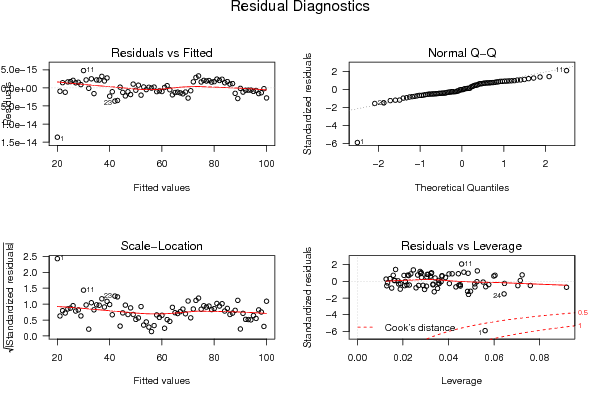
plot(mylm, las = 1, sub='Residual Diagnostics')
par(opar)
dev.off()
if (n > n25) {
bitmap(file='test9.png')
plot(kp3:nmkm3,gqarr[,2], main='Goldfeld-Quandt test',ylab='2-sided p-value',xlab='breakpoint')
grid()
dev.off()
}
load(file='createtable')
a<-table.start()
a<-table.row.start(a)
a<-table.element(a, 'Multiple Linear Regression - Estimated Regression Equation', 1, TRUE)
a<-table.row.end(a)
myeq <- colnames(x)[1]
myeq <- paste(myeq, '[t] = ', sep='')
for (i in 1:k){
if (mysum$coefficients[i,1] > 0) myeq <- paste(myeq, '+', '')
myeq <- paste(myeq, mysum$coefficients[i,1], sep=' ')
if (rownames(mysum$coefficients)[i] != '(Intercept)') {
myeq <- paste(myeq, rownames(mysum$coefficients)[i], sep='')
if (rownames(mysum$coefficients)[i] != 't') myeq <- paste(myeq, '[t]', sep='')
}
}
myeq <- paste(myeq, ' + e[t]')
a<-table.row.start(a)
a<-table.element(a, myeq)
a<-table.row.end(a)
a<-table.end(a)
table.save(a,file='mytable1.tab')
a<-table.start()
a<-table.row.start(a)
a<-table.element(a,hyperlink('ols1.htm','Multiple Linear Regression - Ordinary Least Squares',''), 6, TRUE)
a<-table.row.end(a)
a<-table.row.start(a)
a<-table.element(a,'Variable',header=TRUE)
a<-table.element(a,'Parameter',header=TRUE)
a<-table.element(a,'S.D.',header=TRUE)
a<-table.element(a,'T-STAT
H0: parameter = 0',header=TRUE)
a<-table.element(a,'2-tail p-value',header=TRUE)
a<-table.element(a,'1-tail p-value',header=TRUE)
a<-table.row.end(a)
for (i in 1:k){
a<-table.row.start(a)
a<-table.element(a,rownames(mysum$coefficients)[i],header=TRUE)
a<-table.element(a,mysum$coefficients[i,1])
a<-table.element(a, round(mysum$coefficients[i,2],6))
a<-table.element(a, round(mysum$coefficients[i,3],4))
a<-table.element(a, round(mysum$coefficients[i,4],6))
a<-table.element(a, round(mysum$coefficients[i,4]/2,6))
a<-table.row.end(a)
}
a<-table.end(a)
table.save(a,file='mytable2.tab')
a<-table.start()
a<-table.row.start(a)
a<-table.element(a, 'Multiple Linear Regression - Regression Statistics', 2, TRUE)
a<-table.row.end(a)
a<-table.row.start(a)
a<-table.element(a, 'Multiple R',1,TRUE)
a<-table.element(a, sqrt(mysum$r.squared))
a<-table.row.end(a)
a<-table.row.start(a)
a<-table.element(a, 'R-squared',1,TRUE)
a<-table.element(a, mysum$r.squared)
a<-table.row.end(a)
a<-table.row.start(a)
a<-table.element(a, 'Adjusted R-squared',1,TRUE)
a<-table.element(a, mysum$adj.r.squared)
a<-table.row.end(a)
a<-table.row.start(a)
a<-table.element(a, 'F-TEST (value)',1,TRUE)
a<-table.element(a, mysum$fstatistic[1])
a<-table.row.end(a)
a<-table.row.start(a)
a<-table.element(a, 'F-TEST (DF numerator)',1,TRUE)
a<-table.element(a, mysum$fstatistic[2])
a<-table.row.end(a)
a<-table.row.start(a)
a<-table.element(a, 'F-TEST (DF denominator)',1,TRUE)
a<-table.element(a, mysum$fstatistic[3])
a<-table.row.end(a)
a<-table.row.start(a)
a<-table.element(a, 'p-value',1,TRUE)
a<-table.element(a, 1-pf(mysum$fstatistic[1],mysum$fstatistic[2],mysum$fstatistic[3]))
a<-table.row.end(a)
a<-table.row.start(a)
a<-table.element(a, 'Multiple Linear Regression - Residual Statistics', 2, TRUE)
a<-table.row.end(a)
a<-table.row.start(a)
a<-table.element(a, 'Residual Standard Deviation',1,TRUE)
a<-table.element(a, mysum$sigma)
a<-table.row.end(a)
a<-table.row.start(a)
a<-table.element(a, 'Sum Squared Residuals',1,TRUE)
a<-table.element(a, sum(myerror*myerror))
a<-table.row.end(a)
a<-table.end(a)
table.save(a,file='mytable3.tab')
a<-table.start()
a<-table.row.start(a)
a<-table.element(a, 'Multiple Linear Regression - Actuals, Interpolation, and Residuals', 4, TRUE)
a<-table.row.end(a)
a<-table.row.start(a)
a<-table.element(a, 'Time or Index', 1, TRUE)
a<-table.element(a, 'Actuals', 1, TRUE)
a<-table.element(a, 'Interpolation
Forecast', 1, TRUE)
a<-table.element(a, 'Residuals
Prediction Error', 1, TRUE)
a<-table.row.end(a)
for (i in 1:n) {
a<-table.row.start(a)
a<-table.element(a,i, 1, TRUE)
a<-table.element(a,x[i])
a<-table.element(a,x[i]-mysum$resid[i])
a<-table.element(a,mysum$resid[i])
a<-table.row.end(a)
}
a<-table.end(a)
table.save(a,file='mytable4.tab')
if (n > n25) {
a<-table.start()
a<-table.row.start(a)
a<-table.element(a,'Goldfeld-Quandt test for Heteroskedasticity',4,TRUE)
a<-table.row.end(a)
a<-table.row.start(a)
a<-table.element(a,'p-values',header=TRUE)
a<-table.element(a,'Alternative Hypothesis',3,header=TRUE)
a<-table.row.end(a)
a<-table.row.start(a)
a<-table.element(a,'breakpoint index',header=TRUE)
a<-table.element(a,'greater',header=TRUE)
a<-table.element(a,'2-sided',header=TRUE)
a<-table.element(a,'less',header=TRUE)
a<-table.row.end(a)
for (mypoint in kp3:nmkm3) {
a<-table.row.start(a)
a<-table.element(a,mypoint,header=TRUE)
a<-table.element(a,gqarr[mypoint-kp3+1,1])
a<-table.element(a,gqarr[mypoint-kp3+1,2])
a<-table.element(a,gqarr[mypoint-kp3+1,3])
a<-table.row.end(a)
}
a<-table.end(a)
table.save(a,file='mytable5.tab')
a<-table.start()
a<-table.row.start(a)
a<-table.element(a,'Meta Analysis of Goldfeld-Quandt test for Heteroskedasticity',4,TRUE)
a<-table.row.end(a)
a<-table.row.start(a)
a<-table.element(a,'Description',header=TRUE)
a<-table.element(a,'# significant tests',header=TRUE)
a<-table.element(a,'% significant tests',header=TRUE)
a<-table.element(a,'OK/NOK',header=TRUE)
a<-table.row.end(a)
a<-table.row.start(a)
a<-table.element(a,'1% type I error level',header=TRUE)
a<-table.element(a,numsignificant1)
a<-table.element(a,numsignificant1/numgqtests)
if (numsignificant1/numgqtests < 0.01) dum <- 'OK' else dum <- 'NOK'
a<-table.element(a,dum)
a<-table.row.end(a)
a<-table.row.start(a)
a<-table.element(a,'5% type I error level',header=TRUE)
a<-table.element(a,numsignificant5)
a<-table.element(a,numsignificant5/numgqtests)
if (numsignificant5/numgqtests < 0.05) dum <- 'OK' else dum <- 'NOK'
a<-table.element(a,dum)
a<-table.row.end(a)
a<-table.row.start(a)
a<-table.element(a,'10% type I error level',header=TRUE)
a<-table.element(a,numsignificant10)
a<-table.element(a,numsignificant10/numgqtests)
if (numsignificant10/numgqtests < 0.1) dum <- 'OK' else dum <- 'NOK'
a<-table.element(a,dum)
a<-table.row.end(a)
a<-table.end(a)
table.save(a,file='mytable6.tab')
}