Free Statistics

of Irreproducible Research!

Author's title

Author*The author of this computation has been verified*
R Software Modulerwasp_multipleregression.wasp
Title produced by softwareMultiple Regression
Date of computationFri, 18 Nov 2011 09:42:59 -0500
Cite this page as followsStatistical Computations at FreeStatistics.org, Office for Research Development and Education, URL https://freestatistics.org/blog/index.php?v=date/2011/Nov/18/t1321627433j9p05oewafpkvdh.htm/, Retrieved Thu, 31 Oct 2024 22:51:58 +0000
Statistical Computations at FreeStatistics.org, Office for Research Development and Education, URL https://freestatistics.org/blog/index.php?pk=145459, Retrieved Thu, 31 Oct 2024 22:51:58 +0000
QR Codes:

Original text written by user:
IsPrivate?No (this computation is public)
User-defined keywords
Estimated Impact205
Family? (F = Feedback message, R = changed R code, M = changed R Module, P = changed Parameters, D = changed Data)
-     [Multiple Regression] [Competence to learn] [2010-11-17 07:43:53] [b98453cac15ba1066b407e146608df68]
- R PD    [Multiple Regression] [tutorial multiple...] [2011-11-18 14:42:59] [e7912d585babb6fa20e6bf5178c462ce] [Current]
-    D      [Multiple Regression] [met tijd] [2011-11-18 15:27:56] [379dab8110dbf77cfcc4b7951c3a599f]
-   P         [Multiple Regression] [omzet doorheen de...] [2011-11-20 08:45:25] [74be16979710d4c4e7c6647856088456]
-   PD      [Multiple Regression] [met tijd juist] [2011-11-18 15:40:11] [379dab8110dbf77cfcc4b7951c3a599f]
-             [Multiple Regression] [] [2011-11-19 11:22:09] [74be16979710d4c4e7c6647856088456]
Feedback Forum

Post a new message
Dataseries X:
33907	71433	152	74272	99	765
35981	53655	99	78867	128	1371
36588	70556	92	80176	57	1880
16967	74702	138	36541	95	232
25333	61201	106	55107	205	230
21027	686	95	45527	51	828
21114	87586	145	46001	59	1833
28777	6615	181	62854	194	906
35612	89725	190	78112	27	1781
24183	40420	150	52653	9	1264
22262	49569	186	48467	24	1123
20637	13963	174	44873	189	1461
29948	62508	151	65605	37	820
22093	90901	112	48016	81	107
36997	89418	143	81110	72	1349
31089	83237	120	68019	81	870
19477	22183	169	42198	90	1471
31301	24346	135	68531	216	731
18497	74341	161	40071	216	1945
30142	24188	98	65849	13	521
21326	11781	142	46362	153	1920
16779	23072	190	36313	185	1924
38068	49119	169	83521	131	100
29707	67776	130	64932	136	34
35016	86910	160	76730	182	325
26131	69358	176	56982	139	1677
29251	16144	111	63793	42	1779
22855	77863	165	49740	213	477
31806	89070	117	69447	184	1007
34124	34790	122	74708	44	1527


Summary of computational transaction
Raw Inputview raw input (R code)
Raw Outputview raw output of R engine
Computing time4 seconds
R Server'AstonUniversity' @ aston.wessa.net

\begin{tabular}{lllllllll}
\hline
Summary of computational transaction \tabularnewline
Raw Input & view raw input (R code)  \tabularnewline
Raw Output & view raw output of R engine  \tabularnewline
Computing time & 4 seconds \tabularnewline
R Server & 'AstonUniversity' @ aston.wessa.net \tabularnewline
\hline
\end{tabular}
%Source: https://freestatistics.org/blog/index.php?pk=145459&T=0

[TABLE]
[ROW][C]Summary of computational transaction[/C][/ROW]
[ROW][C]Raw Input[/C][C]view raw input (R code) [/C][/ROW]
[ROW][C]Raw Output[/C][C]view raw output of R engine [/C][/ROW]
[ROW][C]Computing time[/C][C]4 seconds[/C][/ROW]
[ROW][C]R Server[/C][C]'AstonUniversity' @ aston.wessa.net[/C][/ROW]
[/TABLE]
Source: https://freestatistics.org/blog/index.php?pk=145459&T=0

Globally Unique Identifier (entire table): ba.freestatistics.org/blog/index.php?pk=145459&T=0

As an alternative you can also use a QR Code:  

The GUIDs for individual cells are displayed in the table below:

Summary of computational transaction
Raw Inputview raw input (R code)
Raw Outputview raw output of R engine
Computing time4 seconds
R Server'AstonUniversity' @ aston.wessa.net


Multiple Linear Regression - Estimated Regression Equation
Omzet_product[t] = + 572.83488800214 -0.000146008298080128Uitgaven_voor_promotie[t] -0.630378069393324Prijs_product[t] + 0.450256139727406Gem_budget[t] + 0.0365924346513837Index_cons_vertrouwen[t] -0.0080997935324248uitgave_lok_prom[t] + e[t]

\begin{tabular}{lllllllll}
\hline
Multiple Linear Regression - Estimated Regression Equation \tabularnewline
Omzet_product[t] =  +  572.83488800214 -0.000146008298080128Uitgaven_voor_promotie[t] -0.630378069393324Prijs_product[t] +  0.450256139727406Gem_budget[t] +  0.0365924346513837Index_cons_vertrouwen[t] -0.0080997935324248uitgave_lok_prom[t]  + e[t] \tabularnewline
\hline
\end{tabular}
%Source: https://freestatistics.org/blog/index.php?pk=145459&T=1

[TABLE]
[ROW][C]Multiple Linear Regression - Estimated Regression Equation[/C][/ROW]
[ROW][C]Omzet_product[t] =  +  572.83488800214 -0.000146008298080128Uitgaven_voor_promotie[t] -0.630378069393324Prijs_product[t] +  0.450256139727406Gem_budget[t] +  0.0365924346513837Index_cons_vertrouwen[t] -0.0080997935324248uitgave_lok_prom[t]  + e[t][/C][/ROW]
[/TABLE]
Source: https://freestatistics.org/blog/index.php?pk=145459&T=1

Globally Unique Identifier (entire table): ba.freestatistics.org/blog/index.php?pk=145459&T=1

As an alternative you can also use a QR Code:  

The GUIDs for individual cells are displayed in the table below:

Multiple Linear Regression - Estimated Regression Equation
Omzet_product[t] = + 572.83488800214 -0.000146008298080128Uitgaven_voor_promotie[t] -0.630378069393324Prijs_product[t] + 0.450256139727406Gem_budget[t] + 0.0365924346513837Index_cons_vertrouwen[t] -0.0080997935324248uitgave_lok_prom[t] + e[t]


Multiple Linear Regression - Ordinary Least Squares
VariableParameterS.D.T-STATH0: parameter = 02-tail p-value1-tail p-value
(Intercept)572.8348880021439.59558914.467100
Uitgaven_voor_promotie-0.0001460082980801280.00019-0.76660.450810.225405
Prijs_product-0.6303780693933240.188914-3.33690.0027530.001376
Gem_budget0.4502561397274060.0003891157.104700
Index_cons_vertrouwen0.03659243465138370.081580.44850.6577820.328891
uitgave_lok_prom-0.00809979353242480.008937-0.90630.3737670.186884

\begin{tabular}{lllllllll}
\hline
Multiple Linear Regression - Ordinary Least Squares \tabularnewline
Variable & Parameter & S.D. & T-STATH0: parameter = 0 & 2-tail p-value & 1-tail p-value \tabularnewline
(Intercept) & 572.83488800214 & 39.595589 & 14.4671 & 0 & 0 \tabularnewline
Uitgaven_voor_promotie & -0.000146008298080128 & 0.00019 & -0.7666 & 0.45081 & 0.225405 \tabularnewline
Prijs_product & -0.630378069393324 & 0.188914 & -3.3369 & 0.002753 & 0.001376 \tabularnewline
Gem_budget & 0.450256139727406 & 0.000389 & 1157.1047 & 0 & 0 \tabularnewline
Index_cons_vertrouwen & 0.0365924346513837 & 0.08158 & 0.4485 & 0.657782 & 0.328891 \tabularnewline
uitgave_lok_prom & -0.0080997935324248 & 0.008937 & -0.9063 & 0.373767 & 0.186884 \tabularnewline
\hline
\end{tabular}
%Source: https://freestatistics.org/blog/index.php?pk=145459&T=2

[TABLE]
[ROW][C]Multiple Linear Regression - Ordinary Least Squares[/C][/ROW]
[ROW][C]Variable[/C][C]Parameter[/C][C]S.D.[/C][C]T-STATH0: parameter = 0[/C][C]2-tail p-value[/C][C]1-tail p-value[/C][/ROW]
[ROW][C](Intercept)[/C][C]572.83488800214[/C][C]39.595589[/C][C]14.4671[/C][C]0[/C][C]0[/C][/ROW]
[ROW][C]Uitgaven_voor_promotie[/C][C]-0.000146008298080128[/C][C]0.00019[/C][C]-0.7666[/C][C]0.45081[/C][C]0.225405[/C][/ROW]
[ROW][C]Prijs_product[/C][C]-0.630378069393324[/C][C]0.188914[/C][C]-3.3369[/C][C]0.002753[/C][C]0.001376[/C][/ROW]
[ROW][C]Gem_budget[/C][C]0.450256139727406[/C][C]0.000389[/C][C]1157.1047[/C][C]0[/C][C]0[/C][/ROW]
[ROW][C]Index_cons_vertrouwen[/C][C]0.0365924346513837[/C][C]0.08158[/C][C]0.4485[/C][C]0.657782[/C][C]0.328891[/C][/ROW]
[ROW][C]uitgave_lok_prom[/C][C]-0.0080997935324248[/C][C]0.008937[/C][C]-0.9063[/C][C]0.373767[/C][C]0.186884[/C][/ROW]
[/TABLE]
Source: https://freestatistics.org/blog/index.php?pk=145459&T=2

Globally Unique Identifier (entire table): ba.freestatistics.org/blog/index.php?pk=145459&T=2

As an alternative you can also use a QR Code:  

The GUIDs for individual cells are displayed in the table below:

Multiple Linear Regression - Ordinary Least Squares
VariableParameterS.D.T-STATH0: parameter = 02-tail p-value1-tail p-value
(Intercept)572.8348880021439.59558914.467100
Uitgaven_voor_promotie-0.0001460082980801280.00019-0.76660.450810.225405
Prijs_product-0.6303780693933240.188914-3.33690.0027530.001376
Gem_budget0.4502561397274060.0003891157.104700
Index_cons_vertrouwen0.03659243465138370.081580.44850.6577820.328891
uitgave_lok_prom-0.00809979353242480.008937-0.90630.3737670.186884


Multiple Linear Regression - Regression Statistics
Multiple R0.999992331728976
R-squared0.999984663516755
Adjusted R-squared0.999981468416079
F-TEST (value)312974.383256124
F-TEST (DF numerator)5
F-TEST (DF denominator)24
p-value0
Multiple Linear Regression - Residual Statistics
Residual Standard Deviation28.4532671102599
Sum Squared Residuals19430.1218219471

\begin{tabular}{lllllllll}
\hline
Multiple Linear Regression - Regression Statistics \tabularnewline
Multiple R & 0.999992331728976 \tabularnewline
R-squared & 0.999984663516755 \tabularnewline
Adjusted R-squared & 0.999981468416079 \tabularnewline
F-TEST (value) & 312974.383256124 \tabularnewline
F-TEST (DF numerator) & 5 \tabularnewline
F-TEST (DF denominator) & 24 \tabularnewline
p-value & 0 \tabularnewline
Multiple Linear Regression - Residual Statistics \tabularnewline
Residual Standard Deviation & 28.4532671102599 \tabularnewline
Sum Squared Residuals & 19430.1218219471 \tabularnewline
\hline
\end{tabular}
%Source: https://freestatistics.org/blog/index.php?pk=145459&T=3

[TABLE]
[ROW][C]Multiple Linear Regression - Regression Statistics[/C][/ROW]
[ROW][C]Multiple R[/C][C]0.999992331728976[/C][/ROW]
[ROW][C]R-squared[/C][C]0.999984663516755[/C][/ROW]
[ROW][C]Adjusted R-squared[/C][C]0.999981468416079[/C][/ROW]
[ROW][C]F-TEST (value)[/C][C]312974.383256124[/C][/ROW]
[ROW][C]F-TEST (DF numerator)[/C][C]5[/C][/ROW]
[ROW][C]F-TEST (DF denominator)[/C][C]24[/C][/ROW]
[ROW][C]p-value[/C][C]0[/C][/ROW]
[ROW][C]Multiple Linear Regression - Residual Statistics[/C][/ROW]
[ROW][C]Residual Standard Deviation[/C][C]28.4532671102599[/C][/ROW]
[ROW][C]Sum Squared Residuals[/C][C]19430.1218219471[/C][/ROW]
[/TABLE]
Source: https://freestatistics.org/blog/index.php?pk=145459&T=3

Globally Unique Identifier (entire table): ba.freestatistics.org/blog/index.php?pk=145459&T=3

As an alternative you can also use a QR Code:  

The GUIDs for individual cells are displayed in the table below:

Multiple Linear Regression - Regression Statistics
Multiple R0.999992331728976
R-squared0.999984663516755
Adjusted R-squared0.999981468416079
F-TEST (value)312974.383256124
F-TEST (DF numerator)5
F-TEST (DF denominator)24
p-value0
Multiple Linear Regression - Residual Statistics
Residual Standard Deviation28.4532671102599
Sum Squared Residuals19430.1218219471


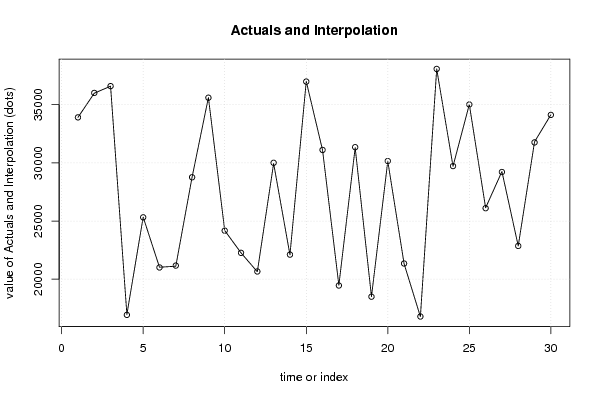
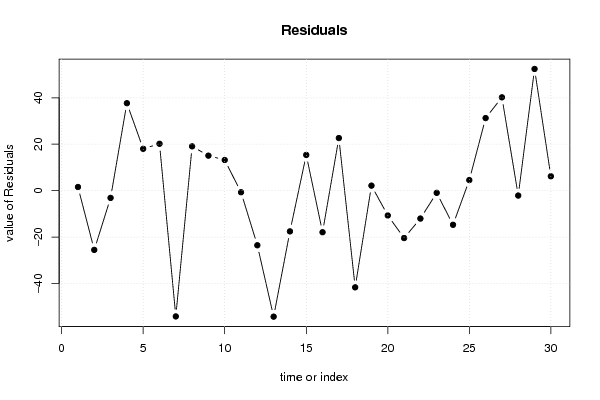
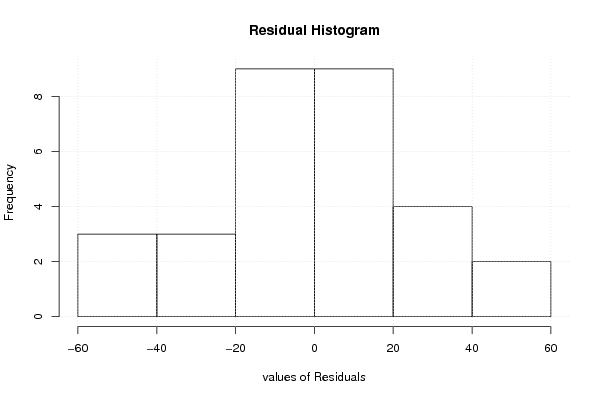
Multiple Linear Regression - Actuals, Interpolation, and Residuals
Time or IndexActualsInterpolationForecastResidualsPrediction Error
13390733905.43792950971.56207049032452
23598136006.5233704825-25.523370482484
33658836591.1327598573-3.13275985730758
41696716929.342333514237.6576664858072
52533325314.982547344918.0174526551017
62102721006.819668209320.1803317907115
72111421168.1865008444-54.1865008443737
82877728757.930538358519.0694616414676
93561235596.932310113715.0676898863351
102418324169.804240138713.1957598612586
112226222262.6935562304-0.693556230366313
122063720660.5363198477-23.5363198477489
132994830002.2872490294-54.2872490293551
142209322110.5563583762-17.5563583762373
153699736981.618581190715.3814188092548
163108931106.9257619196-17.9257619196433
171947719454.349199247922.6508007521272
183130131342.6656590804-41.6656590803559
191849718494.85325842332.14674157672846
203014230152.6984426177-10.6984426176812
212132621346.42326735-20.4232673500205
221677916791.0311509395-12.0311509395281
233806838068.9558884401-0.955888440056607
242970729721.7227234828-14.7227234827574
253501635011.46580720554.53419279454071
262613126099.759852860431.240147139598
272925129210.823035526940.1769644731229
282285522857.1248395458-2.12483954579336
293180631753.59034631152.409653688992
303412434117.82650400176.17349599833911

\begin{tabular}{lllllllll}
\hline
Multiple Linear Regression - Actuals, Interpolation, and Residuals \tabularnewline
Time or Index & Actuals & InterpolationForecast & ResidualsPrediction Error \tabularnewline
1 & 33907 & 33905.4379295097 & 1.56207049032452 \tabularnewline
2 & 35981 & 36006.5233704825 & -25.523370482484 \tabularnewline
3 & 36588 & 36591.1327598573 & -3.13275985730758 \tabularnewline
4 & 16967 & 16929.3423335142 & 37.6576664858072 \tabularnewline
5 & 25333 & 25314.9825473449 & 18.0174526551017 \tabularnewline
6 & 21027 & 21006.8196682093 & 20.1803317907115 \tabularnewline
7 & 21114 & 21168.1865008444 & -54.1865008443737 \tabularnewline
8 & 28777 & 28757.9305383585 & 19.0694616414676 \tabularnewline
9 & 35612 & 35596.9323101137 & 15.0676898863351 \tabularnewline
10 & 24183 & 24169.8042401387 & 13.1957598612586 \tabularnewline
11 & 22262 & 22262.6935562304 & -0.693556230366313 \tabularnewline
12 & 20637 & 20660.5363198477 & -23.5363198477489 \tabularnewline
13 & 29948 & 30002.2872490294 & -54.2872490293551 \tabularnewline
14 & 22093 & 22110.5563583762 & -17.5563583762373 \tabularnewline
15 & 36997 & 36981.6185811907 & 15.3814188092548 \tabularnewline
16 & 31089 & 31106.9257619196 & -17.9257619196433 \tabularnewline
17 & 19477 & 19454.3491992479 & 22.6508007521272 \tabularnewline
18 & 31301 & 31342.6656590804 & -41.6656590803559 \tabularnewline
19 & 18497 & 18494.8532584233 & 2.14674157672846 \tabularnewline
20 & 30142 & 30152.6984426177 & -10.6984426176812 \tabularnewline
21 & 21326 & 21346.42326735 & -20.4232673500205 \tabularnewline
22 & 16779 & 16791.0311509395 & -12.0311509395281 \tabularnewline
23 & 38068 & 38068.9558884401 & -0.955888440056607 \tabularnewline
24 & 29707 & 29721.7227234828 & -14.7227234827574 \tabularnewline
25 & 35016 & 35011.4658072055 & 4.53419279454071 \tabularnewline
26 & 26131 & 26099.7598528604 & 31.240147139598 \tabularnewline
27 & 29251 & 29210.8230355269 & 40.1769644731229 \tabularnewline
28 & 22855 & 22857.1248395458 & -2.12483954579336 \tabularnewline
29 & 31806 & 31753.590346311 & 52.409653688992 \tabularnewline
30 & 34124 & 34117.8265040017 & 6.17349599833911 \tabularnewline
\hline
\end{tabular}
%Source: https://freestatistics.org/blog/index.php?pk=145459&T=4

[TABLE]
[ROW][C]Multiple Linear Regression - Actuals, Interpolation, and Residuals[/C][/ROW]
[ROW][C]Time or Index[/C][C]Actuals[/C][C]InterpolationForecast[/C][C]ResidualsPrediction Error[/C][/ROW]
[ROW][C]1[/C][C]33907[/C][C]33905.4379295097[/C][C]1.56207049032452[/C][/ROW]
[ROW][C]2[/C][C]35981[/C][C]36006.5233704825[/C][C]-25.523370482484[/C][/ROW]
[ROW][C]3[/C][C]36588[/C][C]36591.1327598573[/C][C]-3.13275985730758[/C][/ROW]
[ROW][C]4[/C][C]16967[/C][C]16929.3423335142[/C][C]37.6576664858072[/C][/ROW]
[ROW][C]5[/C][C]25333[/C][C]25314.9825473449[/C][C]18.0174526551017[/C][/ROW]
[ROW][C]6[/C][C]21027[/C][C]21006.8196682093[/C][C]20.1803317907115[/C][/ROW]
[ROW][C]7[/C][C]21114[/C][C]21168.1865008444[/C][C]-54.1865008443737[/C][/ROW]
[ROW][C]8[/C][C]28777[/C][C]28757.9305383585[/C][C]19.0694616414676[/C][/ROW]
[ROW][C]9[/C][C]35612[/C][C]35596.9323101137[/C][C]15.0676898863351[/C][/ROW]
[ROW][C]10[/C][C]24183[/C][C]24169.8042401387[/C][C]13.1957598612586[/C][/ROW]
[ROW][C]11[/C][C]22262[/C][C]22262.6935562304[/C][C]-0.693556230366313[/C][/ROW]
[ROW][C]12[/C][C]20637[/C][C]20660.5363198477[/C][C]-23.5363198477489[/C][/ROW]
[ROW][C]13[/C][C]29948[/C][C]30002.2872490294[/C][C]-54.2872490293551[/C][/ROW]
[ROW][C]14[/C][C]22093[/C][C]22110.5563583762[/C][C]-17.5563583762373[/C][/ROW]
[ROW][C]15[/C][C]36997[/C][C]36981.6185811907[/C][C]15.3814188092548[/C][/ROW]
[ROW][C]16[/C][C]31089[/C][C]31106.9257619196[/C][C]-17.9257619196433[/C][/ROW]
[ROW][C]17[/C][C]19477[/C][C]19454.3491992479[/C][C]22.6508007521272[/C][/ROW]
[ROW][C]18[/C][C]31301[/C][C]31342.6656590804[/C][C]-41.6656590803559[/C][/ROW]
[ROW][C]19[/C][C]18497[/C][C]18494.8532584233[/C][C]2.14674157672846[/C][/ROW]
[ROW][C]20[/C][C]30142[/C][C]30152.6984426177[/C][C]-10.6984426176812[/C][/ROW]
[ROW][C]21[/C][C]21326[/C][C]21346.42326735[/C][C]-20.4232673500205[/C][/ROW]
[ROW][C]22[/C][C]16779[/C][C]16791.0311509395[/C][C]-12.0311509395281[/C][/ROW]
[ROW][C]23[/C][C]38068[/C][C]38068.9558884401[/C][C]-0.955888440056607[/C][/ROW]
[ROW][C]24[/C][C]29707[/C][C]29721.7227234828[/C][C]-14.7227234827574[/C][/ROW]
[ROW][C]25[/C][C]35016[/C][C]35011.4658072055[/C][C]4.53419279454071[/C][/ROW]
[ROW][C]26[/C][C]26131[/C][C]26099.7598528604[/C][C]31.240147139598[/C][/ROW]
[ROW][C]27[/C][C]29251[/C][C]29210.8230355269[/C][C]40.1769644731229[/C][/ROW]
[ROW][C]28[/C][C]22855[/C][C]22857.1248395458[/C][C]-2.12483954579336[/C][/ROW]
[ROW][C]29[/C][C]31806[/C][C]31753.590346311[/C][C]52.409653688992[/C][/ROW]
[ROW][C]30[/C][C]34124[/C][C]34117.8265040017[/C][C]6.17349599833911[/C][/ROW]
[/TABLE]
Source: https://freestatistics.org/blog/index.php?pk=145459&T=4

Globally Unique Identifier (entire table): ba.freestatistics.org/blog/index.php?pk=145459&T=4

As an alternative you can also use a QR Code:  

The GUIDs for individual cells are displayed in the table below:

Multiple Linear Regression - Actuals, Interpolation, and Residuals
Time or IndexActualsInterpolationForecastResidualsPrediction Error
13390733905.43792950971.56207049032452
23598136006.5233704825-25.523370482484
33658836591.1327598573-3.13275985730758
41696716929.342333514237.6576664858072
52533325314.982547344918.0174526551017
62102721006.819668209320.1803317907115
72111421168.1865008444-54.1865008443737
82877728757.930538358519.0694616414676
93561235596.932310113715.0676898863351
102418324169.804240138713.1957598612586
112226222262.6935562304-0.693556230366313
122063720660.5363198477-23.5363198477489
132994830002.2872490294-54.2872490293551
142209322110.5563583762-17.5563583762373
153699736981.618581190715.3814188092548
163108931106.9257619196-17.9257619196433
171947719454.349199247922.6508007521272
183130131342.6656590804-41.6656590803559
191849718494.85325842332.14674157672846
203014230152.6984426177-10.6984426176812
212132621346.42326735-20.4232673500205
221677916791.0311509395-12.0311509395281
233806838068.9558884401-0.955888440056607
242970729721.7227234828-14.7227234827574
253501635011.46580720554.53419279454071
262613126099.759852860431.240147139598
272925129210.823035526940.1769644731229
282285522857.1248395458-2.12483954579336
293180631753.59034631152.409653688992
303412434117.82650400176.17349599833911


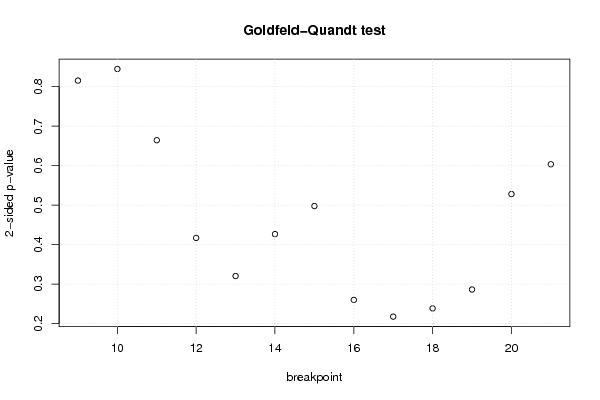
Goldfeld-Quandt test for Heteroskedasticity
p-valuesAlternative Hypothesis
breakpoint indexgreater2-sidedless
90.5922723022284250.815455395543150.407727697771575
100.4224598278694370.8449196557388740.577540172130563
110.3322118100884150.6644236201768290.667788189911586
120.2085227796639610.4170455593279220.791477220336039
130.8397423332484810.3205153335030380.160257666751519
140.7866257803346180.4267484393307640.213374219665382
150.7511215469761170.4977569060477660.248878453023883
160.869942492366640.2601150152667210.13005750763336
170.8911524542755140.2176950914489710.108847545724486
180.8807090977252940.2385818045494110.119290902274706
190.856766297298950.2864674054020990.143233702701049
200.7359350204580260.5281299590839480.264064979541974
210.698214225189240.603571549621520.30178577481076

\begin{tabular}{lllllllll}
\hline
Goldfeld-Quandt test for Heteroskedasticity \tabularnewline
p-values & Alternative Hypothesis \tabularnewline
breakpoint index & greater & 2-sided & less \tabularnewline
9 & 0.592272302228425 & 0.81545539554315 & 0.407727697771575 \tabularnewline
10 & 0.422459827869437 & 0.844919655738874 & 0.577540172130563 \tabularnewline
11 & 0.332211810088415 & 0.664423620176829 & 0.667788189911586 \tabularnewline
12 & 0.208522779663961 & 0.417045559327922 & 0.791477220336039 \tabularnewline
13 & 0.839742333248481 & 0.320515333503038 & 0.160257666751519 \tabularnewline
14 & 0.786625780334618 & 0.426748439330764 & 0.213374219665382 \tabularnewline
15 & 0.751121546976117 & 0.497756906047766 & 0.248878453023883 \tabularnewline
16 & 0.86994249236664 & 0.260115015266721 & 0.13005750763336 \tabularnewline
17 & 0.891152454275514 & 0.217695091448971 & 0.108847545724486 \tabularnewline
18 & 0.880709097725294 & 0.238581804549411 & 0.119290902274706 \tabularnewline
19 & 0.85676629729895 & 0.286467405402099 & 0.143233702701049 \tabularnewline
20 & 0.735935020458026 & 0.528129959083948 & 0.264064979541974 \tabularnewline
21 & 0.69821422518924 & 0.60357154962152 & 0.30178577481076 \tabularnewline
\hline
\end{tabular}
%Source: https://freestatistics.org/blog/index.php?pk=145459&T=5

[TABLE]
[ROW][C]Goldfeld-Quandt test for Heteroskedasticity[/C][/ROW]
[ROW][C]p-values[/C][C]Alternative Hypothesis[/C][/ROW]
[ROW][C]breakpoint index[/C][C]greater[/C][C]2-sided[/C][C]less[/C][/ROW]
[ROW][C]9[/C][C]0.592272302228425[/C][C]0.81545539554315[/C][C]0.407727697771575[/C][/ROW]
[ROW][C]10[/C][C]0.422459827869437[/C][C]0.844919655738874[/C][C]0.577540172130563[/C][/ROW]
[ROW][C]11[/C][C]0.332211810088415[/C][C]0.664423620176829[/C][C]0.667788189911586[/C][/ROW]
[ROW][C]12[/C][C]0.208522779663961[/C][C]0.417045559327922[/C][C]0.791477220336039[/C][/ROW]
[ROW][C]13[/C][C]0.839742333248481[/C][C]0.320515333503038[/C][C]0.160257666751519[/C][/ROW]
[ROW][C]14[/C][C]0.786625780334618[/C][C]0.426748439330764[/C][C]0.213374219665382[/C][/ROW]
[ROW][C]15[/C][C]0.751121546976117[/C][C]0.497756906047766[/C][C]0.248878453023883[/C][/ROW]
[ROW][C]16[/C][C]0.86994249236664[/C][C]0.260115015266721[/C][C]0.13005750763336[/C][/ROW]
[ROW][C]17[/C][C]0.891152454275514[/C][C]0.217695091448971[/C][C]0.108847545724486[/C][/ROW]
[ROW][C]18[/C][C]0.880709097725294[/C][C]0.238581804549411[/C][C]0.119290902274706[/C][/ROW]
[ROW][C]19[/C][C]0.85676629729895[/C][C]0.286467405402099[/C][C]0.143233702701049[/C][/ROW]
[ROW][C]20[/C][C]0.735935020458026[/C][C]0.528129959083948[/C][C]0.264064979541974[/C][/ROW]
[ROW][C]21[/C][C]0.69821422518924[/C][C]0.60357154962152[/C][C]0.30178577481076[/C][/ROW]
[/TABLE]
Source: https://freestatistics.org/blog/index.php?pk=145459&T=5

Globally Unique Identifier (entire table): ba.freestatistics.org/blog/index.php?pk=145459&T=5

As an alternative you can also use a QR Code:  

The GUIDs for individual cells are displayed in the table below:

Goldfeld-Quandt test for Heteroskedasticity
p-valuesAlternative Hypothesis
breakpoint indexgreater2-sidedless
90.5922723022284250.815455395543150.407727697771575
100.4224598278694370.8449196557388740.577540172130563
110.3322118100884150.6644236201768290.667788189911586
120.2085227796639610.4170455593279220.791477220336039
130.8397423332484810.3205153335030380.160257666751519
140.7866257803346180.4267484393307640.213374219665382
150.7511215469761170.4977569060477660.248878453023883
160.869942492366640.2601150152667210.13005750763336
170.8911524542755140.2176950914489710.108847545724486
180.8807090977252940.2385818045494110.119290902274706
190.856766297298950.2864674054020990.143233702701049
200.7359350204580260.5281299590839480.264064979541974
210.698214225189240.603571549621520.30178577481076


Meta Analysis of Goldfeld-Quandt test for Heteroskedasticity
Description# significant tests% significant testsOK/NOK
1% type I error level00OK
5% type I error level00OK
10% type I error level00OK

\begin{tabular}{lllllllll}
\hline
Meta Analysis of Goldfeld-Quandt test for Heteroskedasticity \tabularnewline
Description & # significant tests & % significant tests & OK/NOK \tabularnewline
1% type I error level & 0 & 0 & OK \tabularnewline
5% type I error level & 0 & 0 & OK \tabularnewline
10% type I error level & 0 & 0 & OK \tabularnewline
\hline
\end{tabular}
%Source: https://freestatistics.org/blog/index.php?pk=145459&T=6

[TABLE]
[ROW][C]Meta Analysis of Goldfeld-Quandt test for Heteroskedasticity[/C][/ROW]
[ROW][C]Description[/C][C]# significant tests[/C][C]% significant tests[/C][C]OK/NOK[/C][/ROW]
[ROW][C]1% type I error level[/C][C]0[/C][C]0[/C][C]OK[/C][/ROW]
[ROW][C]5% type I error level[/C][C]0[/C][C]0[/C][C]OK[/C][/ROW]
[ROW][C]10% type I error level[/C][C]0[/C][C]0[/C][C]OK[/C][/ROW]
[/TABLE]
Source: https://freestatistics.org/blog/index.php?pk=145459&T=6

Globally Unique Identifier (entire table): ba.freestatistics.org/blog/index.php?pk=145459&T=6

As an alternative you can also use a QR Code:  

The GUIDs for individual cells are displayed in the table below:

Meta Analysis of Goldfeld-Quandt test for Heteroskedasticity
Description# significant tests% significant testsOK/NOK
1% type I error level00OK
5% type I error level00OK
10% type I error level00OK


Parameters (Session):
par1 = 1 ; par2 = Do not include Seasonal Dummies ; par3 = No Linear Trend ;
Parameters (R input):
par1 = 1 ; par2 = Do not include Seasonal Dummies ; par3 = No Linear Trend ;
R code (references can be found in the software module):
library(lattice)
library(lmtest)
n25 <- 25 #minimum number of obs. for Goldfeld-Quandt test
par1 <- as.numeric(par1)
x <- t(y)
k <- length(x[1,])
n <- length(x[,1])
x1 <- cbind(x[,par1], x[,1:k!=par1])
mycolnames <- c(colnames(x)[par1], colnames(x)[1:k!=par1])
colnames(x1) <- mycolnames #colnames(x)[par1]
x <- x1
if (par3 == 'First Differences'){
x2 <- array(0, dim=c(n-1,k), dimnames=list(1:(n-1), paste('(1-B)',colnames(x),sep='')))
for (i in 1:n-1) {
for (j in 1:k) {
x2[i,j] <- x[i+1,j] - x[i,j]
}
}
x <- x2
}
if (par2 == 'Include Monthly Dummies'){
x2 <- array(0, dim=c(n,11), dimnames=list(1:n, paste('M', seq(1:11), sep ='')))
for (i in 1:11){
x2[seq(i,n,12),i] <- 1
}
x <- cbind(x, x2)
}
if (par2 == 'Include Quarterly Dummies'){
x2 <- array(0, dim=c(n,3), dimnames=list(1:n, paste('Q', seq(1:3), sep ='')))
for (i in 1:3){
x2[seq(i,n,4),i] <- 1
}
x <- cbind(x, x2)
}
k <- length(x[1,])
if (par3 == 'Linear Trend'){
x <- cbind(x, c(1:n))
colnames(x)[k+1] <- 't'
}
x
k <- length(x[1,])
df <- as.data.frame(x)
(mylm <- lm(df))
(mysum <- summary(mylm))
if (n > n25) {
kp3 <- k + 3
nmkm3 <- n - k - 3
gqarr <- array(NA, dim=c(nmkm3-kp3+1,3))
numgqtests <- 0
numsignificant1 <- 0
numsignificant5 <- 0
numsignificant10 <- 0
for (mypoint in kp3:nmkm3) {
j <- 0
numgqtests <- numgqtests + 1
for (myalt in c('greater', 'two.sided', 'less')) {
j <- j + 1
gqarr[mypoint-kp3+1,j] <- gqtest(mylm, point=mypoint, alternative=myalt)$p.value
}
if (gqarr[mypoint-kp3+1,2] < 0.01) numsignificant1 <- numsignificant1 + 1
if (gqarr[mypoint-kp3+1,2] < 0.05) numsignificant5 <- numsignificant5 + 1
if (gqarr[mypoint-kp3+1,2] < 0.10) numsignificant10 <- numsignificant10 + 1
}
gqarr
}
bitmap(file='test0.png')
plot(x[,1], type='l', main='Actuals and Interpolation', ylab='value of Actuals and Interpolation (dots)', xlab='time or index')
points(x[,1]-mysum$resid)
grid()
dev.off()
bitmap(file='test1.png')
plot(mysum$resid, type='b', pch=19, main='Residuals', ylab='value of Residuals', xlab='time or index')
grid()
dev.off()
bitmap(file='test2.png')
hist(mysum$resid, main='Residual Histogram', xlab='values of Residuals')
grid()
dev.off()
bitmap(file='test3.png')
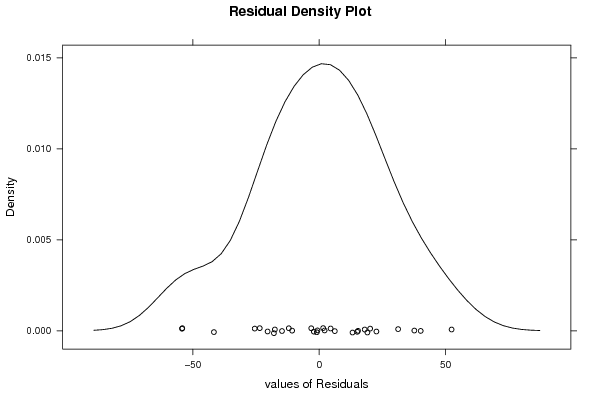
densityplot(~mysum$resid,col='black',main='Residual Density Plot', xlab='values of Residuals')
dev.off()
bitmap(file='test4.png')
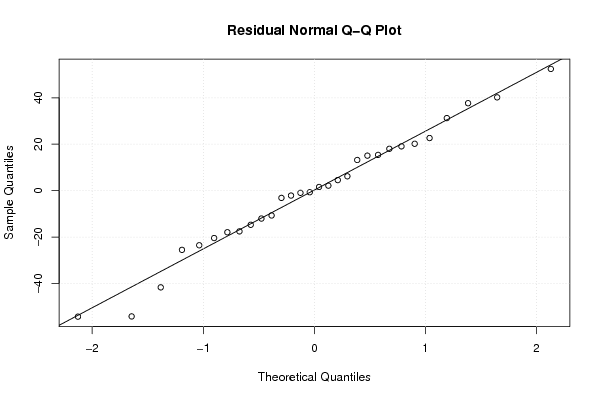
qqnorm(mysum$resid, main='Residual Normal Q-Q Plot')
qqline(mysum$resid)
grid()
dev.off()
(myerror <- as.ts(mysum$resid))
bitmap(file='test5.png')
dum <- cbind(lag(myerror,k=1),myerror)
dum
dum1 <- dum[2:length(myerror),]
dum1
z <- as.data.frame(dum1)
z
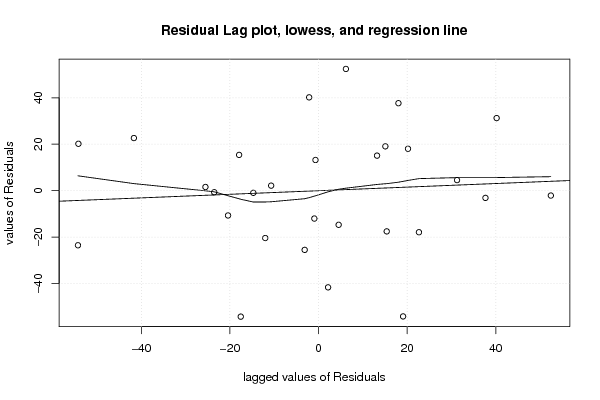
plot(z,main=paste('Residual Lag plot, lowess, and regression line'), ylab='values of Residuals', xlab='lagged values of Residuals')
lines(lowess(z))
abline(lm(z))
grid()
dev.off()
bitmap(file='test6.png')
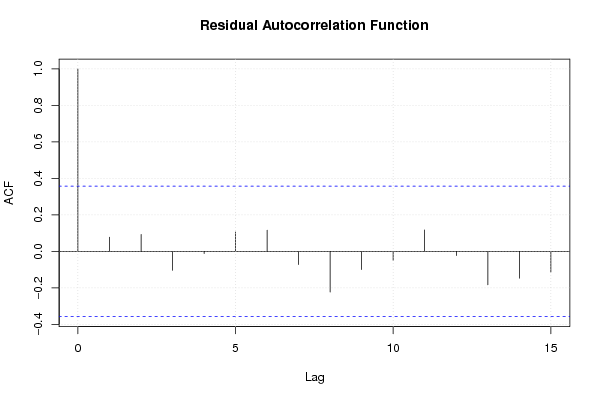
acf(mysum$resid, lag.max=length(mysum$resid)/2, main='Residual Autocorrelation Function')
grid()
dev.off()
bitmap(file='test7.png')
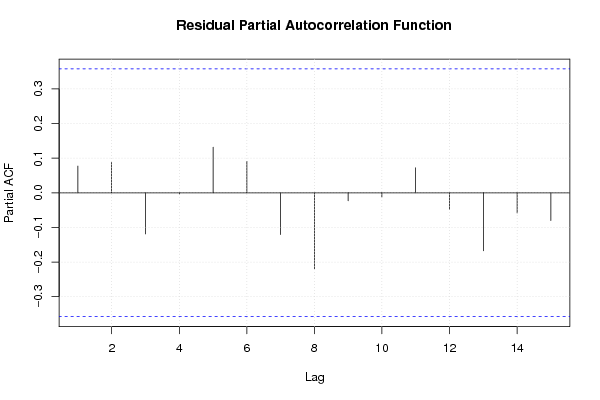
pacf(mysum$resid, lag.max=length(mysum$resid)/2, main='Residual Partial Autocorrelation Function')
grid()
dev.off()
bitmap(file='test8.png')
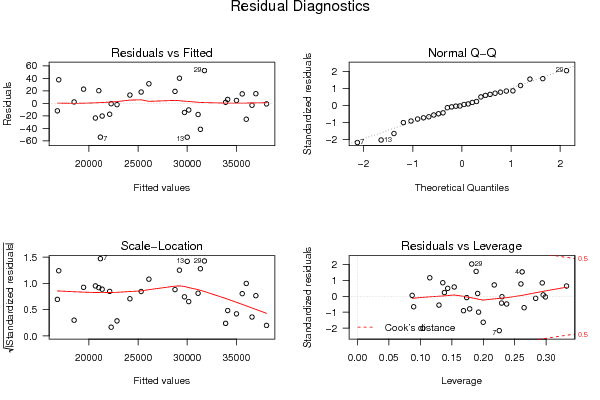
opar <- par(mfrow = c(2,2), oma = c(0, 0, 1.1, 0))
plot(mylm, las = 1, sub='Residual Diagnostics')
par(opar)
dev.off()
if (n > n25) {
bitmap(file='test9.png')
plot(kp3:nmkm3,gqarr[,2], main='Goldfeld-Quandt test',ylab='2-sided p-value',xlab='breakpoint')
grid()
dev.off()
}
load(file='createtable')
a<-table.start()
a<-table.row.start(a)
a<-table.element(a, 'Multiple Linear Regression - Estimated Regression Equation', 1, TRUE)
a<-table.row.end(a)
myeq <- colnames(x)[1]
myeq <- paste(myeq, '[t] = ', sep='')
for (i in 1:k){
if (mysum$coefficients[i,1] > 0) myeq <- paste(myeq, '+', '')
myeq <- paste(myeq, mysum$coefficients[i,1], sep=' ')
if (rownames(mysum$coefficients)[i] != '(Intercept)') {
myeq <- paste(myeq, rownames(mysum$coefficients)[i], sep='')
if (rownames(mysum$coefficients)[i] != 't') myeq <- paste(myeq, '[t]', sep='')
}
}
myeq <- paste(myeq, ' + e[t]')
a<-table.row.start(a)
a<-table.element(a, myeq)
a<-table.row.end(a)
a<-table.end(a)
table.save(a,file='mytable1.tab')
a<-table.start()
a<-table.row.start(a)
a<-table.element(a,hyperlink('ols1.htm','Multiple Linear Regression - Ordinary Least Squares',''), 6, TRUE)
a<-table.row.end(a)
a<-table.row.start(a)
a<-table.element(a,'Variable',header=TRUE)
a<-table.element(a,'Parameter',header=TRUE)
a<-table.element(a,'S.D.',header=TRUE)
a<-table.element(a,'T-STAT
H0: parameter = 0',header=TRUE)
a<-table.element(a,'2-tail p-value',header=TRUE)
a<-table.element(a,'1-tail p-value',header=TRUE)
a<-table.row.end(a)
for (i in 1:k){
a<-table.row.start(a)
a<-table.element(a,rownames(mysum$coefficients)[i],header=TRUE)
a<-table.element(a,mysum$coefficients[i,1])
a<-table.element(a, round(mysum$coefficients[i,2],6))
a<-table.element(a, round(mysum$coefficients[i,3],4))
a<-table.element(a, round(mysum$coefficients[i,4],6))
a<-table.element(a, round(mysum$coefficients[i,4]/2,6))
a<-table.row.end(a)
}
a<-table.end(a)
table.save(a,file='mytable2.tab')
a<-table.start()
a<-table.row.start(a)
a<-table.element(a, 'Multiple Linear Regression - Regression Statistics', 2, TRUE)
a<-table.row.end(a)
a<-table.row.start(a)
a<-table.element(a, 'Multiple R',1,TRUE)
a<-table.element(a, sqrt(mysum$r.squared))
a<-table.row.end(a)
a<-table.row.start(a)
a<-table.element(a, 'R-squared',1,TRUE)
a<-table.element(a, mysum$r.squared)
a<-table.row.end(a)
a<-table.row.start(a)
a<-table.element(a, 'Adjusted R-squared',1,TRUE)
a<-table.element(a, mysum$adj.r.squared)
a<-table.row.end(a)
a<-table.row.start(a)
a<-table.element(a, 'F-TEST (value)',1,TRUE)
a<-table.element(a, mysum$fstatistic[1])
a<-table.row.end(a)
a<-table.row.start(a)
a<-table.element(a, 'F-TEST (DF numerator)',1,TRUE)
a<-table.element(a, mysum$fstatistic[2])
a<-table.row.end(a)
a<-table.row.start(a)
a<-table.element(a, 'F-TEST (DF denominator)',1,TRUE)
a<-table.element(a, mysum$fstatistic[3])
a<-table.row.end(a)
a<-table.row.start(a)
a<-table.element(a, 'p-value',1,TRUE)
a<-table.element(a, 1-pf(mysum$fstatistic[1],mysum$fstatistic[2],mysum$fstatistic[3]))
a<-table.row.end(a)
a<-table.row.start(a)
a<-table.element(a, 'Multiple Linear Regression - Residual Statistics', 2, TRUE)
a<-table.row.end(a)
a<-table.row.start(a)
a<-table.element(a, 'Residual Standard Deviation',1,TRUE)
a<-table.element(a, mysum$sigma)
a<-table.row.end(a)
a<-table.row.start(a)
a<-table.element(a, 'Sum Squared Residuals',1,TRUE)
a<-table.element(a, sum(myerror*myerror))
a<-table.row.end(a)
a<-table.end(a)
table.save(a,file='mytable3.tab')
a<-table.start()
a<-table.row.start(a)
a<-table.element(a, 'Multiple Linear Regression - Actuals, Interpolation, and Residuals', 4, TRUE)
a<-table.row.end(a)
a<-table.row.start(a)
a<-table.element(a, 'Time or Index', 1, TRUE)
a<-table.element(a, 'Actuals', 1, TRUE)
a<-table.element(a, 'Interpolation
Forecast', 1, TRUE)
a<-table.element(a, 'Residuals
Prediction Error', 1, TRUE)
a<-table.row.end(a)
for (i in 1:n) {
a<-table.row.start(a)
a<-table.element(a,i, 1, TRUE)
a<-table.element(a,x[i])
a<-table.element(a,x[i]-mysum$resid[i])
a<-table.element(a,mysum$resid[i])
a<-table.row.end(a)
}
a<-table.end(a)
table.save(a,file='mytable4.tab')
if (n > n25) {
a<-table.start()
a<-table.row.start(a)
a<-table.element(a,'Goldfeld-Quandt test for Heteroskedasticity',4,TRUE)
a<-table.row.end(a)
a<-table.row.start(a)
a<-table.element(a,'p-values',header=TRUE)
a<-table.element(a,'Alternative Hypothesis',3,header=TRUE)
a<-table.row.end(a)
a<-table.row.start(a)
a<-table.element(a,'breakpoint index',header=TRUE)
a<-table.element(a,'greater',header=TRUE)
a<-table.element(a,'2-sided',header=TRUE)
a<-table.element(a,'less',header=TRUE)
a<-table.row.end(a)
for (mypoint in kp3:nmkm3) {
a<-table.row.start(a)
a<-table.element(a,mypoint,header=TRUE)
a<-table.element(a,gqarr[mypoint-kp3+1,1])
a<-table.element(a,gqarr[mypoint-kp3+1,2])
a<-table.element(a,gqarr[mypoint-kp3+1,3])
a<-table.row.end(a)
}
a<-table.end(a)
table.save(a,file='mytable5.tab')
a<-table.start()
a<-table.row.start(a)
a<-table.element(a,'Meta Analysis of Goldfeld-Quandt test for Heteroskedasticity',4,TRUE)
a<-table.row.end(a)
a<-table.row.start(a)
a<-table.element(a,'Description',header=TRUE)
a<-table.element(a,'# significant tests',header=TRUE)
a<-table.element(a,'% significant tests',header=TRUE)
a<-table.element(a,'OK/NOK',header=TRUE)
a<-table.row.end(a)
a<-table.row.start(a)
a<-table.element(a,'1% type I error level',header=TRUE)
a<-table.element(a,numsignificant1)
a<-table.element(a,numsignificant1/numgqtests)
if (numsignificant1/numgqtests < 0.01) dum <- 'OK' else dum <- 'NOK'
a<-table.element(a,dum)
a<-table.row.end(a)
a<-table.row.start(a)
a<-table.element(a,'5% type I error level',header=TRUE)
a<-table.element(a,numsignificant5)
a<-table.element(a,numsignificant5/numgqtests)
if (numsignificant5/numgqtests < 0.05) dum <- 'OK' else dum <- 'NOK'
a<-table.element(a,dum)
a<-table.row.end(a)
a<-table.row.start(a)
a<-table.element(a,'10% type I error level',header=TRUE)
a<-table.element(a,numsignificant10)
a<-table.element(a,numsignificant10/numgqtests)
if (numsignificant10/numgqtests < 0.1) dum <- 'OK' else dum <- 'NOK'
a<-table.element(a,dum)
a<-table.row.end(a)
a<-table.end(a)
table.save(a,file='mytable6.tab')
}