Free Statistics

of Irreproducible Research!

Author's title

Author*The author of this computation has been verified*
R Software Module--
Title produced by softwareMultiple Regression
Date of computationTue, 22 Nov 2011 04:37:41 -0500
Cite this page as followsStatistical Computations at FreeStatistics.org, Office for Research Development and Education, URL https://freestatistics.org/blog/index.php?v=date/2011/Nov/22/t1321954666xydgtxhtgnl38t5.htm/, Retrieved Thu, 31 Oct 2024 22:59:09 +0000
Statistical Computations at FreeStatistics.org, Office for Research Development and Education, URL https://freestatistics.org/blog/index.php?pk=146099, Retrieved Thu, 31 Oct 2024 22:59:09 +0000
QR Codes:

Original text written by user:
IsPrivate?No (this computation is public)
User-defined keywords
Estimated Impact181
Family? (F = Feedback message, R = changed R code, M = changed R Module, P = changed Parameters, D = changed Data)
-     [Multiple Regression] [Decreasing Compet...] [2010-11-17 09:04:39] [b98453cac15ba1066b407e146608df68]
- R PD  [Multiple Regression] [] [2011-11-22 09:15:59] [77e355412ccdb651b3c7eae41c3da865]
-  M        [Multiple Regression] [] [2011-11-22 09:37:41] [5f7ae77ad4c15dc18491c39fdf8bddde] [Current]
Feedback Forum

Post a new message
Dataseries X:
1962	9.5	5.569	1.933	0.226
1963	9.6	5.634	1.947	0.231
1964	9.4	5.433	1.936	0.225
1965	9.4	5.425	1.956	0.229
1966	9.5	5.412	1.965	0.236
1967	9.4	5.247	1.973	0.234
1968	9.7	5.31	1.988	0.253
1969	9.5	5.168	1.985	0.251
1970	9.5	4.927	1.986	0.243
1971	9.3	4.929	1.993	0.239
1972	9.4	4.902	2.003	0.237
1973	9.3	4.82	2	0.23
1974	9.1	4.588	2.015	0.221
1975	8.8	4.312	2.001	0.203
1976	8.8	4.269	2.025	0.195
1977	8.6	4.137	2.035	0.182
1978	8.7	4.099	2.049	0.183
1979	8.5	4.016	2.04	0.175
1980	8.7	4.121	2.079	0.181
1981	8.6	3.97	2.064	0.176
1982	8.5	3.89	2.083	0.172
1983	8.6	3.889	2.091	0.176
1984	8.6	3.788	2.108	0.172
1985	8.7	3.75	2.113	0.174
1986	8.7	3.651	2.115	0.172
1987	8.7	3.559	2.117	0.174
1988	8.8	3.525	2.125	0.18
1989	8.7	3.32	2.142	0.205
1990	8.6	3.218	2.16	0.207
1991	8.5	3.138	2.158	0.207
1992	8.5	3.061	2.143	0.208
1993	8.8	3.099	2.146	0.22
1994	8.8	2.997	2.131	0.227
1995	8.8	2.963	2.117	0.234
1996	8.8	2.883	2.087	0.24
1997	8.6	2.804	2.057	0.24
1998	8.6	2.724	2.024	0.242
1999	8.8	2.678	2.027	0.252
2000	8.7	2.576	1.996	0.25
2001	8.5	2.478	1.96	0.253


Summary of computational transaction
Raw Inputview raw input (R code)
Raw Outputview raw output of R engine
Computing time4 seconds
R Server'Gwilym Jenkins' @ jenkins.wessa.net
R Framework error message
The field 'Names of X columns' contains a hard return which cannot be interpreted.
Please, resubmit your request without hard returns in the 'Names of X columns'.

\begin{tabular}{lllllllll}
\hline
Summary of computational transaction \tabularnewline
Raw Input & view raw input (R code)  \tabularnewline
Raw Output & view raw output of R engine  \tabularnewline
Computing time & 4 seconds \tabularnewline
R Server & 'Gwilym Jenkins' @ jenkins.wessa.net \tabularnewline
R Framework error message & 
The field 'Names of X columns' contains a hard return which cannot be interpreted.
Please, resubmit your request without hard returns in the 'Names of X columns'.
\tabularnewline \hline \end{tabular} %Source: https://freestatistics.org/blog/index.php?pk=146099&T=0

[TABLE]
[ROW][C]Summary of computational transaction[/C][/ROW]
[ROW][C]Raw Input[/C][C]view raw input (R code) [/C][/ROW]
[ROW][C]Raw Output[/C][C]view raw output of R engine [/C][/ROW]
[ROW][C]Computing time[/C][C]4 seconds[/C][/ROW]
[ROW][C]R Server[/C][C]'Gwilym Jenkins' @ jenkins.wessa.net[/C][/ROW]
[ROW][C]R Framework error message[/C][C]
The field 'Names of X columns' contains a hard return which cannot be interpreted.
Please, resubmit your request without hard returns in the 'Names of X columns'.
[/C][/ROW] [/TABLE] Source: https://freestatistics.org/blog/index.php?pk=146099&T=0

Globally Unique Identifier (entire table): ba.freestatistics.org/blog/index.php?pk=146099&T=0

As an alternative you can also use a QR Code:  

The GUIDs for individual cells are displayed in the table below:

Summary of computational transaction
Raw Inputview raw input (R code)
Raw Outputview raw output of R engine
Computing time4 seconds
R Server'Gwilym Jenkins' @ jenkins.wessa.net
R Framework error message
The field 'Names of X columns' contains a hard return which cannot be interpreted.
Please, resubmit your request without hard returns in the 'Names of X columns'.


Multiple Linear Regression - Estimated Regression Equation
Rate[t] = -101.635754448806 + 0.0521185908401921Year[t] + 0.989848512848393Heart_disease[t] + 0.985652705992474Cancer[t] + 6.05030907890774`Diabetes `[t] + e[t]

\begin{tabular}{lllllllll}
\hline
Multiple Linear Regression - Estimated Regression Equation \tabularnewline
Rate[t] =  -101.635754448806 +  0.0521185908401921Year[t] +  0.989848512848393Heart_disease[t] +  0.985652705992474Cancer[t] +  6.05030907890774`Diabetes
`[t]  + e[t] \tabularnewline
\hline
\end{tabular}
%Source: https://freestatistics.org/blog/index.php?pk=146099&T=1

[TABLE]
[ROW][C]Multiple Linear Regression - Estimated Regression Equation[/C][/ROW]
[ROW][C]Rate[t] =  -101.635754448806 +  0.0521185908401921Year[t] +  0.989848512848393Heart_disease[t] +  0.985652705992474Cancer[t] +  6.05030907890774`Diabetes
`[t]  + e[t][/C][/ROW]
[/TABLE]
Source: https://freestatistics.org/blog/index.php?pk=146099&T=1

Globally Unique Identifier (entire table): ba.freestatistics.org/blog/index.php?pk=146099&T=1

As an alternative you can also use a QR Code:  

The GUIDs for individual cells are displayed in the table below:

Multiple Linear Regression - Estimated Regression Equation
Rate[t] = -101.635754448806 + 0.0521185908401921Year[t] + 0.989848512848393Heart_disease[t] + 0.985652705992474Cancer[t] + 6.05030907890774`Diabetes `[t] + e[t]


Multiple Linear Regression - Ordinary Least Squares
VariableParameterS.D.T-STATH0: parameter = 02-tail p-value1-tail p-value
(Intercept)-101.63575444880625.24499-4.0260.000290.000145
Year0.05211859084019210.0125564.1510.0002010.000101
Heart_disease0.9898485128483930.1502586.587700
Cancer0.9856527059924740.3160233.11890.0036220.001811
`Diabetes `6.050309078907740.7072998.554100

\begin{tabular}{lllllllll}
\hline
Multiple Linear Regression - Ordinary Least Squares \tabularnewline
Variable & Parameter & S.D. & T-STATH0: parameter = 0 & 2-tail p-value & 1-tail p-value \tabularnewline
(Intercept) & -101.635754448806 & 25.24499 & -4.026 & 0.00029 & 0.000145 \tabularnewline
Year & 0.0521185908401921 & 0.012556 & 4.151 & 0.000201 & 0.000101 \tabularnewline
Heart_disease & 0.989848512848393 & 0.150258 & 6.5877 & 0 & 0 \tabularnewline
Cancer & 0.985652705992474 & 0.316023 & 3.1189 & 0.003622 & 0.001811 \tabularnewline
`Diabetes
` & 6.05030907890774 & 0.707299 & 8.5541 & 0 & 0 \tabularnewline
\hline
\end{tabular}
%Source: https://freestatistics.org/blog/index.php?pk=146099&T=2

[TABLE]
[ROW][C]Multiple Linear Regression - Ordinary Least Squares[/C][/ROW]
[ROW][C]Variable[/C][C]Parameter[/C][C]S.D.[/C][C]T-STATH0: parameter = 0[/C][C]2-tail p-value[/C][C]1-tail p-value[/C][/ROW]
[ROW][C](Intercept)[/C][C]-101.635754448806[/C][C]25.24499[/C][C]-4.026[/C][C]0.00029[/C][C]0.000145[/C][/ROW]
[ROW][C]Year[/C][C]0.0521185908401921[/C][C]0.012556[/C][C]4.151[/C][C]0.000201[/C][C]0.000101[/C][/ROW]
[ROW][C]Heart_disease[/C][C]0.989848512848393[/C][C]0.150258[/C][C]6.5877[/C][C]0[/C][C]0[/C][/ROW]
[ROW][C]Cancer[/C][C]0.985652705992474[/C][C]0.316023[/C][C]3.1189[/C][C]0.003622[/C][C]0.001811[/C][/ROW]
[ROW][C]`Diabetes
`[/C][C]6.05030907890774[/C][C]0.707299[/C][C]8.5541[/C][C]0[/C][C]0[/C][/ROW]
[/TABLE]
Source: https://freestatistics.org/blog/index.php?pk=146099&T=2

Globally Unique Identifier (entire table): ba.freestatistics.org/blog/index.php?pk=146099&T=2

As an alternative you can also use a QR Code:  

The GUIDs for individual cells are displayed in the table below:

Multiple Linear Regression - Ordinary Least Squares
VariableParameterS.D.T-STATH0: parameter = 02-tail p-value1-tail p-value
(Intercept)-101.63575444880625.24499-4.0260.000290.000145
Year0.05211859084019210.0125564.1510.0002010.000101
Heart_disease0.9898485128483930.1502586.587700
Cancer0.9856527059924740.3160233.11890.0036220.001811
`Diabetes `6.050309078907740.7072998.554100


Multiple Linear Regression - Regression Statistics
Multiple R0.982027381130005
R-squared0.964377777289057
Adjusted R-squared0.960306666122092
F-TEST (value)236.883184402947
F-TEST (DF numerator)4
F-TEST (DF denominator)35
p-value0
Multiple Linear Regression - Residual Statistics
Residual Standard Deviation0.0762399433934353
Sum Squared Residuals0.203438513902197

\begin{tabular}{lllllllll}
\hline
Multiple Linear Regression - Regression Statistics \tabularnewline
Multiple R & 0.982027381130005 \tabularnewline
R-squared & 0.964377777289057 \tabularnewline
Adjusted R-squared & 0.960306666122092 \tabularnewline
F-TEST (value) & 236.883184402947 \tabularnewline
F-TEST (DF numerator) & 4 \tabularnewline
F-TEST (DF denominator) & 35 \tabularnewline
p-value & 0 \tabularnewline
Multiple Linear Regression - Residual Statistics \tabularnewline
Residual Standard Deviation & 0.0762399433934353 \tabularnewline
Sum Squared Residuals & 0.203438513902197 \tabularnewline
\hline
\end{tabular}
%Source: https://freestatistics.org/blog/index.php?pk=146099&T=3

[TABLE]
[ROW][C]Multiple Linear Regression - Regression Statistics[/C][/ROW]
[ROW][C]Multiple R[/C][C]0.982027381130005[/C][/ROW]
[ROW][C]R-squared[/C][C]0.964377777289057[/C][/ROW]
[ROW][C]Adjusted R-squared[/C][C]0.960306666122092[/C][/ROW]
[ROW][C]F-TEST (value)[/C][C]236.883184402947[/C][/ROW]
[ROW][C]F-TEST (DF numerator)[/C][C]4[/C][/ROW]
[ROW][C]F-TEST (DF denominator)[/C][C]35[/C][/ROW]
[ROW][C]p-value[/C][C]0[/C][/ROW]
[ROW][C]Multiple Linear Regression - Residual Statistics[/C][/ROW]
[ROW][C]Residual Standard Deviation[/C][C]0.0762399433934353[/C][/ROW]
[ROW][C]Sum Squared Residuals[/C][C]0.203438513902197[/C][/ROW]
[/TABLE]
Source: https://freestatistics.org/blog/index.php?pk=146099&T=3

Globally Unique Identifier (entire table): ba.freestatistics.org/blog/index.php?pk=146099&T=3

As an alternative you can also use a QR Code:  

The GUIDs for individual cells are displayed in the table below:

Multiple Linear Regression - Regression Statistics
Multiple R0.982027381130005
R-squared0.964377777289057
Adjusted R-squared0.960306666122092
F-TEST (value)236.883184402947
F-TEST (DF numerator)4
F-TEST (DF denominator)35
p-value0
Multiple Linear Regression - Residual Statistics
Residual Standard Deviation0.0762399433934353
Sum Squared Residuals0.203438513902197


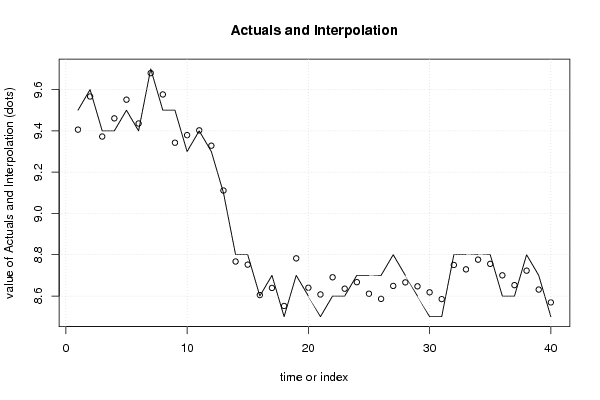
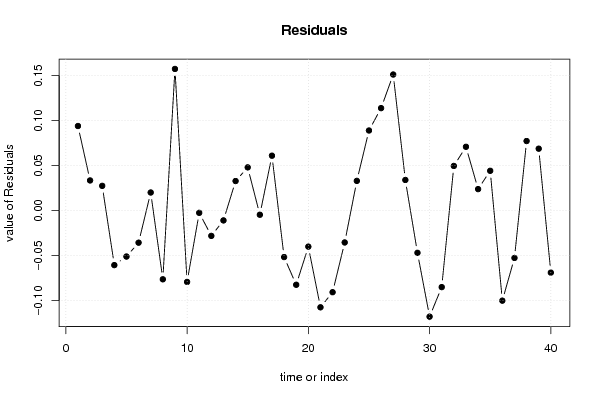
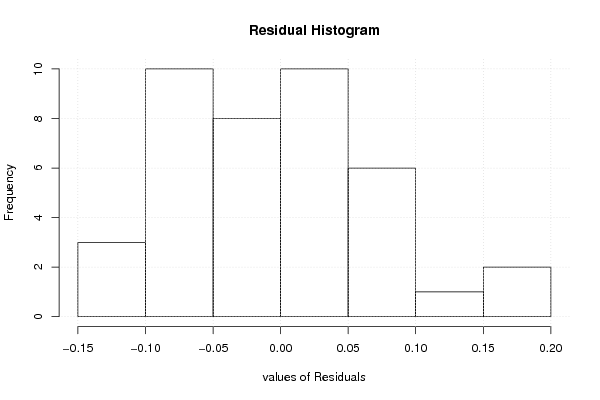
Multiple Linear Regression - Actuals, Interpolation, and Residuals
Time or IndexActualsInterpolationForecastResidualsPrediction Error
19.59.406023680220430.0939763197795691
29.69.56653310767420.0334668923258001
39.49.37254811319250.0274518868075007
49.49.46066220636538-0.0606622063653848
59.59.55113580444483-0.0511358044448348
69.49.43571399415517-0.0357139941551661
79.79.679933704393940.0200662956060583
89.59.57643623013387-0.0764362301338692
99.59.342584509452330.157415490547671
109.39.37938112994453-0.0793811299445338
119.49.40252971983993-0.00252971983992884
129.39.32817161095622-0.0281716109562209
139.19.1109773556953-0.0109773556953043
148.88.767193055685110.0328069443148951
158.88.752001352785370.0479986472146265
168.68.6046624489637-0.00466244896370252
178.78.639016243278460.0609837567215411
188.58.55170406056704-0.0517040605670394
198.78.78249905526347-0.0824990552634671
208.68.64011418467912-0.0401141846791252
218.58.60757105958967-0.107571059589672
228.68.69078625988059-0.0907862598805863
238.68.63548501060933-0.0354850106093316
248.78.667018239649060.0329817603509369
258.78.611012514971430.0889874850285662
268.78.586136966199370.113863033800626
278.88.648787783724110.151212216275894
288.78.666001252404940.0339987475950561
298.68.64699766180028-0.0469976618002799
308.58.61795706620062-0.117957066200615
318.58.5851228400405-0.0851228400405014
328.88.75041634143380.0495836585661976
338.88.729137756925930.0708622430740748
348.88.776154523997730.0238454760022681
358.88.755817507103720.0441824928962752
368.68.70016848424912-0.10016848424912
378.68.6526732729215-0.0526732729215053
388.88.722718881077720.077281118922275
398.78.63121707156380.0687829284361998
408.58.56899793796584-0.0689979379658434

\begin{tabular}{lllllllll}
\hline
Multiple Linear Regression - Actuals, Interpolation, and Residuals \tabularnewline
Time or Index & Actuals & InterpolationForecast & ResidualsPrediction Error \tabularnewline
1 & 9.5 & 9.40602368022043 & 0.0939763197795691 \tabularnewline
2 & 9.6 & 9.5665331076742 & 0.0334668923258001 \tabularnewline
3 & 9.4 & 9.3725481131925 & 0.0274518868075007 \tabularnewline
4 & 9.4 & 9.46066220636538 & -0.0606622063653848 \tabularnewline
5 & 9.5 & 9.55113580444483 & -0.0511358044448348 \tabularnewline
6 & 9.4 & 9.43571399415517 & -0.0357139941551661 \tabularnewline
7 & 9.7 & 9.67993370439394 & 0.0200662956060583 \tabularnewline
8 & 9.5 & 9.57643623013387 & -0.0764362301338692 \tabularnewline
9 & 9.5 & 9.34258450945233 & 0.157415490547671 \tabularnewline
10 & 9.3 & 9.37938112994453 & -0.0793811299445338 \tabularnewline
11 & 9.4 & 9.40252971983993 & -0.00252971983992884 \tabularnewline
12 & 9.3 & 9.32817161095622 & -0.0281716109562209 \tabularnewline
13 & 9.1 & 9.1109773556953 & -0.0109773556953043 \tabularnewline
14 & 8.8 & 8.76719305568511 & 0.0328069443148951 \tabularnewline
15 & 8.8 & 8.75200135278537 & 0.0479986472146265 \tabularnewline
16 & 8.6 & 8.6046624489637 & -0.00466244896370252 \tabularnewline
17 & 8.7 & 8.63901624327846 & 0.0609837567215411 \tabularnewline
18 & 8.5 & 8.55170406056704 & -0.0517040605670394 \tabularnewline
19 & 8.7 & 8.78249905526347 & -0.0824990552634671 \tabularnewline
20 & 8.6 & 8.64011418467912 & -0.0401141846791252 \tabularnewline
21 & 8.5 & 8.60757105958967 & -0.107571059589672 \tabularnewline
22 & 8.6 & 8.69078625988059 & -0.0907862598805863 \tabularnewline
23 & 8.6 & 8.63548501060933 & -0.0354850106093316 \tabularnewline
24 & 8.7 & 8.66701823964906 & 0.0329817603509369 \tabularnewline
25 & 8.7 & 8.61101251497143 & 0.0889874850285662 \tabularnewline
26 & 8.7 & 8.58613696619937 & 0.113863033800626 \tabularnewline
27 & 8.8 & 8.64878778372411 & 0.151212216275894 \tabularnewline
28 & 8.7 & 8.66600125240494 & 0.0339987475950561 \tabularnewline
29 & 8.6 & 8.64699766180028 & -0.0469976618002799 \tabularnewline
30 & 8.5 & 8.61795706620062 & -0.117957066200615 \tabularnewline
31 & 8.5 & 8.5851228400405 & -0.0851228400405014 \tabularnewline
32 & 8.8 & 8.7504163414338 & 0.0495836585661976 \tabularnewline
33 & 8.8 & 8.72913775692593 & 0.0708622430740748 \tabularnewline
34 & 8.8 & 8.77615452399773 & 0.0238454760022681 \tabularnewline
35 & 8.8 & 8.75581750710372 & 0.0441824928962752 \tabularnewline
36 & 8.6 & 8.70016848424912 & -0.10016848424912 \tabularnewline
37 & 8.6 & 8.6526732729215 & -0.0526732729215053 \tabularnewline
38 & 8.8 & 8.72271888107772 & 0.077281118922275 \tabularnewline
39 & 8.7 & 8.6312170715638 & 0.0687829284361998 \tabularnewline
40 & 8.5 & 8.56899793796584 & -0.0689979379658434 \tabularnewline
\hline
\end{tabular}
%Source: https://freestatistics.org/blog/index.php?pk=146099&T=4

[TABLE]
[ROW][C]Multiple Linear Regression - Actuals, Interpolation, and Residuals[/C][/ROW]
[ROW][C]Time or Index[/C][C]Actuals[/C][C]InterpolationForecast[/C][C]ResidualsPrediction Error[/C][/ROW]
[ROW][C]1[/C][C]9.5[/C][C]9.40602368022043[/C][C]0.0939763197795691[/C][/ROW]
[ROW][C]2[/C][C]9.6[/C][C]9.5665331076742[/C][C]0.0334668923258001[/C][/ROW]
[ROW][C]3[/C][C]9.4[/C][C]9.3725481131925[/C][C]0.0274518868075007[/C][/ROW]
[ROW][C]4[/C][C]9.4[/C][C]9.46066220636538[/C][C]-0.0606622063653848[/C][/ROW]
[ROW][C]5[/C][C]9.5[/C][C]9.55113580444483[/C][C]-0.0511358044448348[/C][/ROW]
[ROW][C]6[/C][C]9.4[/C][C]9.43571399415517[/C][C]-0.0357139941551661[/C][/ROW]
[ROW][C]7[/C][C]9.7[/C][C]9.67993370439394[/C][C]0.0200662956060583[/C][/ROW]
[ROW][C]8[/C][C]9.5[/C][C]9.57643623013387[/C][C]-0.0764362301338692[/C][/ROW]
[ROW][C]9[/C][C]9.5[/C][C]9.34258450945233[/C][C]0.157415490547671[/C][/ROW]
[ROW][C]10[/C][C]9.3[/C][C]9.37938112994453[/C][C]-0.0793811299445338[/C][/ROW]
[ROW][C]11[/C][C]9.4[/C][C]9.40252971983993[/C][C]-0.00252971983992884[/C][/ROW]
[ROW][C]12[/C][C]9.3[/C][C]9.32817161095622[/C][C]-0.0281716109562209[/C][/ROW]
[ROW][C]13[/C][C]9.1[/C][C]9.1109773556953[/C][C]-0.0109773556953043[/C][/ROW]
[ROW][C]14[/C][C]8.8[/C][C]8.76719305568511[/C][C]0.0328069443148951[/C][/ROW]
[ROW][C]15[/C][C]8.8[/C][C]8.75200135278537[/C][C]0.0479986472146265[/C][/ROW]
[ROW][C]16[/C][C]8.6[/C][C]8.6046624489637[/C][C]-0.00466244896370252[/C][/ROW]
[ROW][C]17[/C][C]8.7[/C][C]8.63901624327846[/C][C]0.0609837567215411[/C][/ROW]
[ROW][C]18[/C][C]8.5[/C][C]8.55170406056704[/C][C]-0.0517040605670394[/C][/ROW]
[ROW][C]19[/C][C]8.7[/C][C]8.78249905526347[/C][C]-0.0824990552634671[/C][/ROW]
[ROW][C]20[/C][C]8.6[/C][C]8.64011418467912[/C][C]-0.0401141846791252[/C][/ROW]
[ROW][C]21[/C][C]8.5[/C][C]8.60757105958967[/C][C]-0.107571059589672[/C][/ROW]
[ROW][C]22[/C][C]8.6[/C][C]8.69078625988059[/C][C]-0.0907862598805863[/C][/ROW]
[ROW][C]23[/C][C]8.6[/C][C]8.63548501060933[/C][C]-0.0354850106093316[/C][/ROW]
[ROW][C]24[/C][C]8.7[/C][C]8.66701823964906[/C][C]0.0329817603509369[/C][/ROW]
[ROW][C]25[/C][C]8.7[/C][C]8.61101251497143[/C][C]0.0889874850285662[/C][/ROW]
[ROW][C]26[/C][C]8.7[/C][C]8.58613696619937[/C][C]0.113863033800626[/C][/ROW]
[ROW][C]27[/C][C]8.8[/C][C]8.64878778372411[/C][C]0.151212216275894[/C][/ROW]
[ROW][C]28[/C][C]8.7[/C][C]8.66600125240494[/C][C]0.0339987475950561[/C][/ROW]
[ROW][C]29[/C][C]8.6[/C][C]8.64699766180028[/C][C]-0.0469976618002799[/C][/ROW]
[ROW][C]30[/C][C]8.5[/C][C]8.61795706620062[/C][C]-0.117957066200615[/C][/ROW]
[ROW][C]31[/C][C]8.5[/C][C]8.5851228400405[/C][C]-0.0851228400405014[/C][/ROW]
[ROW][C]32[/C][C]8.8[/C][C]8.7504163414338[/C][C]0.0495836585661976[/C][/ROW]
[ROW][C]33[/C][C]8.8[/C][C]8.72913775692593[/C][C]0.0708622430740748[/C][/ROW]
[ROW][C]34[/C][C]8.8[/C][C]8.77615452399773[/C][C]0.0238454760022681[/C][/ROW]
[ROW][C]35[/C][C]8.8[/C][C]8.75581750710372[/C][C]0.0441824928962752[/C][/ROW]
[ROW][C]36[/C][C]8.6[/C][C]8.70016848424912[/C][C]-0.10016848424912[/C][/ROW]
[ROW][C]37[/C][C]8.6[/C][C]8.6526732729215[/C][C]-0.0526732729215053[/C][/ROW]
[ROW][C]38[/C][C]8.8[/C][C]8.72271888107772[/C][C]0.077281118922275[/C][/ROW]
[ROW][C]39[/C][C]8.7[/C][C]8.6312170715638[/C][C]0.0687829284361998[/C][/ROW]
[ROW][C]40[/C][C]8.5[/C][C]8.56899793796584[/C][C]-0.0689979379658434[/C][/ROW]
[/TABLE]
Source: https://freestatistics.org/blog/index.php?pk=146099&T=4

Globally Unique Identifier (entire table): ba.freestatistics.org/blog/index.php?pk=146099&T=4

As an alternative you can also use a QR Code:  

The GUIDs for individual cells are displayed in the table below:

Multiple Linear Regression - Actuals, Interpolation, and Residuals
Time or IndexActualsInterpolationForecastResidualsPrediction Error
19.59.406023680220430.0939763197795691
29.69.56653310767420.0334668923258001
39.49.37254811319250.0274518868075007
49.49.46066220636538-0.0606622063653848
59.59.55113580444483-0.0511358044448348
69.49.43571399415517-0.0357139941551661
79.79.679933704393940.0200662956060583
89.59.57643623013387-0.0764362301338692
99.59.342584509452330.157415490547671
109.39.37938112994453-0.0793811299445338
119.49.40252971983993-0.00252971983992884
129.39.32817161095622-0.0281716109562209
139.19.1109773556953-0.0109773556953043
148.88.767193055685110.0328069443148951
158.88.752001352785370.0479986472146265
168.68.6046624489637-0.00466244896370252
178.78.639016243278460.0609837567215411
188.58.55170406056704-0.0517040605670394
198.78.78249905526347-0.0824990552634671
208.68.64011418467912-0.0401141846791252
218.58.60757105958967-0.107571059589672
228.68.69078625988059-0.0907862598805863
238.68.63548501060933-0.0354850106093316
248.78.667018239649060.0329817603509369
258.78.611012514971430.0889874850285662
268.78.586136966199370.113863033800626
278.88.648787783724110.151212216275894
288.78.666001252404940.0339987475950561
298.68.64699766180028-0.0469976618002799
308.58.61795706620062-0.117957066200615
318.58.5851228400405-0.0851228400405014
328.88.75041634143380.0495836585661976
338.88.729137756925930.0708622430740748
348.88.776154523997730.0238454760022681
358.88.755817507103720.0441824928962752
368.68.70016848424912-0.10016848424912
378.68.6526732729215-0.0526732729215053
388.88.722718881077720.077281118922275
398.78.63121707156380.0687829284361998
408.58.56899793796584-0.0689979379658434


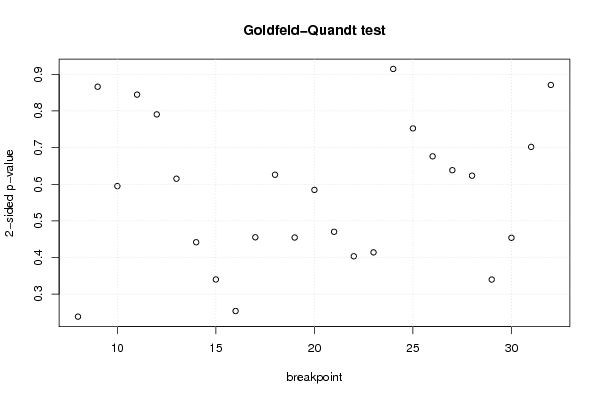
Goldfeld-Quandt test for Heteroskedasticity
p-valuesAlternative Hypothesis
breakpoint indexgreater2-sidedless
80.1192790466575050.238558093315010.880720953342495
90.4331267798099270.8662535596198540.566873220190073
100.2974580450375730.5949160900751450.702541954962427
110.4223472369239830.8446944738479660.577652763076017
120.3953979498566380.7907958997132760.604602050143362
130.3075486685171160.6150973370342320.692451331482884
140.2208355682383350.441671136476670.779164431761665
150.1700437706975940.3400875413951870.829956229302406
160.1269822346861230.2539644693722460.873017765313877
170.2276232372987140.4552464745974270.772376762701286
180.3129932669723330.6259865339446660.687006733027667
190.2273130840356980.4546261680713970.772686915964302
200.2923051339142380.5846102678284750.707694866085762
210.2351292552934810.4702585105869610.764870744706519
220.2016941466644850.403388293328970.798305853335515
230.2070535717796290.4141071435592590.792946428220371
240.4573920282003440.9147840564006880.542607971799656
250.6237181933038350.752563613392330.376281806696165
260.6618440600450980.6763118799098030.338155939954902
270.6808062725059280.6383874549881430.319193727494072
280.6882917629732210.6234164740535580.311708237026779
290.830060233688260.339879532623480.16993976631174
300.7730666739327340.4538666521345320.226933326067266
310.6490019601944750.701996079611050.350998039805525
320.5644638626510040.8710722746979930.435536137348996

\begin{tabular}{lllllllll}
\hline
Goldfeld-Quandt test for Heteroskedasticity \tabularnewline
p-values & Alternative Hypothesis \tabularnewline
breakpoint index & greater & 2-sided & less \tabularnewline
8 & 0.119279046657505 & 0.23855809331501 & 0.880720953342495 \tabularnewline
9 & 0.433126779809927 & 0.866253559619854 & 0.566873220190073 \tabularnewline
10 & 0.297458045037573 & 0.594916090075145 & 0.702541954962427 \tabularnewline
11 & 0.422347236923983 & 0.844694473847966 & 0.577652763076017 \tabularnewline
12 & 0.395397949856638 & 0.790795899713276 & 0.604602050143362 \tabularnewline
13 & 0.307548668517116 & 0.615097337034232 & 0.692451331482884 \tabularnewline
14 & 0.220835568238335 & 0.44167113647667 & 0.779164431761665 \tabularnewline
15 & 0.170043770697594 & 0.340087541395187 & 0.829956229302406 \tabularnewline
16 & 0.126982234686123 & 0.253964469372246 & 0.873017765313877 \tabularnewline
17 & 0.227623237298714 & 0.455246474597427 & 0.772376762701286 \tabularnewline
18 & 0.312993266972333 & 0.625986533944666 & 0.687006733027667 \tabularnewline
19 & 0.227313084035698 & 0.454626168071397 & 0.772686915964302 \tabularnewline
20 & 0.292305133914238 & 0.584610267828475 & 0.707694866085762 \tabularnewline
21 & 0.235129255293481 & 0.470258510586961 & 0.764870744706519 \tabularnewline
22 & 0.201694146664485 & 0.40338829332897 & 0.798305853335515 \tabularnewline
23 & 0.207053571779629 & 0.414107143559259 & 0.792946428220371 \tabularnewline
24 & 0.457392028200344 & 0.914784056400688 & 0.542607971799656 \tabularnewline
25 & 0.623718193303835 & 0.75256361339233 & 0.376281806696165 \tabularnewline
26 & 0.661844060045098 & 0.676311879909803 & 0.338155939954902 \tabularnewline
27 & 0.680806272505928 & 0.638387454988143 & 0.319193727494072 \tabularnewline
28 & 0.688291762973221 & 0.623416474053558 & 0.311708237026779 \tabularnewline
29 & 0.83006023368826 & 0.33987953262348 & 0.16993976631174 \tabularnewline
30 & 0.773066673932734 & 0.453866652134532 & 0.226933326067266 \tabularnewline
31 & 0.649001960194475 & 0.70199607961105 & 0.350998039805525 \tabularnewline
32 & 0.564463862651004 & 0.871072274697993 & 0.435536137348996 \tabularnewline
\hline
\end{tabular}
%Source: https://freestatistics.org/blog/index.php?pk=146099&T=5

[TABLE]
[ROW][C]Goldfeld-Quandt test for Heteroskedasticity[/C][/ROW]
[ROW][C]p-values[/C][C]Alternative Hypothesis[/C][/ROW]
[ROW][C]breakpoint index[/C][C]greater[/C][C]2-sided[/C][C]less[/C][/ROW]
[ROW][C]8[/C][C]0.119279046657505[/C][C]0.23855809331501[/C][C]0.880720953342495[/C][/ROW]
[ROW][C]9[/C][C]0.433126779809927[/C][C]0.866253559619854[/C][C]0.566873220190073[/C][/ROW]
[ROW][C]10[/C][C]0.297458045037573[/C][C]0.594916090075145[/C][C]0.702541954962427[/C][/ROW]
[ROW][C]11[/C][C]0.422347236923983[/C][C]0.844694473847966[/C][C]0.577652763076017[/C][/ROW]
[ROW][C]12[/C][C]0.395397949856638[/C][C]0.790795899713276[/C][C]0.604602050143362[/C][/ROW]
[ROW][C]13[/C][C]0.307548668517116[/C][C]0.615097337034232[/C][C]0.692451331482884[/C][/ROW]
[ROW][C]14[/C][C]0.220835568238335[/C][C]0.44167113647667[/C][C]0.779164431761665[/C][/ROW]
[ROW][C]15[/C][C]0.170043770697594[/C][C]0.340087541395187[/C][C]0.829956229302406[/C][/ROW]
[ROW][C]16[/C][C]0.126982234686123[/C][C]0.253964469372246[/C][C]0.873017765313877[/C][/ROW]
[ROW][C]17[/C][C]0.227623237298714[/C][C]0.455246474597427[/C][C]0.772376762701286[/C][/ROW]
[ROW][C]18[/C][C]0.312993266972333[/C][C]0.625986533944666[/C][C]0.687006733027667[/C][/ROW]
[ROW][C]19[/C][C]0.227313084035698[/C][C]0.454626168071397[/C][C]0.772686915964302[/C][/ROW]
[ROW][C]20[/C][C]0.292305133914238[/C][C]0.584610267828475[/C][C]0.707694866085762[/C][/ROW]
[ROW][C]21[/C][C]0.235129255293481[/C][C]0.470258510586961[/C][C]0.764870744706519[/C][/ROW]
[ROW][C]22[/C][C]0.201694146664485[/C][C]0.40338829332897[/C][C]0.798305853335515[/C][/ROW]
[ROW][C]23[/C][C]0.207053571779629[/C][C]0.414107143559259[/C][C]0.792946428220371[/C][/ROW]
[ROW][C]24[/C][C]0.457392028200344[/C][C]0.914784056400688[/C][C]0.542607971799656[/C][/ROW]
[ROW][C]25[/C][C]0.623718193303835[/C][C]0.75256361339233[/C][C]0.376281806696165[/C][/ROW]
[ROW][C]26[/C][C]0.661844060045098[/C][C]0.676311879909803[/C][C]0.338155939954902[/C][/ROW]
[ROW][C]27[/C][C]0.680806272505928[/C][C]0.638387454988143[/C][C]0.319193727494072[/C][/ROW]
[ROW][C]28[/C][C]0.688291762973221[/C][C]0.623416474053558[/C][C]0.311708237026779[/C][/ROW]
[ROW][C]29[/C][C]0.83006023368826[/C][C]0.33987953262348[/C][C]0.16993976631174[/C][/ROW]
[ROW][C]30[/C][C]0.773066673932734[/C][C]0.453866652134532[/C][C]0.226933326067266[/C][/ROW]
[ROW][C]31[/C][C]0.649001960194475[/C][C]0.70199607961105[/C][C]0.350998039805525[/C][/ROW]
[ROW][C]32[/C][C]0.564463862651004[/C][C]0.871072274697993[/C][C]0.435536137348996[/C][/ROW]
[/TABLE]
Source: https://freestatistics.org/blog/index.php?pk=146099&T=5

Globally Unique Identifier (entire table): ba.freestatistics.org/blog/index.php?pk=146099&T=5

As an alternative you can also use a QR Code:  

The GUIDs for individual cells are displayed in the table below:

Goldfeld-Quandt test for Heteroskedasticity
p-valuesAlternative Hypothesis
breakpoint indexgreater2-sidedless
80.1192790466575050.238558093315010.880720953342495
90.4331267798099270.8662535596198540.566873220190073
100.2974580450375730.5949160900751450.702541954962427
110.4223472369239830.8446944738479660.577652763076017
120.3953979498566380.7907958997132760.604602050143362
130.3075486685171160.6150973370342320.692451331482884
140.2208355682383350.441671136476670.779164431761665
150.1700437706975940.3400875413951870.829956229302406
160.1269822346861230.2539644693722460.873017765313877
170.2276232372987140.4552464745974270.772376762701286
180.3129932669723330.6259865339446660.687006733027667
190.2273130840356980.4546261680713970.772686915964302
200.2923051339142380.5846102678284750.707694866085762
210.2351292552934810.4702585105869610.764870744706519
220.2016941466644850.403388293328970.798305853335515
230.2070535717796290.4141071435592590.792946428220371
240.4573920282003440.9147840564006880.542607971799656
250.6237181933038350.752563613392330.376281806696165
260.6618440600450980.6763118799098030.338155939954902
270.6808062725059280.6383874549881430.319193727494072
280.6882917629732210.6234164740535580.311708237026779
290.830060233688260.339879532623480.16993976631174
300.7730666739327340.4538666521345320.226933326067266
310.6490019601944750.701996079611050.350998039805525
320.5644638626510040.8710722746979930.435536137348996


Meta Analysis of Goldfeld-Quandt test for Heteroskedasticity
Description# significant tests% significant testsOK/NOK
1% type I error level00OK
5% type I error level00OK
10% type I error level00OK

\begin{tabular}{lllllllll}
\hline
Meta Analysis of Goldfeld-Quandt test for Heteroskedasticity \tabularnewline
Description & # significant tests & % significant tests & OK/NOK \tabularnewline
1% type I error level & 0 & 0 & OK \tabularnewline
5% type I error level & 0 & 0 & OK \tabularnewline
10% type I error level & 0 & 0 & OK \tabularnewline
\hline
\end{tabular}
%Source: https://freestatistics.org/blog/index.php?pk=146099&T=6

[TABLE]
[ROW][C]Meta Analysis of Goldfeld-Quandt test for Heteroskedasticity[/C][/ROW]
[ROW][C]Description[/C][C]# significant tests[/C][C]% significant tests[/C][C]OK/NOK[/C][/ROW]
[ROW][C]1% type I error level[/C][C]0[/C][C]0[/C][C]OK[/C][/ROW]
[ROW][C]5% type I error level[/C][C]0[/C][C]0[/C][C]OK[/C][/ROW]
[ROW][C]10% type I error level[/C][C]0[/C][C]0[/C][C]OK[/C][/ROW]
[/TABLE]
Source: https://freestatistics.org/blog/index.php?pk=146099&T=6

Globally Unique Identifier (entire table): ba.freestatistics.org/blog/index.php?pk=146099&T=6

As an alternative you can also use a QR Code:  

The GUIDs for individual cells are displayed in the table below:

Meta Analysis of Goldfeld-Quandt test for Heteroskedasticity
Description# significant tests% significant testsOK/NOK
1% type I error level00OK
5% type I error level00OK
10% type I error level00OK


Parameters (Session):
par1 = 2 ; par2 = Do not include Seasonal Dummies ; par3 = No Linear Trend ;
Parameters (R input):
par1 = 2 ; par2 = Do not include Seasonal Dummies ; par3 = No Linear Trend ; par4 = ; par5 = ; par6 = ; par7 = ; par8 = ; par9 = ; par10 = ; par11 = ; par12 = ; par13 = ; par14 = ; par15 = ; par16 = ; par17 = ; par18 = ; par19 = ; par20 = ;
R code (references can be found in the software module):
library(lattice)
library(lmtest)
n25 <- 25 #minimum number of obs. for Goldfeld-Quandt test
par1 <- as.numeric(par1)
x <- t(y)
k <- length(x[1,])
n <- length(x[,1])
x1 <- cbind(x[,par1], x[,1:k!=par1])
mycolnames <- c(colnames(x)[par1], colnames(x)[1:k!=par1])
colnames(x1) <- mycolnames #colnames(x)[par1]
x <- x1
if (par3 == 'First Differences'){
x2 <- array(0, dim=c(n-1,k), dimnames=list(1:(n-1), paste('(1-B)',colnames(x),sep='')))
for (i in 1:n-1) {
for (j in 1:k) {
x2[i,j] <- x[i+1,j] - x[i,j]
}
}
x <- x2
}
if (par2 == 'Include Monthly Dummies'){
x2 <- array(0, dim=c(n,11), dimnames=list(1:n, paste('M', seq(1:11), sep ='')))
for (i in 1:11){
x2[seq(i,n,12),i] <- 1
}
x <- cbind(x, x2)
}
if (par2 == 'Include Quarterly Dummies'){
x2 <- array(0, dim=c(n,3), dimnames=list(1:n, paste('Q', seq(1:3), sep ='')))
for (i in 1:3){
x2[seq(i,n,4),i] <- 1
}
x <- cbind(x, x2)
}
k <- length(x[1,])
if (par3 == 'Linear Trend'){
x <- cbind(x, c(1:n))
colnames(x)[k+1] <- 't'
}
x
k <- length(x[1,])
df <- as.data.frame(x)
(mylm <- lm(df))
(mysum <- summary(mylm))
if (n > n25) {
kp3 <- k + 3
nmkm3 <- n - k - 3
gqarr <- array(NA, dim=c(nmkm3-kp3+1,3))
numgqtests <- 0
numsignificant1 <- 0
numsignificant5 <- 0
numsignificant10 <- 0
for (mypoint in kp3:nmkm3) {
j <- 0
numgqtests <- numgqtests + 1
for (myalt in c('greater', 'two.sided', 'less')) {
j <- j + 1
gqarr[mypoint-kp3+1,j] <- gqtest(mylm, point=mypoint, alternative=myalt)$p.value
}
if (gqarr[mypoint-kp3+1,2] < 0.01) numsignificant1 <- numsignificant1 + 1
if (gqarr[mypoint-kp3+1,2] < 0.05) numsignificant5 <- numsignificant5 + 1
if (gqarr[mypoint-kp3+1,2] < 0.10) numsignificant10 <- numsignificant10 + 1
}
gqarr
}
bitmap(file='test0.png')
plot(x[,1], type='l', main='Actuals and Interpolation', ylab='value of Actuals and Interpolation (dots)', xlab='time or index')
points(x[,1]-mysum$resid)
grid()
dev.off()
bitmap(file='test1.png')
plot(mysum$resid, type='b', pch=19, main='Residuals', ylab='value of Residuals', xlab='time or index')
grid()
dev.off()
bitmap(file='test2.png')
hist(mysum$resid, main='Residual Histogram', xlab='values of Residuals')
grid()
dev.off()
bitmap(file='test3.png')
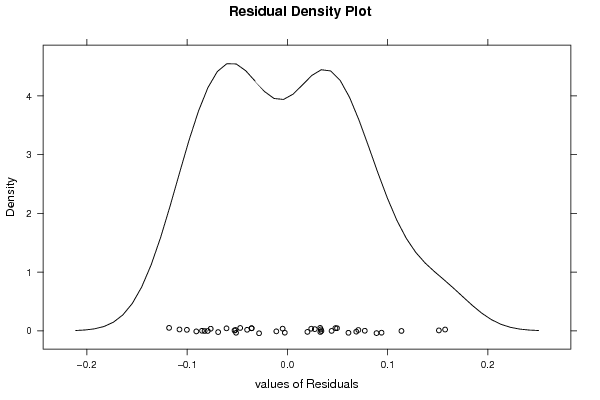
densityplot(~mysum$resid,col='black',main='Residual Density Plot', xlab='values of Residuals')
dev.off()
bitmap(file='test4.png')
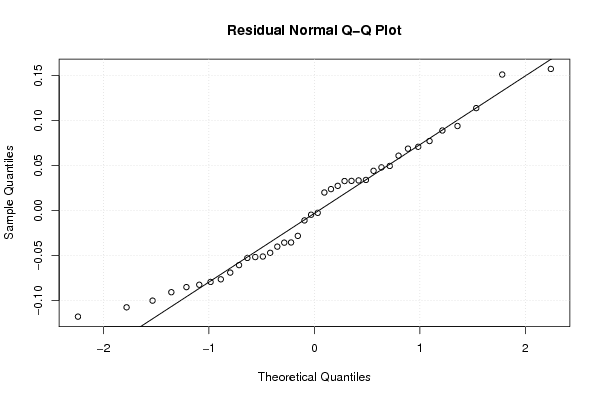
qqnorm(mysum$resid, main='Residual Normal Q-Q Plot')
qqline(mysum$resid)
grid()
dev.off()
(myerror <- as.ts(mysum$resid))
bitmap(file='test5.png')
dum <- cbind(lag(myerror,k=1),myerror)
dum
dum1 <- dum[2:length(myerror),]
dum1
z <- as.data.frame(dum1)
z
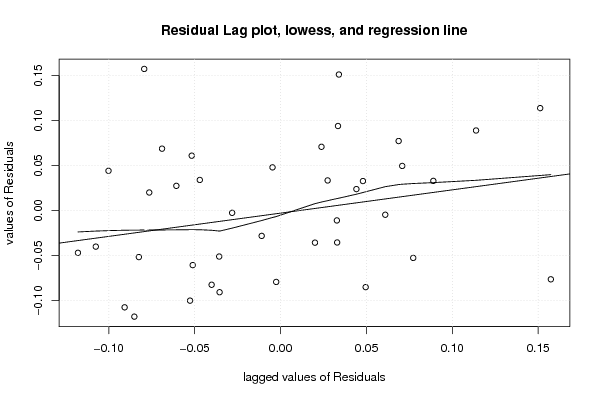
plot(z,main=paste('Residual Lag plot, lowess, and regression line'), ylab='values of Residuals', xlab='lagged values of Residuals')
lines(lowess(z))
abline(lm(z))
grid()
dev.off()
bitmap(file='test6.png')
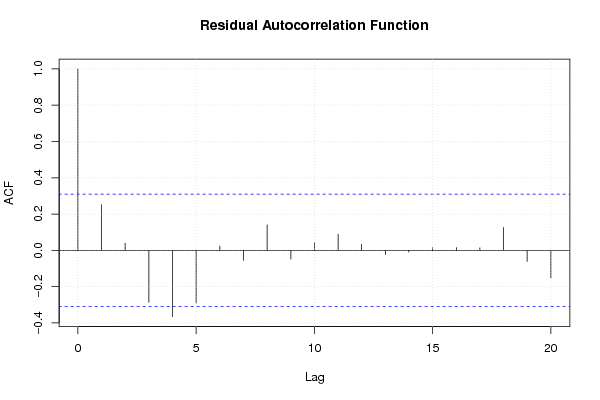
acf(mysum$resid, lag.max=length(mysum$resid)/2, main='Residual Autocorrelation Function')
grid()
dev.off()
bitmap(file='test7.png')
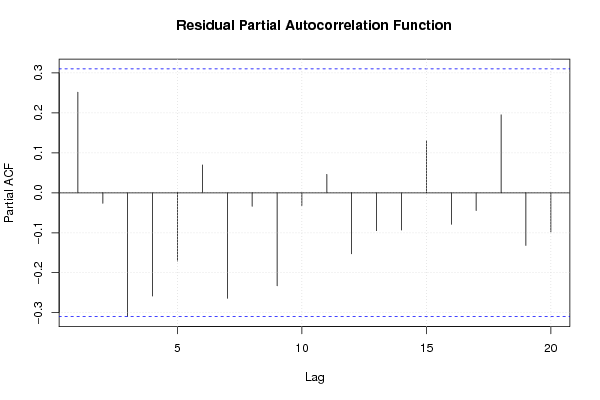
pacf(mysum$resid, lag.max=length(mysum$resid)/2, main='Residual Partial Autocorrelation Function')
grid()
dev.off()
bitmap(file='test8.png')
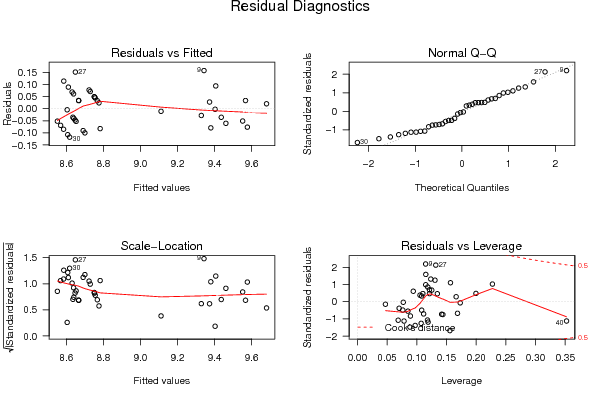
opar <- par(mfrow = c(2,2), oma = c(0, 0, 1.1, 0))
plot(mylm, las = 1, sub='Residual Diagnostics')
par(opar)
dev.off()
if (n > n25) {
bitmap(file='test9.png')
plot(kp3:nmkm3,gqarr[,2], main='Goldfeld-Quandt test',ylab='2-sided p-value',xlab='breakpoint')
grid()
dev.off()
}
load(file='createtable')
a<-table.start()
a<-table.row.start(a)
a<-table.element(a, 'Multiple Linear Regression - Estimated Regression Equation', 1, TRUE)
a<-table.row.end(a)
myeq <- colnames(x)[1]
myeq <- paste(myeq, '[t] = ', sep='')
for (i in 1:k){
if (mysum$coefficients[i,1] > 0) myeq <- paste(myeq, '+', '')
myeq <- paste(myeq, mysum$coefficients[i,1], sep=' ')
if (rownames(mysum$coefficients)[i] != '(Intercept)') {
myeq <- paste(myeq, rownames(mysum$coefficients)[i], sep='')
if (rownames(mysum$coefficients)[i] != 't') myeq <- paste(myeq, '[t]', sep='')
}
}
myeq <- paste(myeq, ' + e[t]')
a<-table.row.start(a)
a<-table.element(a, myeq)
a<-table.row.end(a)
a<-table.end(a)
table.save(a,file='mytable1.tab')
a<-table.start()
a<-table.row.start(a)
a<-table.element(a,hyperlink('ols1.htm','Multiple Linear Regression - Ordinary Least Squares',''), 6, TRUE)
a<-table.row.end(a)
a<-table.row.start(a)
a<-table.element(a,'Variable',header=TRUE)
a<-table.element(a,'Parameter',header=TRUE)
a<-table.element(a,'S.D.',header=TRUE)
a<-table.element(a,'T-STAT
H0: parameter = 0',header=TRUE)
a<-table.element(a,'2-tail p-value',header=TRUE)
a<-table.element(a,'1-tail p-value',header=TRUE)
a<-table.row.end(a)
for (i in 1:k){
a<-table.row.start(a)
a<-table.element(a,rownames(mysum$coefficients)[i],header=TRUE)
a<-table.element(a,mysum$coefficients[i,1])
a<-table.element(a, round(mysum$coefficients[i,2],6))
a<-table.element(a, round(mysum$coefficients[i,3],4))
a<-table.element(a, round(mysum$coefficients[i,4],6))
a<-table.element(a, round(mysum$coefficients[i,4]/2,6))
a<-table.row.end(a)
}
a<-table.end(a)
table.save(a,file='mytable2.tab')
a<-table.start()
a<-table.row.start(a)
a<-table.element(a, 'Multiple Linear Regression - Regression Statistics', 2, TRUE)
a<-table.row.end(a)
a<-table.row.start(a)
a<-table.element(a, 'Multiple R',1,TRUE)
a<-table.element(a, sqrt(mysum$r.squared))
a<-table.row.end(a)
a<-table.row.start(a)
a<-table.element(a, 'R-squared',1,TRUE)
a<-table.element(a, mysum$r.squared)
a<-table.row.end(a)
a<-table.row.start(a)
a<-table.element(a, 'Adjusted R-squared',1,TRUE)
a<-table.element(a, mysum$adj.r.squared)
a<-table.row.end(a)
a<-table.row.start(a)
a<-table.element(a, 'F-TEST (value)',1,TRUE)
a<-table.element(a, mysum$fstatistic[1])
a<-table.row.end(a)
a<-table.row.start(a)
a<-table.element(a, 'F-TEST (DF numerator)',1,TRUE)
a<-table.element(a, mysum$fstatistic[2])
a<-table.row.end(a)
a<-table.row.start(a)
a<-table.element(a, 'F-TEST (DF denominator)',1,TRUE)
a<-table.element(a, mysum$fstatistic[3])
a<-table.row.end(a)
a<-table.row.start(a)
a<-table.element(a, 'p-value',1,TRUE)
a<-table.element(a, 1-pf(mysum$fstatistic[1],mysum$fstatistic[2],mysum$fstatistic[3]))
a<-table.row.end(a)
a<-table.row.start(a)
a<-table.element(a, 'Multiple Linear Regression - Residual Statistics', 2, TRUE)
a<-table.row.end(a)
a<-table.row.start(a)
a<-table.element(a, 'Residual Standard Deviation',1,TRUE)
a<-table.element(a, mysum$sigma)
a<-table.row.end(a)
a<-table.row.start(a)
a<-table.element(a, 'Sum Squared Residuals',1,TRUE)
a<-table.element(a, sum(myerror*myerror))
a<-table.row.end(a)
a<-table.end(a)
table.save(a,file='mytable3.tab')
a<-table.start()
a<-table.row.start(a)
a<-table.element(a, 'Multiple Linear Regression - Actuals, Interpolation, and Residuals', 4, TRUE)
a<-table.row.end(a)
a<-table.row.start(a)
a<-table.element(a, 'Time or Index', 1, TRUE)
a<-table.element(a, 'Actuals', 1, TRUE)
a<-table.element(a, 'Interpolation
Forecast', 1, TRUE)
a<-table.element(a, 'Residuals
Prediction Error', 1, TRUE)
a<-table.row.end(a)
for (i in 1:n) {
a<-table.row.start(a)
a<-table.element(a,i, 1, TRUE)
a<-table.element(a,x[i])
a<-table.element(a,x[i]-mysum$resid[i])
a<-table.element(a,mysum$resid[i])
a<-table.row.end(a)
}
a<-table.end(a)
table.save(a,file='mytable4.tab')
if (n > n25) {
a<-table.start()
a<-table.row.start(a)
a<-table.element(a,'Goldfeld-Quandt test for Heteroskedasticity',4,TRUE)
a<-table.row.end(a)
a<-table.row.start(a)
a<-table.element(a,'p-values',header=TRUE)
a<-table.element(a,'Alternative Hypothesis',3,header=TRUE)
a<-table.row.end(a)
a<-table.row.start(a)
a<-table.element(a,'breakpoint index',header=TRUE)
a<-table.element(a,'greater',header=TRUE)
a<-table.element(a,'2-sided',header=TRUE)
a<-table.element(a,'less',header=TRUE)
a<-table.row.end(a)
for (mypoint in kp3:nmkm3) {
a<-table.row.start(a)
a<-table.element(a,mypoint,header=TRUE)
a<-table.element(a,gqarr[mypoint-kp3+1,1])
a<-table.element(a,gqarr[mypoint-kp3+1,2])
a<-table.element(a,gqarr[mypoint-kp3+1,3])
a<-table.row.end(a)
}
a<-table.end(a)
table.save(a,file='mytable5.tab')
a<-table.start()
a<-table.row.start(a)
a<-table.element(a,'Meta Analysis of Goldfeld-Quandt test for Heteroskedasticity',4,TRUE)
a<-table.row.end(a)
a<-table.row.start(a)
a<-table.element(a,'Description',header=TRUE)
a<-table.element(a,'# significant tests',header=TRUE)
a<-table.element(a,'% significant tests',header=TRUE)
a<-table.element(a,'OK/NOK',header=TRUE)
a<-table.row.end(a)
a<-table.row.start(a)
a<-table.element(a,'1% type I error level',header=TRUE)
a<-table.element(a,numsignificant1)
a<-table.element(a,numsignificant1/numgqtests)
if (numsignificant1/numgqtests < 0.01) dum <- 'OK' else dum <- 'NOK'
a<-table.element(a,dum)
a<-table.row.end(a)
a<-table.row.start(a)
a<-table.element(a,'5% type I error level',header=TRUE)
a<-table.element(a,numsignificant5)
a<-table.element(a,numsignificant5/numgqtests)
if (numsignificant5/numgqtests < 0.05) dum <- 'OK' else dum <- 'NOK'
a<-table.element(a,dum)
a<-table.row.end(a)
a<-table.row.start(a)
a<-table.element(a,'10% type I error level',header=TRUE)
a<-table.element(a,numsignificant10)
a<-table.element(a,numsignificant10/numgqtests)
if (numsignificant10/numgqtests < 0.1) dum <- 'OK' else dum <- 'NOK'
a<-table.element(a,dum)
a<-table.row.end(a)
a<-table.end(a)
table.save(a,file='mytable6.tab')
}