Free Statistics

of Irreproducible Research!

Author's title

Author*The author of this computation has been verified*
R Software Modulerwasp_multipleregression.wasp
Title produced by softwareMultiple Regression
Date of computationMon, 29 Nov 2010 20:13:48 +0000
Cite this page as followsStatistical Computations at FreeStatistics.org, Office for Research Development and Education, URL https://freestatistics.org/blog/index.php?v=date/2010/Nov/29/t1291061589vx4iub4jumvrxiq.htm/, Retrieved Fri, 01 Nov 2024 00:00:59 +0000
Statistical Computations at FreeStatistics.org, Office for Research Development and Education, URL https://freestatistics.org/blog/index.php?pk=103078, Retrieved Fri, 01 Nov 2024 00:00:59 +0000
QR Codes:

Original text written by user:
IsPrivate?No (this computation is public)
User-defined keywords
Estimated Impact197
Family? (F = Feedback message, R = changed R code, M = changed R Module, P = changed Parameters, D = changed Data)
-     [Multiple Regression] [HPC Retail Sales] [2008-03-08 13:40:54] [1c0f2c85e8a48e42648374b3bcceca26]
-  MPD    [Multiple Regression] [] [2010-11-29 20:13:48] [6b31f806e9ccc1f74a26091056f791cb] [Current]
Feedback Forum

Post a new message
Dataseries X:
9700
9081
9084
9743
8587
9731
9563
9998
9437
10038
9918
9252
9737
9035
9133
9487
8700
9627
8947
9283
8829
9947
9628
9318
9605
8640
9214
9567
8547
9185
9470
9123
9278
10170
9434
9655
9429
8739
9552
9687
9019
9672
9206
9069
9788
10312
10105
9863
9656
9295
9946
9701
9049
10190
9706
9765
9893
9994
10433
10073
10112
9266
9820
10097
9115
10411
9678
10408
10153
10368
10581
10597
10680
9738
9556


Summary of computational transaction
Raw Inputview raw input (R code)
Raw Outputview raw output of R engine
Computing time6 seconds
R Server'Gwilym Jenkins' @ 72.249.127.135

\begin{tabular}{lllllllll}
\hline
Summary of computational transaction \tabularnewline
Raw Input & view raw input (R code)  \tabularnewline
Raw Output & view raw output of R engine  \tabularnewline
Computing time & 6 seconds \tabularnewline
R Server & 'Gwilym Jenkins' @ 72.249.127.135 \tabularnewline
\hline
\end{tabular}
%Source: https://freestatistics.org/blog/index.php?pk=103078&T=0

[TABLE]
[ROW][C]Summary of computational transaction[/C][/ROW]
[ROW][C]Raw Input[/C][C]view raw input (R code) [/C][/ROW]
[ROW][C]Raw Output[/C][C]view raw output of R engine [/C][/ROW]
[ROW][C]Computing time[/C][C]6 seconds[/C][/ROW]
[ROW][C]R Server[/C][C]'Gwilym Jenkins' @ 72.249.127.135[/C][/ROW]
[/TABLE]
Source: https://freestatistics.org/blog/index.php?pk=103078&T=0

Globally Unique Identifier (entire table): ba.freestatistics.org/blog/index.php?pk=103078&T=0

As an alternative you can also use a QR Code:  

The GUIDs for individual cells are displayed in the table below:

Summary of computational transaction
Raw Inputview raw input (R code)
Raw Outputview raw output of R engine
Computing time6 seconds
R Server'Gwilym Jenkins' @ 72.249.127.135


Multiple Linear Regression - Estimated Regression Equation
HPC[t] = + 9330.58695652173 + 107.620600414070M1[t] -635.532091097307M2[t] -287.827639751553M3[t] + 8.74534161490713M4[t] -879.764492753622M5[t] + 75.7256728778468M6[t] -309.617494824016M7[t] -141.293995859213M8[t] -196.97049689441M9[t] + 367.186335403727M10[t] + 234.50983436853M11[t] + 11.0098343685301t + e[t]

\begin{tabular}{lllllllll}
\hline
Multiple Linear Regression - Estimated Regression Equation \tabularnewline
HPC[t] =  +  9330.58695652173 +  107.620600414070M1[t] -635.532091097307M2[t] -287.827639751553M3[t] +  8.74534161490713M4[t] -879.764492753622M5[t] +  75.7256728778468M6[t] -309.617494824016M7[t] -141.293995859213M8[t] -196.97049689441M9[t] +  367.186335403727M10[t] +  234.50983436853M11[t] +  11.0098343685301t  + e[t] \tabularnewline
\hline
\end{tabular}
%Source: https://freestatistics.org/blog/index.php?pk=103078&T=1

[TABLE]
[ROW][C]Multiple Linear Regression - Estimated Regression Equation[/C][/ROW]
[ROW][C]HPC[t] =  +  9330.58695652173 +  107.620600414070M1[t] -635.532091097307M2[t] -287.827639751553M3[t] +  8.74534161490713M4[t] -879.764492753622M5[t] +  75.7256728778468M6[t] -309.617494824016M7[t] -141.293995859213M8[t] -196.97049689441M9[t] +  367.186335403727M10[t] +  234.50983436853M11[t] +  11.0098343685301t  + e[t][/C][/ROW]
[/TABLE]
Source: https://freestatistics.org/blog/index.php?pk=103078&T=1

Globally Unique Identifier (entire table): ba.freestatistics.org/blog/index.php?pk=103078&T=1

As an alternative you can also use a QR Code:  

The GUIDs for individual cells are displayed in the table below:

Multiple Linear Regression - Estimated Regression Equation
HPC[t] = + 9330.58695652173 + 107.620600414070M1[t] -635.532091097307M2[t] -287.827639751553M3[t] + 8.74534161490713M4[t] -879.764492753622M5[t] + 75.7256728778468M6[t] -309.617494824016M7[t] -141.293995859213M8[t] -196.97049689441M9[t] + 367.186335403727M10[t] + 234.50983436853M11[t] + 11.0098343685301t + e[t]


Multiple Linear Regression - Ordinary Least Squares
VariableParameterS.D.T-STATH0: parameter = 02-tail p-value1-tail p-value
(Intercept)9330.58695652173136.43239768.389800
M1107.620600414070162.9848390.66030.51150.25575
M2-635.532091097307162.916845-3.9010.0002380.000119
M3-287.827639751553162.863941-1.76730.0821010.04105
M48.74534161490713169.4070110.05160.9589950.479497
M5-879.764492753622169.297972-5.19652e-061e-06
M675.7256728778468169.2034140.44750.6560430.328022
M7-309.617494824016169.123363-1.83070.0719490.035975
M8-141.293995859213169.057838-0.83580.4064920.203246
M9-196.97049689441169.006856-1.16550.2482980.124149
M10367.186335403727168.9704322.17310.0336040.016802
M11234.50983436853168.9485731.38810.1700880.085044
t11.00983436853011.5691227.016600

\begin{tabular}{lllllllll}
\hline
Multiple Linear Regression - Ordinary Least Squares \tabularnewline
Variable & Parameter & S.D. & T-STATH0: parameter = 0 & 2-tail p-value & 1-tail p-value \tabularnewline
(Intercept) & 9330.58695652173 & 136.432397 & 68.3898 & 0 & 0 \tabularnewline
M1 & 107.620600414070 & 162.984839 & 0.6603 & 0.5115 & 0.25575 \tabularnewline
M2 & -635.532091097307 & 162.916845 & -3.901 & 0.000238 & 0.000119 \tabularnewline
M3 & -287.827639751553 & 162.863941 & -1.7673 & 0.082101 & 0.04105 \tabularnewline
M4 & 8.74534161490713 & 169.407011 & 0.0516 & 0.958995 & 0.479497 \tabularnewline
M5 & -879.764492753622 & 169.297972 & -5.1965 & 2e-06 & 1e-06 \tabularnewline
M6 & 75.7256728778468 & 169.203414 & 0.4475 & 0.656043 & 0.328022 \tabularnewline
M7 & -309.617494824016 & 169.123363 & -1.8307 & 0.071949 & 0.035975 \tabularnewline
M8 & -141.293995859213 & 169.057838 & -0.8358 & 0.406492 & 0.203246 \tabularnewline
M9 & -196.97049689441 & 169.006856 & -1.1655 & 0.248298 & 0.124149 \tabularnewline
M10 & 367.186335403727 & 168.970432 & 2.1731 & 0.033604 & 0.016802 \tabularnewline
M11 & 234.50983436853 & 168.948573 & 1.3881 & 0.170088 & 0.085044 \tabularnewline
t & 11.0098343685301 & 1.569122 & 7.0166 & 0 & 0 \tabularnewline
\hline
\end{tabular}
%Source: https://freestatistics.org/blog/index.php?pk=103078&T=2

[TABLE]
[ROW][C]Multiple Linear Regression - Ordinary Least Squares[/C][/ROW]
[ROW][C]Variable[/C][C]Parameter[/C][C]S.D.[/C][C]T-STATH0: parameter = 0[/C][C]2-tail p-value[/C][C]1-tail p-value[/C][/ROW]
[ROW][C](Intercept)[/C][C]9330.58695652173[/C][C]136.432397[/C][C]68.3898[/C][C]0[/C][C]0[/C][/ROW]
[ROW][C]M1[/C][C]107.620600414070[/C][C]162.984839[/C][C]0.6603[/C][C]0.5115[/C][C]0.25575[/C][/ROW]
[ROW][C]M2[/C][C]-635.532091097307[/C][C]162.916845[/C][C]-3.901[/C][C]0.000238[/C][C]0.000119[/C][/ROW]
[ROW][C]M3[/C][C]-287.827639751553[/C][C]162.863941[/C][C]-1.7673[/C][C]0.082101[/C][C]0.04105[/C][/ROW]
[ROW][C]M4[/C][C]8.74534161490713[/C][C]169.407011[/C][C]0.0516[/C][C]0.958995[/C][C]0.479497[/C][/ROW]
[ROW][C]M5[/C][C]-879.764492753622[/C][C]169.297972[/C][C]-5.1965[/C][C]2e-06[/C][C]1e-06[/C][/ROW]
[ROW][C]M6[/C][C]75.7256728778468[/C][C]169.203414[/C][C]0.4475[/C][C]0.656043[/C][C]0.328022[/C][/ROW]
[ROW][C]M7[/C][C]-309.617494824016[/C][C]169.123363[/C][C]-1.8307[/C][C]0.071949[/C][C]0.035975[/C][/ROW]
[ROW][C]M8[/C][C]-141.293995859213[/C][C]169.057838[/C][C]-0.8358[/C][C]0.406492[/C][C]0.203246[/C][/ROW]
[ROW][C]M9[/C][C]-196.97049689441[/C][C]169.006856[/C][C]-1.1655[/C][C]0.248298[/C][C]0.124149[/C][/ROW]
[ROW][C]M10[/C][C]367.186335403727[/C][C]168.970432[/C][C]2.1731[/C][C]0.033604[/C][C]0.016802[/C][/ROW]
[ROW][C]M11[/C][C]234.50983436853[/C][C]168.948573[/C][C]1.3881[/C][C]0.170088[/C][C]0.085044[/C][/ROW]
[ROW][C]t[/C][C]11.0098343685301[/C][C]1.569122[/C][C]7.0166[/C][C]0[/C][C]0[/C][/ROW]
[/TABLE]
Source: https://freestatistics.org/blog/index.php?pk=103078&T=2

Globally Unique Identifier (entire table): ba.freestatistics.org/blog/index.php?pk=103078&T=2

As an alternative you can also use a QR Code:  

The GUIDs for individual cells are displayed in the table below:

Multiple Linear Regression - Ordinary Least Squares
VariableParameterS.D.T-STATH0: parameter = 02-tail p-value1-tail p-value
(Intercept)9330.58695652173136.43239768.389800
M1107.620600414070162.9848390.66030.51150.25575
M2-635.532091097307162.916845-3.9010.0002380.000119
M3-287.827639751553162.863941-1.76730.0821010.04105
M48.74534161490713169.4070110.05160.9589950.479497
M5-879.764492753622169.297972-5.19652e-061e-06
M675.7256728778468169.2034140.44750.6560430.328022
M7-309.617494824016169.123363-1.83070.0719490.035975
M8-141.293995859213169.057838-0.83580.4064920.203246
M9-196.97049689441169.006856-1.16550.2482980.124149
M10367.186335403727168.9704322.17310.0336040.016802
M11234.50983436853168.9485731.38810.1700880.085044
t11.00983436853011.5691227.016600


Multiple Linear Regression - Regression Statistics
Multiple R0.846483642463992
R-squared0.716534556959108
Adjusted R-squared0.66167027766087
F-TEST (value)13.0601288511254
F-TEST (DF numerator)12
F-TEST (DF denominator)62
p-value8.07798272717264e-13
Multiple Linear Regression - Residual Statistics
Residual Standard Deviation292.614891203775
Sum Squared Residuals5308655.42236022

\begin{tabular}{lllllllll}
\hline
Multiple Linear Regression - Regression Statistics \tabularnewline
Multiple R & 0.846483642463992 \tabularnewline
R-squared & 0.716534556959108 \tabularnewline
Adjusted R-squared & 0.66167027766087 \tabularnewline
F-TEST (value) & 13.0601288511254 \tabularnewline
F-TEST (DF numerator) & 12 \tabularnewline
F-TEST (DF denominator) & 62 \tabularnewline
p-value & 8.07798272717264e-13 \tabularnewline
Multiple Linear Regression - Residual Statistics \tabularnewline
Residual Standard Deviation & 292.614891203775 \tabularnewline
Sum Squared Residuals & 5308655.42236022 \tabularnewline
\hline
\end{tabular}
%Source: https://freestatistics.org/blog/index.php?pk=103078&T=3

[TABLE]
[ROW][C]Multiple Linear Regression - Regression Statistics[/C][/ROW]
[ROW][C]Multiple R[/C][C]0.846483642463992[/C][/ROW]
[ROW][C]R-squared[/C][C]0.716534556959108[/C][/ROW]
[ROW][C]Adjusted R-squared[/C][C]0.66167027766087[/C][/ROW]
[ROW][C]F-TEST (value)[/C][C]13.0601288511254[/C][/ROW]
[ROW][C]F-TEST (DF numerator)[/C][C]12[/C][/ROW]
[ROW][C]F-TEST (DF denominator)[/C][C]62[/C][/ROW]
[ROW][C]p-value[/C][C]8.07798272717264e-13[/C][/ROW]
[ROW][C]Multiple Linear Regression - Residual Statistics[/C][/ROW]
[ROW][C]Residual Standard Deviation[/C][C]292.614891203775[/C][/ROW]
[ROW][C]Sum Squared Residuals[/C][C]5308655.42236022[/C][/ROW]
[/TABLE]
Source: https://freestatistics.org/blog/index.php?pk=103078&T=3

Globally Unique Identifier (entire table): ba.freestatistics.org/blog/index.php?pk=103078&T=3

As an alternative you can also use a QR Code:  

The GUIDs for individual cells are displayed in the table below:

Multiple Linear Regression - Regression Statistics
Multiple R0.846483642463992
R-squared0.716534556959108
Adjusted R-squared0.66167027766087
F-TEST (value)13.0601288511254
F-TEST (DF numerator)12
F-TEST (DF denominator)62
p-value8.07798272717264e-13
Multiple Linear Regression - Residual Statistics
Residual Standard Deviation292.614891203775
Sum Squared Residuals5308655.42236022


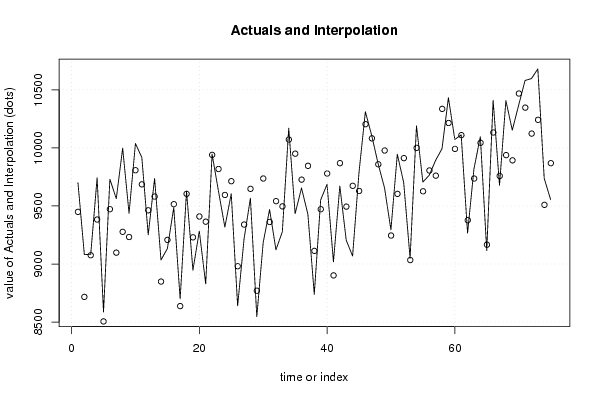
Multiple Linear Regression - Actuals, Interpolation, and Residuals
Time or IndexActualsInterpolationForecastResidualsPrediction Error
197009449.2173913044250.782608695602
290818717.07453416149363.925465838513
390849075.788819875788.21118012422518
497439383.37163561076359.628364389236
585878505.8716356107681.1283643892363
697319472.37163561077258.628364389234
795639098.03830227743464.961697722569
899989277.37163561076720.628364389236
994379232.7049689441204.295031055902
10100389807.87163561076230.128364389236
1199189686.2049689441231.795031055902
1292529462.7049689441-210.704968944098
1397379581.3354037267155.664596273302
1490358849.19254658385185.80745341615
1591339207.90683229813-74.906832298135
1694879515.48964803312-28.4896480331252
1787008637.9896480331262.0103519668749
1896279604.4896480331222.5103519668751
1989479230.1563146998-283.156314699792
2092839409.48964803312-126.489648033125
2188299364.82298136646-535.822981366459
2299479939.989648033127.01035196687472
2396289818.32298136646-190.322981366459
2493189594.82298136646-276.822981366458
2596059713.45341614906-108.453416149059
2686408981.31055900621-341.310559006211
2792149340.0248447205-126.024844720496
2895679647.60766045549-80.6076604554861
2985478770.10766045549-223.107660455486
3091859736.60766045549-551.607660455486
3194709362.27432712215107.725672877847
3291239541.60766045549-418.607660455486
3392789496.94099378882-218.940993788820
341017010072.107660455597.8923395445138
3594349950.44099378882-516.44099378882
3696559726.94099378882-71.9409937888195
3794299845.57142857142-416.57142857142
3887399113.42857142857-374.428571428572
3995529472.1428571428679.857142857143
4096879779.72567287785-92.725672877847
4190198902.22567287785116.774327122153
4296729868.72567287785-196.725672877847
4392069494.39233954451-288.392339544514
4490699673.72567287785-604.725672877847
4597889629.05900621118158.940993788820
461031210204.2256728778107.774327122153
471010510082.559006211222.4409937888195
4898639859.059006211183.94099378881948
4996569977.68944099378-321.689440993781
5092959245.5465838509349.4534161490671
5199469604.26086956522341.739130434782
5297019911.8436853002-210.843685300208
5390499034.343685300214.6563146997918
541019010000.8436853002189.156314699792
5597069626.5103519668879.489648033125
5697659805.8436853002-40.843685300208
5798939761.17701863354131.822981366458
58999410336.3436853002-342.343685300208
591043310214.6770186335218.322981366459
60100739991.1770186335481.8229813664584
611011210109.80745341612.192546583858
6292669377.6645962733-111.664596273294
6398209736.3788819875883.621118012421
641009710043.961697722653.0383022774308
6591159166.46169772257-51.4616977225691
661041110132.9616977226278.038302277431
6796789758.62836438924-80.628364389236
68104089937.96169772257470.038302277431
69101539893.2950310559259.704968944098
701036810468.4616977226-100.461697722569
711058110346.7950310559234.204968944098
721059710123.2950310559473.704968944098
731068010241.9254658385438.074534161497
7497389509.78260869566228.217391304345
7595569868.49689440994-312.49689440994

\begin{tabular}{lllllllll}
\hline
Multiple Linear Regression - Actuals, Interpolation, and Residuals \tabularnewline
Time or Index & Actuals & InterpolationForecast & ResidualsPrediction Error \tabularnewline
1 & 9700 & 9449.2173913044 & 250.782608695602 \tabularnewline
2 & 9081 & 8717.07453416149 & 363.925465838513 \tabularnewline
3 & 9084 & 9075.78881987578 & 8.21118012422518 \tabularnewline
4 & 9743 & 9383.37163561076 & 359.628364389236 \tabularnewline
5 & 8587 & 8505.87163561076 & 81.1283643892363 \tabularnewline
6 & 9731 & 9472.37163561077 & 258.628364389234 \tabularnewline
7 & 9563 & 9098.03830227743 & 464.961697722569 \tabularnewline
8 & 9998 & 9277.37163561076 & 720.628364389236 \tabularnewline
9 & 9437 & 9232.7049689441 & 204.295031055902 \tabularnewline
10 & 10038 & 9807.87163561076 & 230.128364389236 \tabularnewline
11 & 9918 & 9686.2049689441 & 231.795031055902 \tabularnewline
12 & 9252 & 9462.7049689441 & -210.704968944098 \tabularnewline
13 & 9737 & 9581.3354037267 & 155.664596273302 \tabularnewline
14 & 9035 & 8849.19254658385 & 185.80745341615 \tabularnewline
15 & 9133 & 9207.90683229813 & -74.906832298135 \tabularnewline
16 & 9487 & 9515.48964803312 & -28.4896480331252 \tabularnewline
17 & 8700 & 8637.98964803312 & 62.0103519668749 \tabularnewline
18 & 9627 & 9604.48964803312 & 22.5103519668751 \tabularnewline
19 & 8947 & 9230.1563146998 & -283.156314699792 \tabularnewline
20 & 9283 & 9409.48964803312 & -126.489648033125 \tabularnewline
21 & 8829 & 9364.82298136646 & -535.822981366459 \tabularnewline
22 & 9947 & 9939.98964803312 & 7.01035196687472 \tabularnewline
23 & 9628 & 9818.32298136646 & -190.322981366459 \tabularnewline
24 & 9318 & 9594.82298136646 & -276.822981366458 \tabularnewline
25 & 9605 & 9713.45341614906 & -108.453416149059 \tabularnewline
26 & 8640 & 8981.31055900621 & -341.310559006211 \tabularnewline
27 & 9214 & 9340.0248447205 & -126.024844720496 \tabularnewline
28 & 9567 & 9647.60766045549 & -80.6076604554861 \tabularnewline
29 & 8547 & 8770.10766045549 & -223.107660455486 \tabularnewline
30 & 9185 & 9736.60766045549 & -551.607660455486 \tabularnewline
31 & 9470 & 9362.27432712215 & 107.725672877847 \tabularnewline
32 & 9123 & 9541.60766045549 & -418.607660455486 \tabularnewline
33 & 9278 & 9496.94099378882 & -218.940993788820 \tabularnewline
34 & 10170 & 10072.1076604555 & 97.8923395445138 \tabularnewline
35 & 9434 & 9950.44099378882 & -516.44099378882 \tabularnewline
36 & 9655 & 9726.94099378882 & -71.9409937888195 \tabularnewline
37 & 9429 & 9845.57142857142 & -416.57142857142 \tabularnewline
38 & 8739 & 9113.42857142857 & -374.428571428572 \tabularnewline
39 & 9552 & 9472.14285714286 & 79.857142857143 \tabularnewline
40 & 9687 & 9779.72567287785 & -92.725672877847 \tabularnewline
41 & 9019 & 8902.22567287785 & 116.774327122153 \tabularnewline
42 & 9672 & 9868.72567287785 & -196.725672877847 \tabularnewline
43 & 9206 & 9494.39233954451 & -288.392339544514 \tabularnewline
44 & 9069 & 9673.72567287785 & -604.725672877847 \tabularnewline
45 & 9788 & 9629.05900621118 & 158.940993788820 \tabularnewline
46 & 10312 & 10204.2256728778 & 107.774327122153 \tabularnewline
47 & 10105 & 10082.5590062112 & 22.4409937888195 \tabularnewline
48 & 9863 & 9859.05900621118 & 3.94099378881948 \tabularnewline
49 & 9656 & 9977.68944099378 & -321.689440993781 \tabularnewline
50 & 9295 & 9245.54658385093 & 49.4534161490671 \tabularnewline
51 & 9946 & 9604.26086956522 & 341.739130434782 \tabularnewline
52 & 9701 & 9911.8436853002 & -210.843685300208 \tabularnewline
53 & 9049 & 9034.3436853002 & 14.6563146997918 \tabularnewline
54 & 10190 & 10000.8436853002 & 189.156314699792 \tabularnewline
55 & 9706 & 9626.51035196688 & 79.489648033125 \tabularnewline
56 & 9765 & 9805.8436853002 & -40.843685300208 \tabularnewline
57 & 9893 & 9761.17701863354 & 131.822981366458 \tabularnewline
58 & 9994 & 10336.3436853002 & -342.343685300208 \tabularnewline
59 & 10433 & 10214.6770186335 & 218.322981366459 \tabularnewline
60 & 10073 & 9991.17701863354 & 81.8229813664584 \tabularnewline
61 & 10112 & 10109.8074534161 & 2.192546583858 \tabularnewline
62 & 9266 & 9377.6645962733 & -111.664596273294 \tabularnewline
63 & 9820 & 9736.37888198758 & 83.621118012421 \tabularnewline
64 & 10097 & 10043.9616977226 & 53.0383022774308 \tabularnewline
65 & 9115 & 9166.46169772257 & -51.4616977225691 \tabularnewline
66 & 10411 & 10132.9616977226 & 278.038302277431 \tabularnewline
67 & 9678 & 9758.62836438924 & -80.628364389236 \tabularnewline
68 & 10408 & 9937.96169772257 & 470.038302277431 \tabularnewline
69 & 10153 & 9893.2950310559 & 259.704968944098 \tabularnewline
70 & 10368 & 10468.4616977226 & -100.461697722569 \tabularnewline
71 & 10581 & 10346.7950310559 & 234.204968944098 \tabularnewline
72 & 10597 & 10123.2950310559 & 473.704968944098 \tabularnewline
73 & 10680 & 10241.9254658385 & 438.074534161497 \tabularnewline
74 & 9738 & 9509.78260869566 & 228.217391304345 \tabularnewline
75 & 9556 & 9868.49689440994 & -312.49689440994 \tabularnewline
\hline
\end{tabular}
%Source: https://freestatistics.org/blog/index.php?pk=103078&T=4

[TABLE]
[ROW][C]Multiple Linear Regression - Actuals, Interpolation, and Residuals[/C][/ROW]
[ROW][C]Time or Index[/C][C]Actuals[/C][C]InterpolationForecast[/C][C]ResidualsPrediction Error[/C][/ROW]
[ROW][C]1[/C][C]9700[/C][C]9449.2173913044[/C][C]250.782608695602[/C][/ROW]
[ROW][C]2[/C][C]9081[/C][C]8717.07453416149[/C][C]363.925465838513[/C][/ROW]
[ROW][C]3[/C][C]9084[/C][C]9075.78881987578[/C][C]8.21118012422518[/C][/ROW]
[ROW][C]4[/C][C]9743[/C][C]9383.37163561076[/C][C]359.628364389236[/C][/ROW]
[ROW][C]5[/C][C]8587[/C][C]8505.87163561076[/C][C]81.1283643892363[/C][/ROW]
[ROW][C]6[/C][C]9731[/C][C]9472.37163561077[/C][C]258.628364389234[/C][/ROW]
[ROW][C]7[/C][C]9563[/C][C]9098.03830227743[/C][C]464.961697722569[/C][/ROW]
[ROW][C]8[/C][C]9998[/C][C]9277.37163561076[/C][C]720.628364389236[/C][/ROW]
[ROW][C]9[/C][C]9437[/C][C]9232.7049689441[/C][C]204.295031055902[/C][/ROW]
[ROW][C]10[/C][C]10038[/C][C]9807.87163561076[/C][C]230.128364389236[/C][/ROW]
[ROW][C]11[/C][C]9918[/C][C]9686.2049689441[/C][C]231.795031055902[/C][/ROW]
[ROW][C]12[/C][C]9252[/C][C]9462.7049689441[/C][C]-210.704968944098[/C][/ROW]
[ROW][C]13[/C][C]9737[/C][C]9581.3354037267[/C][C]155.664596273302[/C][/ROW]
[ROW][C]14[/C][C]9035[/C][C]8849.19254658385[/C][C]185.80745341615[/C][/ROW]
[ROW][C]15[/C][C]9133[/C][C]9207.90683229813[/C][C]-74.906832298135[/C][/ROW]
[ROW][C]16[/C][C]9487[/C][C]9515.48964803312[/C][C]-28.4896480331252[/C][/ROW]
[ROW][C]17[/C][C]8700[/C][C]8637.98964803312[/C][C]62.0103519668749[/C][/ROW]
[ROW][C]18[/C][C]9627[/C][C]9604.48964803312[/C][C]22.5103519668751[/C][/ROW]
[ROW][C]19[/C][C]8947[/C][C]9230.1563146998[/C][C]-283.156314699792[/C][/ROW]
[ROW][C]20[/C][C]9283[/C][C]9409.48964803312[/C][C]-126.489648033125[/C][/ROW]
[ROW][C]21[/C][C]8829[/C][C]9364.82298136646[/C][C]-535.822981366459[/C][/ROW]
[ROW][C]22[/C][C]9947[/C][C]9939.98964803312[/C][C]7.01035196687472[/C][/ROW]
[ROW][C]23[/C][C]9628[/C][C]9818.32298136646[/C][C]-190.322981366459[/C][/ROW]
[ROW][C]24[/C][C]9318[/C][C]9594.82298136646[/C][C]-276.822981366458[/C][/ROW]
[ROW][C]25[/C][C]9605[/C][C]9713.45341614906[/C][C]-108.453416149059[/C][/ROW]
[ROW][C]26[/C][C]8640[/C][C]8981.31055900621[/C][C]-341.310559006211[/C][/ROW]
[ROW][C]27[/C][C]9214[/C][C]9340.0248447205[/C][C]-126.024844720496[/C][/ROW]
[ROW][C]28[/C][C]9567[/C][C]9647.60766045549[/C][C]-80.6076604554861[/C][/ROW]
[ROW][C]29[/C][C]8547[/C][C]8770.10766045549[/C][C]-223.107660455486[/C][/ROW]
[ROW][C]30[/C][C]9185[/C][C]9736.60766045549[/C][C]-551.607660455486[/C][/ROW]
[ROW][C]31[/C][C]9470[/C][C]9362.27432712215[/C][C]107.725672877847[/C][/ROW]
[ROW][C]32[/C][C]9123[/C][C]9541.60766045549[/C][C]-418.607660455486[/C][/ROW]
[ROW][C]33[/C][C]9278[/C][C]9496.94099378882[/C][C]-218.940993788820[/C][/ROW]
[ROW][C]34[/C][C]10170[/C][C]10072.1076604555[/C][C]97.8923395445138[/C][/ROW]
[ROW][C]35[/C][C]9434[/C][C]9950.44099378882[/C][C]-516.44099378882[/C][/ROW]
[ROW][C]36[/C][C]9655[/C][C]9726.94099378882[/C][C]-71.9409937888195[/C][/ROW]
[ROW][C]37[/C][C]9429[/C][C]9845.57142857142[/C][C]-416.57142857142[/C][/ROW]
[ROW][C]38[/C][C]8739[/C][C]9113.42857142857[/C][C]-374.428571428572[/C][/ROW]
[ROW][C]39[/C][C]9552[/C][C]9472.14285714286[/C][C]79.857142857143[/C][/ROW]
[ROW][C]40[/C][C]9687[/C][C]9779.72567287785[/C][C]-92.725672877847[/C][/ROW]
[ROW][C]41[/C][C]9019[/C][C]8902.22567287785[/C][C]116.774327122153[/C][/ROW]
[ROW][C]42[/C][C]9672[/C][C]9868.72567287785[/C][C]-196.725672877847[/C][/ROW]
[ROW][C]43[/C][C]9206[/C][C]9494.39233954451[/C][C]-288.392339544514[/C][/ROW]
[ROW][C]44[/C][C]9069[/C][C]9673.72567287785[/C][C]-604.725672877847[/C][/ROW]
[ROW][C]45[/C][C]9788[/C][C]9629.05900621118[/C][C]158.940993788820[/C][/ROW]
[ROW][C]46[/C][C]10312[/C][C]10204.2256728778[/C][C]107.774327122153[/C][/ROW]
[ROW][C]47[/C][C]10105[/C][C]10082.5590062112[/C][C]22.4409937888195[/C][/ROW]
[ROW][C]48[/C][C]9863[/C][C]9859.05900621118[/C][C]3.94099378881948[/C][/ROW]
[ROW][C]49[/C][C]9656[/C][C]9977.68944099378[/C][C]-321.689440993781[/C][/ROW]
[ROW][C]50[/C][C]9295[/C][C]9245.54658385093[/C][C]49.4534161490671[/C][/ROW]
[ROW][C]51[/C][C]9946[/C][C]9604.26086956522[/C][C]341.739130434782[/C][/ROW]
[ROW][C]52[/C][C]9701[/C][C]9911.8436853002[/C][C]-210.843685300208[/C][/ROW]
[ROW][C]53[/C][C]9049[/C][C]9034.3436853002[/C][C]14.6563146997918[/C][/ROW]
[ROW][C]54[/C][C]10190[/C][C]10000.8436853002[/C][C]189.156314699792[/C][/ROW]
[ROW][C]55[/C][C]9706[/C][C]9626.51035196688[/C][C]79.489648033125[/C][/ROW]
[ROW][C]56[/C][C]9765[/C][C]9805.8436853002[/C][C]-40.843685300208[/C][/ROW]
[ROW][C]57[/C][C]9893[/C][C]9761.17701863354[/C][C]131.822981366458[/C][/ROW]
[ROW][C]58[/C][C]9994[/C][C]10336.3436853002[/C][C]-342.343685300208[/C][/ROW]
[ROW][C]59[/C][C]10433[/C][C]10214.6770186335[/C][C]218.322981366459[/C][/ROW]
[ROW][C]60[/C][C]10073[/C][C]9991.17701863354[/C][C]81.8229813664584[/C][/ROW]
[ROW][C]61[/C][C]10112[/C][C]10109.8074534161[/C][C]2.192546583858[/C][/ROW]
[ROW][C]62[/C][C]9266[/C][C]9377.6645962733[/C][C]-111.664596273294[/C][/ROW]
[ROW][C]63[/C][C]9820[/C][C]9736.37888198758[/C][C]83.621118012421[/C][/ROW]
[ROW][C]64[/C][C]10097[/C][C]10043.9616977226[/C][C]53.0383022774308[/C][/ROW]
[ROW][C]65[/C][C]9115[/C][C]9166.46169772257[/C][C]-51.4616977225691[/C][/ROW]
[ROW][C]66[/C][C]10411[/C][C]10132.9616977226[/C][C]278.038302277431[/C][/ROW]
[ROW][C]67[/C][C]9678[/C][C]9758.62836438924[/C][C]-80.628364389236[/C][/ROW]
[ROW][C]68[/C][C]10408[/C][C]9937.96169772257[/C][C]470.038302277431[/C][/ROW]
[ROW][C]69[/C][C]10153[/C][C]9893.2950310559[/C][C]259.704968944098[/C][/ROW]
[ROW][C]70[/C][C]10368[/C][C]10468.4616977226[/C][C]-100.461697722569[/C][/ROW]
[ROW][C]71[/C][C]10581[/C][C]10346.7950310559[/C][C]234.204968944098[/C][/ROW]
[ROW][C]72[/C][C]10597[/C][C]10123.2950310559[/C][C]473.704968944098[/C][/ROW]
[ROW][C]73[/C][C]10680[/C][C]10241.9254658385[/C][C]438.074534161497[/C][/ROW]
[ROW][C]74[/C][C]9738[/C][C]9509.78260869566[/C][C]228.217391304345[/C][/ROW]
[ROW][C]75[/C][C]9556[/C][C]9868.49689440994[/C][C]-312.49689440994[/C][/ROW]
[/TABLE]
Source: https://freestatistics.org/blog/index.php?pk=103078&T=4

Globally Unique Identifier (entire table): ba.freestatistics.org/blog/index.php?pk=103078&T=4

As an alternative you can also use a QR Code:  

The GUIDs for individual cells are displayed in the table below:

Multiple Linear Regression - Actuals, Interpolation, and Residuals
Time or IndexActualsInterpolationForecastResidualsPrediction Error
197009449.2173913044250.782608695602
290818717.07453416149363.925465838513
390849075.788819875788.21118012422518
497439383.37163561076359.628364389236
585878505.8716356107681.1283643892363
697319472.37163561077258.628364389234
795639098.03830227743464.961697722569
899989277.37163561076720.628364389236
994379232.7049689441204.295031055902
10100389807.87163561076230.128364389236
1199189686.2049689441231.795031055902
1292529462.7049689441-210.704968944098
1397379581.3354037267155.664596273302
1490358849.19254658385185.80745341615
1591339207.90683229813-74.906832298135
1694879515.48964803312-28.4896480331252
1787008637.9896480331262.0103519668749
1896279604.4896480331222.5103519668751
1989479230.1563146998-283.156314699792
2092839409.48964803312-126.489648033125
2188299364.82298136646-535.822981366459
2299479939.989648033127.01035196687472
2396289818.32298136646-190.322981366459
2493189594.82298136646-276.822981366458
2596059713.45341614906-108.453416149059
2686408981.31055900621-341.310559006211
2792149340.0248447205-126.024844720496
2895679647.60766045549-80.6076604554861
2985478770.10766045549-223.107660455486
3091859736.60766045549-551.607660455486
3194709362.27432712215107.725672877847
3291239541.60766045549-418.607660455486
3392789496.94099378882-218.940993788820
341017010072.107660455597.8923395445138
3594349950.44099378882-516.44099378882
3696559726.94099378882-71.9409937888195
3794299845.57142857142-416.57142857142
3887399113.42857142857-374.428571428572
3995529472.1428571428679.857142857143
4096879779.72567287785-92.725672877847
4190198902.22567287785116.774327122153
4296729868.72567287785-196.725672877847
4392069494.39233954451-288.392339544514
4490699673.72567287785-604.725672877847
4597889629.05900621118158.940993788820
461031210204.2256728778107.774327122153
471010510082.559006211222.4409937888195
4898639859.059006211183.94099378881948
4996569977.68944099378-321.689440993781
5092959245.5465838509349.4534161490671
5199469604.26086956522341.739130434782
5297019911.8436853002-210.843685300208
5390499034.343685300214.6563146997918
541019010000.8436853002189.156314699792
5597069626.5103519668879.489648033125
5697659805.8436853002-40.843685300208
5798939761.17701863354131.822981366458
58999410336.3436853002-342.343685300208
591043310214.6770186335218.322981366459
60100739991.1770186335481.8229813664584
611011210109.80745341612.192546583858
6292669377.6645962733-111.664596273294
6398209736.3788819875883.621118012421
641009710043.961697722653.0383022774308
6591159166.46169772257-51.4616977225691
661041110132.9616977226278.038302277431
6796789758.62836438924-80.628364389236
68104089937.96169772257470.038302277431
69101539893.2950310559259.704968944098
701036810468.4616977226-100.461697722569
711058110346.7950310559234.204968944098
721059710123.2950310559473.704968944098
731068010241.9254658385438.074534161497
7497389509.78260869566228.217391304345
7595569868.49689440994-312.49689440994


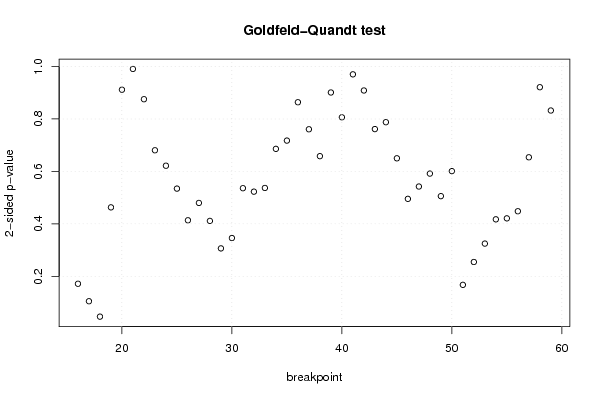
Goldfeld-Quandt test for Heteroskedasticity
p-valuesAlternative Hypothesis
breakpoint indexgreater2-sidedless
160.08579503247803010.1715900649560600.91420496752197
170.05249914236284800.1049982847256960.947500857637152
180.02310439656674760.04620879313349520.976895603433252
190.2314952102197720.4629904204395440.768504789780228
200.4557925362952230.9115850725904470.544207463704777
210.5046248547684870.9907502904630260.495375145231513
220.4376776662035570.8753553324071130.562322333796443
230.3403518716684380.6807037433368760.659648128331562
240.3108558602280030.6217117204560050.689144139771997
250.2672363368810960.5344726737621920.732763663118904
260.2068498832567920.4136997665135840.793150116743208
270.239916252646910.479832505293820.76008374735309
280.2056314547101590.4112629094203170.794368545289841
290.1532689585733150.306537917146630.846731041426685
300.1730084614320780.3460169228641550.826991538567923
310.2680029981810820.5360059963621650.731997001818918
320.2614164209755390.5228328419510770.738583579024461
330.2684589160334270.5369178320668550.731541083966573
340.3429951291659330.6859902583318660.657004870834067
350.3587736747274710.7175473494549420.641226325272529
360.4319057185873520.8638114371747040.568094281412648
370.3803629450068040.7607258900136090.619637054993196
380.3291008768387070.6582017536774130.670899123161293
390.4505050033159060.9010100066318130.549494996684094
400.4031901999959830.8063803999919660.596809800004017
410.4850941277350230.9701882554700470.514905872264977
420.4543171020715910.9086342041431820.545682897928409
430.3807562718644540.7615125437289080.619243728135546
440.6061268541454760.7877462917090480.393873145854524
450.6749967690605780.6500064618788450.325003230939422
460.7522907682633550.495418463473290.247709231736645
470.7288119200816730.5423761598366540.271188079918327
480.7041387281107250.591722543778550.295861271889275
490.747126825580550.50574634883890.25287317441945
500.6994219913515210.6011560172969580.300578008648479
510.9162245616856150.1675508766287700.0837754383143848
520.8726870594305420.2546258811389160.127312940569458
530.83758669320.3248266136000010.162413306800001
540.7913207126358070.4173585747283860.208679287364193
550.7894838579562980.4210322840874040.210516142043702
560.7759253356027740.4481493287944520.224074664397226
570.6730586411975140.6538827176049730.326941358802486
580.5394523088143480.9210953823713040.460547691185652
590.4161104422446240.8322208844892490.583889557755376

\begin{tabular}{lllllllll}
\hline
Goldfeld-Quandt test for Heteroskedasticity \tabularnewline
p-values & Alternative Hypothesis \tabularnewline
breakpoint index & greater & 2-sided & less \tabularnewline
16 & 0.0857950324780301 & 0.171590064956060 & 0.91420496752197 \tabularnewline
17 & 0.0524991423628480 & 0.104998284725696 & 0.947500857637152 \tabularnewline
18 & 0.0231043965667476 & 0.0462087931334952 & 0.976895603433252 \tabularnewline
19 & 0.231495210219772 & 0.462990420439544 & 0.768504789780228 \tabularnewline
20 & 0.455792536295223 & 0.911585072590447 & 0.544207463704777 \tabularnewline
21 & 0.504624854768487 & 0.990750290463026 & 0.495375145231513 \tabularnewline
22 & 0.437677666203557 & 0.875355332407113 & 0.562322333796443 \tabularnewline
23 & 0.340351871668438 & 0.680703743336876 & 0.659648128331562 \tabularnewline
24 & 0.310855860228003 & 0.621711720456005 & 0.689144139771997 \tabularnewline
25 & 0.267236336881096 & 0.534472673762192 & 0.732763663118904 \tabularnewline
26 & 0.206849883256792 & 0.413699766513584 & 0.793150116743208 \tabularnewline
27 & 0.23991625264691 & 0.47983250529382 & 0.76008374735309 \tabularnewline
28 & 0.205631454710159 & 0.411262909420317 & 0.794368545289841 \tabularnewline
29 & 0.153268958573315 & 0.30653791714663 & 0.846731041426685 \tabularnewline
30 & 0.173008461432078 & 0.346016922864155 & 0.826991538567923 \tabularnewline
31 & 0.268002998181082 & 0.536005996362165 & 0.731997001818918 \tabularnewline
32 & 0.261416420975539 & 0.522832841951077 & 0.738583579024461 \tabularnewline
33 & 0.268458916033427 & 0.536917832066855 & 0.731541083966573 \tabularnewline
34 & 0.342995129165933 & 0.685990258331866 & 0.657004870834067 \tabularnewline
35 & 0.358773674727471 & 0.717547349454942 & 0.641226325272529 \tabularnewline
36 & 0.431905718587352 & 0.863811437174704 & 0.568094281412648 \tabularnewline
37 & 0.380362945006804 & 0.760725890013609 & 0.619637054993196 \tabularnewline
38 & 0.329100876838707 & 0.658201753677413 & 0.670899123161293 \tabularnewline
39 & 0.450505003315906 & 0.901010006631813 & 0.549494996684094 \tabularnewline
40 & 0.403190199995983 & 0.806380399991966 & 0.596809800004017 \tabularnewline
41 & 0.485094127735023 & 0.970188255470047 & 0.514905872264977 \tabularnewline
42 & 0.454317102071591 & 0.908634204143182 & 0.545682897928409 \tabularnewline
43 & 0.380756271864454 & 0.761512543728908 & 0.619243728135546 \tabularnewline
44 & 0.606126854145476 & 0.787746291709048 & 0.393873145854524 \tabularnewline
45 & 0.674996769060578 & 0.650006461878845 & 0.325003230939422 \tabularnewline
46 & 0.752290768263355 & 0.49541846347329 & 0.247709231736645 \tabularnewline
47 & 0.728811920081673 & 0.542376159836654 & 0.271188079918327 \tabularnewline
48 & 0.704138728110725 & 0.59172254377855 & 0.295861271889275 \tabularnewline
49 & 0.74712682558055 & 0.5057463488389 & 0.25287317441945 \tabularnewline
50 & 0.699421991351521 & 0.601156017296958 & 0.300578008648479 \tabularnewline
51 & 0.916224561685615 & 0.167550876628770 & 0.0837754383143848 \tabularnewline
52 & 0.872687059430542 & 0.254625881138916 & 0.127312940569458 \tabularnewline
53 & 0.8375866932 & 0.324826613600001 & 0.162413306800001 \tabularnewline
54 & 0.791320712635807 & 0.417358574728386 & 0.208679287364193 \tabularnewline
55 & 0.789483857956298 & 0.421032284087404 & 0.210516142043702 \tabularnewline
56 & 0.775925335602774 & 0.448149328794452 & 0.224074664397226 \tabularnewline
57 & 0.673058641197514 & 0.653882717604973 & 0.326941358802486 \tabularnewline
58 & 0.539452308814348 & 0.921095382371304 & 0.460547691185652 \tabularnewline
59 & 0.416110442244624 & 0.832220884489249 & 0.583889557755376 \tabularnewline
\hline
\end{tabular}
%Source: https://freestatistics.org/blog/index.php?pk=103078&T=5

[TABLE]
[ROW][C]Goldfeld-Quandt test for Heteroskedasticity[/C][/ROW]
[ROW][C]p-values[/C][C]Alternative Hypothesis[/C][/ROW]
[ROW][C]breakpoint index[/C][C]greater[/C][C]2-sided[/C][C]less[/C][/ROW]
[ROW][C]16[/C][C]0.0857950324780301[/C][C]0.171590064956060[/C][C]0.91420496752197[/C][/ROW]
[ROW][C]17[/C][C]0.0524991423628480[/C][C]0.104998284725696[/C][C]0.947500857637152[/C][/ROW]
[ROW][C]18[/C][C]0.0231043965667476[/C][C]0.0462087931334952[/C][C]0.976895603433252[/C][/ROW]
[ROW][C]19[/C][C]0.231495210219772[/C][C]0.462990420439544[/C][C]0.768504789780228[/C][/ROW]
[ROW][C]20[/C][C]0.455792536295223[/C][C]0.911585072590447[/C][C]0.544207463704777[/C][/ROW]
[ROW][C]21[/C][C]0.504624854768487[/C][C]0.990750290463026[/C][C]0.495375145231513[/C][/ROW]
[ROW][C]22[/C][C]0.437677666203557[/C][C]0.875355332407113[/C][C]0.562322333796443[/C][/ROW]
[ROW][C]23[/C][C]0.340351871668438[/C][C]0.680703743336876[/C][C]0.659648128331562[/C][/ROW]
[ROW][C]24[/C][C]0.310855860228003[/C][C]0.621711720456005[/C][C]0.689144139771997[/C][/ROW]
[ROW][C]25[/C][C]0.267236336881096[/C][C]0.534472673762192[/C][C]0.732763663118904[/C][/ROW]
[ROW][C]26[/C][C]0.206849883256792[/C][C]0.413699766513584[/C][C]0.793150116743208[/C][/ROW]
[ROW][C]27[/C][C]0.23991625264691[/C][C]0.47983250529382[/C][C]0.76008374735309[/C][/ROW]
[ROW][C]28[/C][C]0.205631454710159[/C][C]0.411262909420317[/C][C]0.794368545289841[/C][/ROW]
[ROW][C]29[/C][C]0.153268958573315[/C][C]0.30653791714663[/C][C]0.846731041426685[/C][/ROW]
[ROW][C]30[/C][C]0.173008461432078[/C][C]0.346016922864155[/C][C]0.826991538567923[/C][/ROW]
[ROW][C]31[/C][C]0.268002998181082[/C][C]0.536005996362165[/C][C]0.731997001818918[/C][/ROW]
[ROW][C]32[/C][C]0.261416420975539[/C][C]0.522832841951077[/C][C]0.738583579024461[/C][/ROW]
[ROW][C]33[/C][C]0.268458916033427[/C][C]0.536917832066855[/C][C]0.731541083966573[/C][/ROW]
[ROW][C]34[/C][C]0.342995129165933[/C][C]0.685990258331866[/C][C]0.657004870834067[/C][/ROW]
[ROW][C]35[/C][C]0.358773674727471[/C][C]0.717547349454942[/C][C]0.641226325272529[/C][/ROW]
[ROW][C]36[/C][C]0.431905718587352[/C][C]0.863811437174704[/C][C]0.568094281412648[/C][/ROW]
[ROW][C]37[/C][C]0.380362945006804[/C][C]0.760725890013609[/C][C]0.619637054993196[/C][/ROW]
[ROW][C]38[/C][C]0.329100876838707[/C][C]0.658201753677413[/C][C]0.670899123161293[/C][/ROW]
[ROW][C]39[/C][C]0.450505003315906[/C][C]0.901010006631813[/C][C]0.549494996684094[/C][/ROW]
[ROW][C]40[/C][C]0.403190199995983[/C][C]0.806380399991966[/C][C]0.596809800004017[/C][/ROW]
[ROW][C]41[/C][C]0.485094127735023[/C][C]0.970188255470047[/C][C]0.514905872264977[/C][/ROW]
[ROW][C]42[/C][C]0.454317102071591[/C][C]0.908634204143182[/C][C]0.545682897928409[/C][/ROW]
[ROW][C]43[/C][C]0.380756271864454[/C][C]0.761512543728908[/C][C]0.619243728135546[/C][/ROW]
[ROW][C]44[/C][C]0.606126854145476[/C][C]0.787746291709048[/C][C]0.393873145854524[/C][/ROW]
[ROW][C]45[/C][C]0.674996769060578[/C][C]0.650006461878845[/C][C]0.325003230939422[/C][/ROW]
[ROW][C]46[/C][C]0.752290768263355[/C][C]0.49541846347329[/C][C]0.247709231736645[/C][/ROW]
[ROW][C]47[/C][C]0.728811920081673[/C][C]0.542376159836654[/C][C]0.271188079918327[/C][/ROW]
[ROW][C]48[/C][C]0.704138728110725[/C][C]0.59172254377855[/C][C]0.295861271889275[/C][/ROW]
[ROW][C]49[/C][C]0.74712682558055[/C][C]0.5057463488389[/C][C]0.25287317441945[/C][/ROW]
[ROW][C]50[/C][C]0.699421991351521[/C][C]0.601156017296958[/C][C]0.300578008648479[/C][/ROW]
[ROW][C]51[/C][C]0.916224561685615[/C][C]0.167550876628770[/C][C]0.0837754383143848[/C][/ROW]
[ROW][C]52[/C][C]0.872687059430542[/C][C]0.254625881138916[/C][C]0.127312940569458[/C][/ROW]
[ROW][C]53[/C][C]0.8375866932[/C][C]0.324826613600001[/C][C]0.162413306800001[/C][/ROW]
[ROW][C]54[/C][C]0.791320712635807[/C][C]0.417358574728386[/C][C]0.208679287364193[/C][/ROW]
[ROW][C]55[/C][C]0.789483857956298[/C][C]0.421032284087404[/C][C]0.210516142043702[/C][/ROW]
[ROW][C]56[/C][C]0.775925335602774[/C][C]0.448149328794452[/C][C]0.224074664397226[/C][/ROW]
[ROW][C]57[/C][C]0.673058641197514[/C][C]0.653882717604973[/C][C]0.326941358802486[/C][/ROW]
[ROW][C]58[/C][C]0.539452308814348[/C][C]0.921095382371304[/C][C]0.460547691185652[/C][/ROW]
[ROW][C]59[/C][C]0.416110442244624[/C][C]0.832220884489249[/C][C]0.583889557755376[/C][/ROW]
[/TABLE]
Source: https://freestatistics.org/blog/index.php?pk=103078&T=5

Globally Unique Identifier (entire table): ba.freestatistics.org/blog/index.php?pk=103078&T=5

As an alternative you can also use a QR Code:  

The GUIDs for individual cells are displayed in the table below:

Goldfeld-Quandt test for Heteroskedasticity
p-valuesAlternative Hypothesis
breakpoint indexgreater2-sidedless
160.08579503247803010.1715900649560600.91420496752197
170.05249914236284800.1049982847256960.947500857637152
180.02310439656674760.04620879313349520.976895603433252
190.2314952102197720.4629904204395440.768504789780228
200.4557925362952230.9115850725904470.544207463704777
210.5046248547684870.9907502904630260.495375145231513
220.4376776662035570.8753553324071130.562322333796443
230.3403518716684380.6807037433368760.659648128331562
240.3108558602280030.6217117204560050.689144139771997
250.2672363368810960.5344726737621920.732763663118904
260.2068498832567920.4136997665135840.793150116743208
270.239916252646910.479832505293820.76008374735309
280.2056314547101590.4112629094203170.794368545289841
290.1532689585733150.306537917146630.846731041426685
300.1730084614320780.3460169228641550.826991538567923
310.2680029981810820.5360059963621650.731997001818918
320.2614164209755390.5228328419510770.738583579024461
330.2684589160334270.5369178320668550.731541083966573
340.3429951291659330.6859902583318660.657004870834067
350.3587736747274710.7175473494549420.641226325272529
360.4319057185873520.8638114371747040.568094281412648
370.3803629450068040.7607258900136090.619637054993196
380.3291008768387070.6582017536774130.670899123161293
390.4505050033159060.9010100066318130.549494996684094
400.4031901999959830.8063803999919660.596809800004017
410.4850941277350230.9701882554700470.514905872264977
420.4543171020715910.9086342041431820.545682897928409
430.3807562718644540.7615125437289080.619243728135546
440.6061268541454760.7877462917090480.393873145854524
450.6749967690605780.6500064618788450.325003230939422
460.7522907682633550.495418463473290.247709231736645
470.7288119200816730.5423761598366540.271188079918327
480.7041387281107250.591722543778550.295861271889275
490.747126825580550.50574634883890.25287317441945
500.6994219913515210.6011560172969580.300578008648479
510.9162245616856150.1675508766287700.0837754383143848
520.8726870594305420.2546258811389160.127312940569458
530.83758669320.3248266136000010.162413306800001
540.7913207126358070.4173585747283860.208679287364193
550.7894838579562980.4210322840874040.210516142043702
560.7759253356027740.4481493287944520.224074664397226
570.6730586411975140.6538827176049730.326941358802486
580.5394523088143480.9210953823713040.460547691185652
590.4161104422446240.8322208844892490.583889557755376


Meta Analysis of Goldfeld-Quandt test for Heteroskedasticity
Description# significant tests% significant testsOK/NOK
1% type I error level00OK
5% type I error level10.0227272727272727OK
10% type I error level10.0227272727272727OK

\begin{tabular}{lllllllll}
\hline
Meta Analysis of Goldfeld-Quandt test for Heteroskedasticity \tabularnewline
Description & # significant tests & % significant tests & OK/NOK \tabularnewline
1% type I error level & 0 & 0 & OK \tabularnewline
5% type I error level & 1 & 0.0227272727272727 & OK \tabularnewline
10% type I error level & 1 & 0.0227272727272727 & OK \tabularnewline
\hline
\end{tabular}
%Source: https://freestatistics.org/blog/index.php?pk=103078&T=6

[TABLE]
[ROW][C]Meta Analysis of Goldfeld-Quandt test for Heteroskedasticity[/C][/ROW]
[ROW][C]Description[/C][C]# significant tests[/C][C]% significant tests[/C][C]OK/NOK[/C][/ROW]
[ROW][C]1% type I error level[/C][C]0[/C][C]0[/C][C]OK[/C][/ROW]
[ROW][C]5% type I error level[/C][C]1[/C][C]0.0227272727272727[/C][C]OK[/C][/ROW]
[ROW][C]10% type I error level[/C][C]1[/C][C]0.0227272727272727[/C][C]OK[/C][/ROW]
[/TABLE]
Source: https://freestatistics.org/blog/index.php?pk=103078&T=6

Globally Unique Identifier (entire table): ba.freestatistics.org/blog/index.php?pk=103078&T=6

As an alternative you can also use a QR Code:  

The GUIDs for individual cells are displayed in the table below:

Meta Analysis of Goldfeld-Quandt test for Heteroskedasticity
Description# significant tests% significant testsOK/NOK
1% type I error level00OK
5% type I error level10.0227272727272727OK
10% type I error level10.0227272727272727OK


Parameters (Session):
par1 = 1 ; par2 = Include Monthly Dummies ; par3 = Linear Trend ;
Parameters (R input):
par1 = 1 ; par2 = Include Monthly Dummies ; par3 = Linear Trend ;
R code (references can be found in the software module):
library(lattice)
library(lmtest)
n25 <- 25 #minimum number of obs. for Goldfeld-Quandt test
par1 <- as.numeric(par1)
x <- t(y)
k <- length(x[1,])
n <- length(x[,1])
x1 <- cbind(x[,par1], x[,1:k!=par1])
mycolnames <- c(colnames(x)[par1], colnames(x)[1:k!=par1])
colnames(x1) <- mycolnames #colnames(x)[par1]
x <- x1
if (par3 == 'First Differences'){
x2 <- array(0, dim=c(n-1,k), dimnames=list(1:(n-1), paste('(1-B)',colnames(x),sep='')))
for (i in 1:n-1) {
for (j in 1:k) {
x2[i,j] <- x[i+1,j] - x[i,j]
}
}
x <- x2
}
if (par2 == 'Include Monthly Dummies'){
x2 <- array(0, dim=c(n,11), dimnames=list(1:n, paste('M', seq(1:11), sep ='')))
for (i in 1:11){
x2[seq(i,n,12),i] <- 1
}
x <- cbind(x, x2)
}
if (par2 == 'Include Quarterly Dummies'){
x2 <- array(0, dim=c(n,3), dimnames=list(1:n, paste('Q', seq(1:3), sep ='')))
for (i in 1:3){
x2[seq(i,n,4),i] <- 1
}
x <- cbind(x, x2)
}
k <- length(x[1,])
if (par3 == 'Linear Trend'){
x <- cbind(x, c(1:n))
colnames(x)[k+1] <- 't'
}
x
k <- length(x[1,])
df <- as.data.frame(x)
(mylm <- lm(df))
(mysum <- summary(mylm))
if (n > n25) {
kp3 <- k + 3
nmkm3 <- n - k - 3
gqarr <- array(NA, dim=c(nmkm3-kp3+1,3))
numgqtests <- 0
numsignificant1 <- 0
numsignificant5 <- 0
numsignificant10 <- 0
for (mypoint in kp3:nmkm3) {
j <- 0
numgqtests <- numgqtests + 1
for (myalt in c('greater', 'two.sided', 'less')) {
j <- j + 1
gqarr[mypoint-kp3+1,j] <- gqtest(mylm, point=mypoint, alternative=myalt)$p.value
}
if (gqarr[mypoint-kp3+1,2] < 0.01) numsignificant1 <- numsignificant1 + 1
if (gqarr[mypoint-kp3+1,2] < 0.05) numsignificant5 <- numsignificant5 + 1
if (gqarr[mypoint-kp3+1,2] < 0.10) numsignificant10 <- numsignificant10 + 1
}
gqarr
}
bitmap(file='test0.png')
plot(x[,1], type='l', main='Actuals and Interpolation', ylab='value of Actuals and Interpolation (dots)', xlab='time or index')
points(x[,1]-mysum$resid)
grid()
dev.off()
bitmap(file='test1.png')
plot(mysum$resid, type='b', pch=19, main='Residuals', ylab='value of Residuals', xlab='time or index')
grid()
dev.off()
bitmap(file='test2.png')
hist(mysum$resid, main='Residual Histogram', xlab='values of Residuals')
grid()
dev.off()
bitmap(file='test3.png')
densityplot(~mysum$resid,col='black',main='Residual Density Plot', xlab='values of Residuals')
dev.off()
bitmap(file='test4.png')
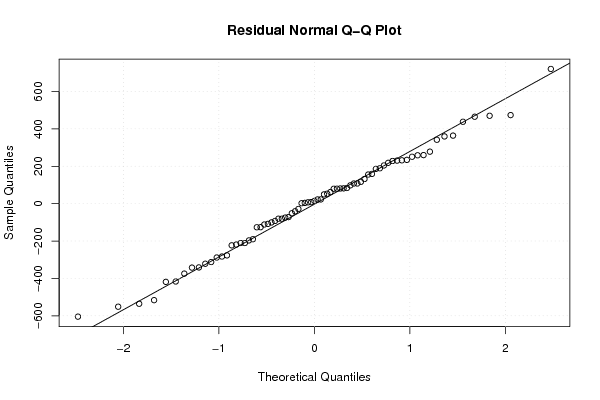
qqnorm(mysum$resid, main='Residual Normal Q-Q Plot')
qqline(mysum$resid)
grid()
dev.off()
(myerror <- as.ts(mysum$resid))
bitmap(file='test5.png')
dum <- cbind(lag(myerror,k=1),myerror)
dum
dum1 <- dum[2:length(myerror),]
dum1
z <- as.data.frame(dum1)
z
plot(z,main=paste('Residual Lag plot, lowess, and regression line'), ylab='values of Residuals', xlab='lagged values of Residuals')
lines(lowess(z))
abline(lm(z))
grid()
dev.off()
bitmap(file='test6.png')
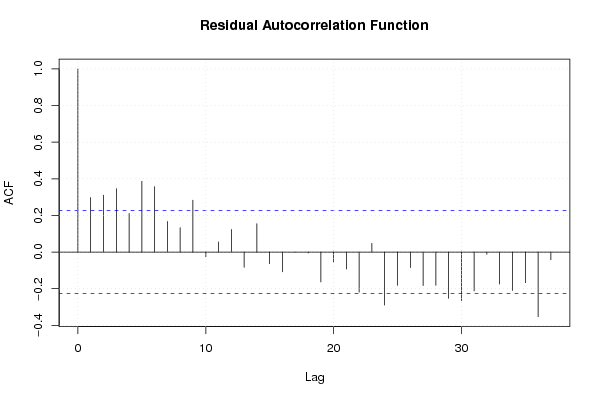
acf(mysum$resid, lag.max=length(mysum$resid)/2, main='Residual Autocorrelation Function')
grid()
dev.off()
bitmap(file='test7.png')
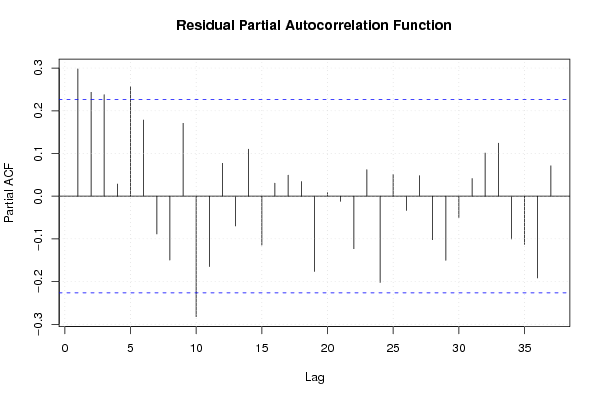
pacf(mysum$resid, lag.max=length(mysum$resid)/2, main='Residual Partial Autocorrelation Function')
grid()
dev.off()
bitmap(file='test8.png')
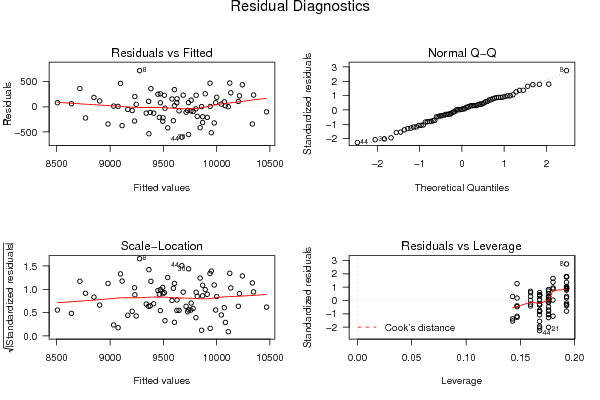
opar <- par(mfrow = c(2,2), oma = c(0, 0, 1.1, 0))
plot(mylm, las = 1, sub='Residual Diagnostics')
par(opar)
dev.off()
if (n > n25) {
bitmap(file='test9.png')
plot(kp3:nmkm3,gqarr[,2], main='Goldfeld-Quandt test',ylab='2-sided p-value',xlab='breakpoint')
grid()
dev.off()
}
load(file='createtable')
a<-table.start()
a<-table.row.start(a)
a<-table.element(a, 'Multiple Linear Regression - Estimated Regression Equation', 1, TRUE)
a<-table.row.end(a)
myeq <- colnames(x)[1]
myeq <- paste(myeq, '[t] = ', sep='')
for (i in 1:k){
if (mysum$coefficients[i,1] > 0) myeq <- paste(myeq, '+', '')
myeq <- paste(myeq, mysum$coefficients[i,1], sep=' ')
if (rownames(mysum$coefficients)[i] != '(Intercept)') {
myeq <- paste(myeq, rownames(mysum$coefficients)[i], sep='')
if (rownames(mysum$coefficients)[i] != 't') myeq <- paste(myeq, '[t]', sep='')
}
}
myeq <- paste(myeq, ' + e[t]')
a<-table.row.start(a)
a<-table.element(a, myeq)
a<-table.row.end(a)
a<-table.end(a)
table.save(a,file='mytable1.tab')
a<-table.start()
a<-table.row.start(a)
a<-table.element(a,hyperlink('ols1.htm','Multiple Linear Regression - Ordinary Least Squares',''), 6, TRUE)
a<-table.row.end(a)
a<-table.row.start(a)
a<-table.element(a,'Variable',header=TRUE)
a<-table.element(a,'Parameter',header=TRUE)
a<-table.element(a,'S.D.',header=TRUE)
a<-table.element(a,'T-STAT
H0: parameter = 0',header=TRUE)
a<-table.element(a,'2-tail p-value',header=TRUE)
a<-table.element(a,'1-tail p-value',header=TRUE)
a<-table.row.end(a)
for (i in 1:k){
a<-table.row.start(a)
a<-table.element(a,rownames(mysum$coefficients)[i],header=TRUE)
a<-table.element(a,mysum$coefficients[i,1])
a<-table.element(a, round(mysum$coefficients[i,2],6))
a<-table.element(a, round(mysum$coefficients[i,3],4))
a<-table.element(a, round(mysum$coefficients[i,4],6))
a<-table.element(a, round(mysum$coefficients[i,4]/2,6))
a<-table.row.end(a)
}
a<-table.end(a)
table.save(a,file='mytable2.tab')
a<-table.start()
a<-table.row.start(a)
a<-table.element(a, 'Multiple Linear Regression - Regression Statistics', 2, TRUE)
a<-table.row.end(a)
a<-table.row.start(a)
a<-table.element(a, 'Multiple R',1,TRUE)
a<-table.element(a, sqrt(mysum$r.squared))
a<-table.row.end(a)
a<-table.row.start(a)
a<-table.element(a, 'R-squared',1,TRUE)
a<-table.element(a, mysum$r.squared)
a<-table.row.end(a)
a<-table.row.start(a)
a<-table.element(a, 'Adjusted R-squared',1,TRUE)
a<-table.element(a, mysum$adj.r.squared)
a<-table.row.end(a)
a<-table.row.start(a)
a<-table.element(a, 'F-TEST (value)',1,TRUE)
a<-table.element(a, mysum$fstatistic[1])
a<-table.row.end(a)
a<-table.row.start(a)
a<-table.element(a, 'F-TEST (DF numerator)',1,TRUE)
a<-table.element(a, mysum$fstatistic[2])
a<-table.row.end(a)
a<-table.row.start(a)
a<-table.element(a, 'F-TEST (DF denominator)',1,TRUE)
a<-table.element(a, mysum$fstatistic[3])
a<-table.row.end(a)
a<-table.row.start(a)
a<-table.element(a, 'p-value',1,TRUE)
a<-table.element(a, 1-pf(mysum$fstatistic[1],mysum$fstatistic[2],mysum$fstatistic[3]))
a<-table.row.end(a)
a<-table.row.start(a)
a<-table.element(a, 'Multiple Linear Regression - Residual Statistics', 2, TRUE)
a<-table.row.end(a)
a<-table.row.start(a)
a<-table.element(a, 'Residual Standard Deviation',1,TRUE)
a<-table.element(a, mysum$sigma)
a<-table.row.end(a)
a<-table.row.start(a)
a<-table.element(a, 'Sum Squared Residuals',1,TRUE)
a<-table.element(a, sum(myerror*myerror))
a<-table.row.end(a)
a<-table.end(a)
table.save(a,file='mytable3.tab')
a<-table.start()
a<-table.row.start(a)
a<-table.element(a, 'Multiple Linear Regression - Actuals, Interpolation, and Residuals', 4, TRUE)
a<-table.row.end(a)
a<-table.row.start(a)
a<-table.element(a, 'Time or Index', 1, TRUE)
a<-table.element(a, 'Actuals', 1, TRUE)
a<-table.element(a, 'Interpolation
Forecast', 1, TRUE)
a<-table.element(a, 'Residuals
Prediction Error', 1, TRUE)
a<-table.row.end(a)
for (i in 1:n) {
a<-table.row.start(a)
a<-table.element(a,i, 1, TRUE)
a<-table.element(a,x[i])
a<-table.element(a,x[i]-mysum$resid[i])
a<-table.element(a,mysum$resid[i])
a<-table.row.end(a)
}
a<-table.end(a)
table.save(a,file='mytable4.tab')
if (n > n25) {
a<-table.start()
a<-table.row.start(a)
a<-table.element(a,'Goldfeld-Quandt test for Heteroskedasticity',4,TRUE)
a<-table.row.end(a)
a<-table.row.start(a)
a<-table.element(a,'p-values',header=TRUE)
a<-table.element(a,'Alternative Hypothesis',3,header=TRUE)
a<-table.row.end(a)
a<-table.row.start(a)
a<-table.element(a,'breakpoint index',header=TRUE)
a<-table.element(a,'greater',header=TRUE)
a<-table.element(a,'2-sided',header=TRUE)
a<-table.element(a,'less',header=TRUE)
a<-table.row.end(a)
for (mypoint in kp3:nmkm3) {
a<-table.row.start(a)
a<-table.element(a,mypoint,header=TRUE)
a<-table.element(a,gqarr[mypoint-kp3+1,1])
a<-table.element(a,gqarr[mypoint-kp3+1,2])
a<-table.element(a,gqarr[mypoint-kp3+1,3])
a<-table.row.end(a)
}
a<-table.end(a)
table.save(a,file='mytable5.tab')
a<-table.start()
a<-table.row.start(a)
a<-table.element(a,'Meta Analysis of Goldfeld-Quandt test for Heteroskedasticity',4,TRUE)
a<-table.row.end(a)
a<-table.row.start(a)
a<-table.element(a,'Description',header=TRUE)
a<-table.element(a,'# significant tests',header=TRUE)
a<-table.element(a,'% significant tests',header=TRUE)
a<-table.element(a,'OK/NOK',header=TRUE)
a<-table.row.end(a)
a<-table.row.start(a)
a<-table.element(a,'1% type I error level',header=TRUE)
a<-table.element(a,numsignificant1)
a<-table.element(a,numsignificant1/numgqtests)
if (numsignificant1/numgqtests < 0.01) dum <- 'OK' else dum <- 'NOK'
a<-table.element(a,dum)
a<-table.row.end(a)
a<-table.row.start(a)
a<-table.element(a,'5% type I error level',header=TRUE)
a<-table.element(a,numsignificant5)
a<-table.element(a,numsignificant5/numgqtests)
if (numsignificant5/numgqtests < 0.05) dum <- 'OK' else dum <- 'NOK'
a<-table.element(a,dum)
a<-table.row.end(a)
a<-table.row.start(a)
a<-table.element(a,'10% type I error level',header=TRUE)
a<-table.element(a,numsignificant10)
a<-table.element(a,numsignificant10/numgqtests)
if (numsignificant10/numgqtests < 0.1) dum <- 'OK' else dum <- 'NOK'
a<-table.element(a,dum)
a<-table.row.end(a)
a<-table.end(a)
table.save(a,file='mytable6.tab')
}