Free Statistics

of Irreproducible Research!

Author's title

Author*The author of this computation has been verified*
R Software Modulerwasp_multipleregression.wasp
Title produced by softwareMultiple Regression
Date of computationMon, 28 Nov 2011 11:18:57 -0500
Cite this page as followsStatistical Computations at FreeStatistics.org, Office for Research Development and Education, URL https://freestatistics.org/blog/index.php?v=date/2011/Nov/28/t1322497166r2v9cuzp9b2woj0.htm/, Retrieved Thu, 31 Oct 2024 22:58:40 +0000
Statistical Computations at FreeStatistics.org, Office for Research Development and Education, URL https://freestatistics.org/blog/index.php?pk=147838, Retrieved Thu, 31 Oct 2024 22:58:40 +0000
QR Codes:

Original text written by user:
IsPrivate?No (this computation is public)
User-defined keywords
Estimated Impact175
Family? (F = Feedback message, R = changed R code, M = changed R Module, P = changed Parameters, D = changed Data)
-     [Multiple Regression] [HPC Retail Sales] [2008-03-08 13:40:54] [1c0f2c85e8a48e42648374b3bcceca26]
- RMPD    [Multiple Regression] [] [2011-11-28 16:18:57] [c092f3a3bdd85c7279ddab6c8c6c9261] [Current]
- R         [Multiple Regression] [] [2011-11-29 18:16:34] [86f7284edee3dbb8ea5c7e2dec87d892]
Feedback Forum

Post a new message
Dataseries X:
579
572
560
551
537
541
588
607
599
578
563
566
561
554
540
526
512
505
554
584
569
540
522
526
527
516
503
489
479
475
524
552
532
511
492
492
493
481
462
457
442
439
488
521
501
485
464
460
467
460
448
443
436
431
484
510
513
503
471
471


Summary of computational transaction
Raw Inputview raw input (R code)
Raw Outputview raw output of R engine
Computing time4 seconds
R Server'Gwilym Jenkins' @ jenkins.wessa.net

\begin{tabular}{lllllllll}
\hline
Summary of computational transaction \tabularnewline
Raw Input & view raw input (R code)  \tabularnewline
Raw Output & view raw output of R engine  \tabularnewline
Computing time & 4 seconds \tabularnewline
R Server & 'Gwilym Jenkins' @ jenkins.wessa.net \tabularnewline
\hline
\end{tabular}
%Source: https://freestatistics.org/blog/index.php?pk=147838&T=0

[TABLE]
[ROW][C]Summary of computational transaction[/C][/ROW]
[ROW][C]Raw Input[/C][C]view raw input (R code) [/C][/ROW]
[ROW][C]Raw Output[/C][C]view raw output of R engine [/C][/ROW]
[ROW][C]Computing time[/C][C]4 seconds[/C][/ROW]
[ROW][C]R Server[/C][C]'Gwilym Jenkins' @ jenkins.wessa.net[/C][/ROW]
[/TABLE]
Source: https://freestatistics.org/blog/index.php?pk=147838&T=0

Globally Unique Identifier (entire table): ba.freestatistics.org/blog/index.php?pk=147838&T=0

As an alternative you can also use a QR Code:  

The GUIDs for individual cells are displayed in the table below:

Summary of computational transaction
Raw Inputview raw input (R code)
Raw Outputview raw output of R engine
Computing time4 seconds
R Server'Gwilym Jenkins' @ jenkins.wessa.net


Multiple Linear Regression - Estimated Regression Equation
werkzoekende_werklozen[t] = + 583.2 -2.10555555555536M1[t] -8.67777777777779M2[t] -20.45M3[t] -27.6222222222222M4[t] -37.3944444444445M5[t] -38.1666666666667M6[t] + 13.4611111111111M7[t] + 42.8888888888889M8[t] + 33.1166666666667M9[t] + 15.9444444444444M10[t] -2.82777777777778M11[t] -2.22777777777778t + e[t]

\begin{tabular}{lllllllll}
\hline
Multiple Linear Regression - Estimated Regression Equation \tabularnewline
werkzoekende_werklozen[t] =  +  583.2 -2.10555555555536M1[t] -8.67777777777779M2[t] -20.45M3[t] -27.6222222222222M4[t] -37.3944444444445M5[t] -38.1666666666667M6[t] +  13.4611111111111M7[t] +  42.8888888888889M8[t] +  33.1166666666667M9[t] +  15.9444444444444M10[t] -2.82777777777778M11[t] -2.22777777777778t  + e[t] \tabularnewline
\hline
\end{tabular}
%Source: https://freestatistics.org/blog/index.php?pk=147838&T=1

[TABLE]
[ROW][C]Multiple Linear Regression - Estimated Regression Equation[/C][/ROW]
[ROW][C]werkzoekende_werklozen[t] =  +  583.2 -2.10555555555536M1[t] -8.67777777777779M2[t] -20.45M3[t] -27.6222222222222M4[t] -37.3944444444445M5[t] -38.1666666666667M6[t] +  13.4611111111111M7[t] +  42.8888888888889M8[t] +  33.1166666666667M9[t] +  15.9444444444444M10[t] -2.82777777777778M11[t] -2.22777777777778t  + e[t][/C][/ROW]
[/TABLE]
Source: https://freestatistics.org/blog/index.php?pk=147838&T=1

Globally Unique Identifier (entire table): ba.freestatistics.org/blog/index.php?pk=147838&T=1

As an alternative you can also use a QR Code:  

The GUIDs for individual cells are displayed in the table below:

Multiple Linear Regression - Estimated Regression Equation
werkzoekende_werklozen[t] = + 583.2 -2.10555555555536M1[t] -8.67777777777779M2[t] -20.45M3[t] -27.6222222222222M4[t] -37.3944444444445M5[t] -38.1666666666667M6[t] + 13.4611111111111M7[t] + 42.8888888888889M8[t] + 33.1166666666667M9[t] + 15.9444444444444M10[t] -2.82777777777778M11[t] -2.22777777777778t + e[t]


Multiple Linear Regression - Ordinary Least Squares
VariableParameterS.D.T-STATH0: parameter = 02-tail p-value1-tail p-value
(Intercept)583.25.94018698.178700
M1-2.105555555555367.226569-0.29140.7720560.386028
M2-8.677777777777797.215772-1.20260.235150.117575
M3-20.457.20599-2.83790.0066840.003342
M4-27.62222222222227.197225-3.83790.000370.000185
M5-37.39444444444457.189483-5.20134e-062e-06
M6-38.16666666666677.182767-5.31363e-061e-06
M713.46111111111117.1770791.87560.0669340.033467
M842.88888888888897.1724215.979700
M933.11666666666677.1687974.61963e-051.5e-05
M1015.94444444444447.1662072.22490.0309220.015461
M11-2.827777777777787.164653-0.39470.6948610.347431
t-2.227777777777780.086171-25.852900

\begin{tabular}{lllllllll}
\hline
Multiple Linear Regression - Ordinary Least Squares \tabularnewline
Variable & Parameter & S.D. & T-STATH0: parameter = 0 & 2-tail p-value & 1-tail p-value \tabularnewline
(Intercept) & 583.2 & 5.940186 & 98.1787 & 0 & 0 \tabularnewline
M1 & -2.10555555555536 & 7.226569 & -0.2914 & 0.772056 & 0.386028 \tabularnewline
M2 & -8.67777777777779 & 7.215772 & -1.2026 & 0.23515 & 0.117575 \tabularnewline
M3 & -20.45 & 7.20599 & -2.8379 & 0.006684 & 0.003342 \tabularnewline
M4 & -27.6222222222222 & 7.197225 & -3.8379 & 0.00037 & 0.000185 \tabularnewline
M5 & -37.3944444444445 & 7.189483 & -5.2013 & 4e-06 & 2e-06 \tabularnewline
M6 & -38.1666666666667 & 7.182767 & -5.3136 & 3e-06 & 1e-06 \tabularnewline
M7 & 13.4611111111111 & 7.177079 & 1.8756 & 0.066934 & 0.033467 \tabularnewline
M8 & 42.8888888888889 & 7.172421 & 5.9797 & 0 & 0 \tabularnewline
M9 & 33.1166666666667 & 7.168797 & 4.6196 & 3e-05 & 1.5e-05 \tabularnewline
M10 & 15.9444444444444 & 7.166207 & 2.2249 & 0.030922 & 0.015461 \tabularnewline
M11 & -2.82777777777778 & 7.164653 & -0.3947 & 0.694861 & 0.347431 \tabularnewline
t & -2.22777777777778 & 0.086171 & -25.8529 & 0 & 0 \tabularnewline
\hline
\end{tabular}
%Source: https://freestatistics.org/blog/index.php?pk=147838&T=2

[TABLE]
[ROW][C]Multiple Linear Regression - Ordinary Least Squares[/C][/ROW]
[ROW][C]Variable[/C][C]Parameter[/C][C]S.D.[/C][C]T-STATH0: parameter = 0[/C][C]2-tail p-value[/C][C]1-tail p-value[/C][/ROW]
[ROW][C](Intercept)[/C][C]583.2[/C][C]5.940186[/C][C]98.1787[/C][C]0[/C][C]0[/C][/ROW]
[ROW][C]M1[/C][C]-2.10555555555536[/C][C]7.226569[/C][C]-0.2914[/C][C]0.772056[/C][C]0.386028[/C][/ROW]
[ROW][C]M2[/C][C]-8.67777777777779[/C][C]7.215772[/C][C]-1.2026[/C][C]0.23515[/C][C]0.117575[/C][/ROW]
[ROW][C]M3[/C][C]-20.45[/C][C]7.20599[/C][C]-2.8379[/C][C]0.006684[/C][C]0.003342[/C][/ROW]
[ROW][C]M4[/C][C]-27.6222222222222[/C][C]7.197225[/C][C]-3.8379[/C][C]0.00037[/C][C]0.000185[/C][/ROW]
[ROW][C]M5[/C][C]-37.3944444444445[/C][C]7.189483[/C][C]-5.2013[/C][C]4e-06[/C][C]2e-06[/C][/ROW]
[ROW][C]M6[/C][C]-38.1666666666667[/C][C]7.182767[/C][C]-5.3136[/C][C]3e-06[/C][C]1e-06[/C][/ROW]
[ROW][C]M7[/C][C]13.4611111111111[/C][C]7.177079[/C][C]1.8756[/C][C]0.066934[/C][C]0.033467[/C][/ROW]
[ROW][C]M8[/C][C]42.8888888888889[/C][C]7.172421[/C][C]5.9797[/C][C]0[/C][C]0[/C][/ROW]
[ROW][C]M9[/C][C]33.1166666666667[/C][C]7.168797[/C][C]4.6196[/C][C]3e-05[/C][C]1.5e-05[/C][/ROW]
[ROW][C]M10[/C][C]15.9444444444444[/C][C]7.166207[/C][C]2.2249[/C][C]0.030922[/C][C]0.015461[/C][/ROW]
[ROW][C]M11[/C][C]-2.82777777777778[/C][C]7.164653[/C][C]-0.3947[/C][C]0.694861[/C][C]0.347431[/C][/ROW]
[ROW][C]t[/C][C]-2.22777777777778[/C][C]0.086171[/C][C]-25.8529[/C][C]0[/C][C]0[/C][/ROW]
[/TABLE]
Source: https://freestatistics.org/blog/index.php?pk=147838&T=2

Globally Unique Identifier (entire table): ba.freestatistics.org/blog/index.php?pk=147838&T=2

As an alternative you can also use a QR Code:  

The GUIDs for individual cells are displayed in the table below:

Multiple Linear Regression - Ordinary Least Squares
VariableParameterS.D.T-STATH0: parameter = 02-tail p-value1-tail p-value
(Intercept)583.25.94018698.178700
M1-2.105555555555367.226569-0.29140.7720560.386028
M2-8.677777777777797.215772-1.20260.235150.117575
M3-20.457.20599-2.83790.0066840.003342
M4-27.62222222222227.197225-3.83790.000370.000185
M5-37.39444444444457.189483-5.20134e-062e-06
M6-38.16666666666677.182767-5.31363e-061e-06
M713.46111111111117.1770791.87560.0669340.033467
M842.88888888888897.1724215.979700
M933.11666666666677.1687974.61963e-051.5e-05
M1015.94444444444447.1662072.22490.0309220.015461
M11-2.827777777777787.164653-0.39470.6948610.347431
t-2.227777777777780.086171-25.852900


Multiple Linear Regression - Regression Statistics
Multiple R0.974985960661397
R-squared0.950597623486827
Adjusted R-squared0.937984250760059
F-TEST (value)75.364269658781
F-TEST (DF numerator)12
F-TEST (DF denominator)47
p-value0
Multiple Linear Regression - Residual Statistics
Residual Standard Deviation11.3274911934456
Sum Squared Residuals6030.66666666667

\begin{tabular}{lllllllll}
\hline
Multiple Linear Regression - Regression Statistics \tabularnewline
Multiple R & 0.974985960661397 \tabularnewline
R-squared & 0.950597623486827 \tabularnewline
Adjusted R-squared & 0.937984250760059 \tabularnewline
F-TEST (value) & 75.364269658781 \tabularnewline
F-TEST (DF numerator) & 12 \tabularnewline
F-TEST (DF denominator) & 47 \tabularnewline
p-value & 0 \tabularnewline
Multiple Linear Regression - Residual Statistics \tabularnewline
Residual Standard Deviation & 11.3274911934456 \tabularnewline
Sum Squared Residuals & 6030.66666666667 \tabularnewline
\hline
\end{tabular}
%Source: https://freestatistics.org/blog/index.php?pk=147838&T=3

[TABLE]
[ROW][C]Multiple Linear Regression - Regression Statistics[/C][/ROW]
[ROW][C]Multiple R[/C][C]0.974985960661397[/C][/ROW]
[ROW][C]R-squared[/C][C]0.950597623486827[/C][/ROW]
[ROW][C]Adjusted R-squared[/C][C]0.937984250760059[/C][/ROW]
[ROW][C]F-TEST (value)[/C][C]75.364269658781[/C][/ROW]
[ROW][C]F-TEST (DF numerator)[/C][C]12[/C][/ROW]
[ROW][C]F-TEST (DF denominator)[/C][C]47[/C][/ROW]
[ROW][C]p-value[/C][C]0[/C][/ROW]
[ROW][C]Multiple Linear Regression - Residual Statistics[/C][/ROW]
[ROW][C]Residual Standard Deviation[/C][C]11.3274911934456[/C][/ROW]
[ROW][C]Sum Squared Residuals[/C][C]6030.66666666667[/C][/ROW]
[/TABLE]
Source: https://freestatistics.org/blog/index.php?pk=147838&T=3

Globally Unique Identifier (entire table): ba.freestatistics.org/blog/index.php?pk=147838&T=3

As an alternative you can also use a QR Code:  

The GUIDs for individual cells are displayed in the table below:

Multiple Linear Regression - Regression Statistics
Multiple R0.974985960661397
R-squared0.950597623486827
Adjusted R-squared0.937984250760059
F-TEST (value)75.364269658781
F-TEST (DF numerator)12
F-TEST (DF denominator)47
p-value0
Multiple Linear Regression - Residual Statistics
Residual Standard Deviation11.3274911934456
Sum Squared Residuals6030.66666666667


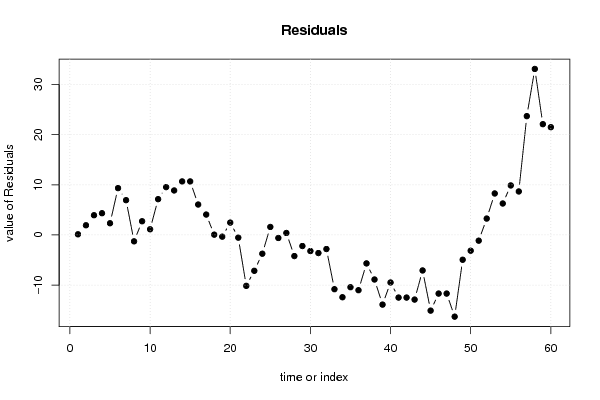
Multiple Linear Regression - Actuals, Interpolation, and Residuals
Time or IndexActualsInterpolationForecastResidualsPrediction Error
1579578.8666666666660.133333333334093
2572570.0666666666671.9333333333333
3560556.0666666666673.9333333333333
4551546.6666666666674.33333333333329
5537534.6666666666672.3333333333333
6541531.6666666666679.33333333333331
7588581.0666666666676.93333333333331
8607608.266666666667-1.2666666666667
9599596.2666666666672.73333333333329
10578576.8666666666671.13333333333331
11563555.8666666666677.1333333333333
12566556.4666666666679.5333333333333
13561552.1333333333348.86666666666647
14554543.33333333333310.6666666666667
15540529.33333333333310.6666666666666
16526519.9333333333336.06666666666665
17512507.9333333333334.06666666666665
18505504.9333333333330.0666666666666498
19554554.333333333333-0.333333333333352
20584581.5333333333332.46666666666665
21569569.533333333333-0.533333333333349
22540550.133333333333-10.1333333333333
23522529.133333333333-7.13333333333335
24526529.733333333333-3.73333333333335
25527525.41.59999999999979
26516516.6-0.600000000000006
27503502.60.400000000000004
28489493.2-4.2
29479481.2-2.2
30475478.2-3.2
31524527.6-3.6
32552554.8-2.79999999999999
33532542.8-10.8
34511523.4-12.4
35492502.4-10.4
36492503-11
37493498.666666666667-5.66666666666685
38481489.866666666667-8.86666666666665
39462475.866666666667-13.8666666666666
40457466.466666666667-9.46666666666665
41442454.466666666667-12.4666666666667
42439451.466666666667-12.4666666666667
43488500.866666666667-12.8666666666667
44521528.066666666667-7.06666666666666
45501516.066666666667-15.0666666666666
46485496.666666666667-11.6666666666667
47464475.666666666667-11.6666666666667
48460476.266666666667-16.2666666666667
49467471.933333333334-4.9333333333335
50460463.133333333333-3.13333333333329
51448449.133333333333-1.1333333333333
52443439.7333333333333.26666666666671
53436427.7333333333338.26666666666671
54431424.7333333333336.26666666666669
55484474.1333333333339.86666666666669
56510501.3333333333338.6666666666667
57513489.33333333333323.6666666666667
58503469.93333333333333.0666666666667
59471448.93333333333322.0666666666667
60471449.53333333333321.4666666666667

\begin{tabular}{lllllllll}
\hline
Multiple Linear Regression - Actuals, Interpolation, and Residuals \tabularnewline
Time or Index & Actuals & InterpolationForecast & ResidualsPrediction Error \tabularnewline
1 & 579 & 578.866666666666 & 0.133333333334093 \tabularnewline
2 & 572 & 570.066666666667 & 1.9333333333333 \tabularnewline
3 & 560 & 556.066666666667 & 3.9333333333333 \tabularnewline
4 & 551 & 546.666666666667 & 4.33333333333329 \tabularnewline
5 & 537 & 534.666666666667 & 2.3333333333333 \tabularnewline
6 & 541 & 531.666666666667 & 9.33333333333331 \tabularnewline
7 & 588 & 581.066666666667 & 6.93333333333331 \tabularnewline
8 & 607 & 608.266666666667 & -1.2666666666667 \tabularnewline
9 & 599 & 596.266666666667 & 2.73333333333329 \tabularnewline
10 & 578 & 576.866666666667 & 1.13333333333331 \tabularnewline
11 & 563 & 555.866666666667 & 7.1333333333333 \tabularnewline
12 & 566 & 556.466666666667 & 9.5333333333333 \tabularnewline
13 & 561 & 552.133333333334 & 8.86666666666647 \tabularnewline
14 & 554 & 543.333333333333 & 10.6666666666667 \tabularnewline
15 & 540 & 529.333333333333 & 10.6666666666666 \tabularnewline
16 & 526 & 519.933333333333 & 6.06666666666665 \tabularnewline
17 & 512 & 507.933333333333 & 4.06666666666665 \tabularnewline
18 & 505 & 504.933333333333 & 0.0666666666666498 \tabularnewline
19 & 554 & 554.333333333333 & -0.333333333333352 \tabularnewline
20 & 584 & 581.533333333333 & 2.46666666666665 \tabularnewline
21 & 569 & 569.533333333333 & -0.533333333333349 \tabularnewline
22 & 540 & 550.133333333333 & -10.1333333333333 \tabularnewline
23 & 522 & 529.133333333333 & -7.13333333333335 \tabularnewline
24 & 526 & 529.733333333333 & -3.73333333333335 \tabularnewline
25 & 527 & 525.4 & 1.59999999999979 \tabularnewline
26 & 516 & 516.6 & -0.600000000000006 \tabularnewline
27 & 503 & 502.6 & 0.400000000000004 \tabularnewline
28 & 489 & 493.2 & -4.2 \tabularnewline
29 & 479 & 481.2 & -2.2 \tabularnewline
30 & 475 & 478.2 & -3.2 \tabularnewline
31 & 524 & 527.6 & -3.6 \tabularnewline
32 & 552 & 554.8 & -2.79999999999999 \tabularnewline
33 & 532 & 542.8 & -10.8 \tabularnewline
34 & 511 & 523.4 & -12.4 \tabularnewline
35 & 492 & 502.4 & -10.4 \tabularnewline
36 & 492 & 503 & -11 \tabularnewline
37 & 493 & 498.666666666667 & -5.66666666666685 \tabularnewline
38 & 481 & 489.866666666667 & -8.86666666666665 \tabularnewline
39 & 462 & 475.866666666667 & -13.8666666666666 \tabularnewline
40 & 457 & 466.466666666667 & -9.46666666666665 \tabularnewline
41 & 442 & 454.466666666667 & -12.4666666666667 \tabularnewline
42 & 439 & 451.466666666667 & -12.4666666666667 \tabularnewline
43 & 488 & 500.866666666667 & -12.8666666666667 \tabularnewline
44 & 521 & 528.066666666667 & -7.06666666666666 \tabularnewline
45 & 501 & 516.066666666667 & -15.0666666666666 \tabularnewline
46 & 485 & 496.666666666667 & -11.6666666666667 \tabularnewline
47 & 464 & 475.666666666667 & -11.6666666666667 \tabularnewline
48 & 460 & 476.266666666667 & -16.2666666666667 \tabularnewline
49 & 467 & 471.933333333334 & -4.9333333333335 \tabularnewline
50 & 460 & 463.133333333333 & -3.13333333333329 \tabularnewline
51 & 448 & 449.133333333333 & -1.1333333333333 \tabularnewline
52 & 443 & 439.733333333333 & 3.26666666666671 \tabularnewline
53 & 436 & 427.733333333333 & 8.26666666666671 \tabularnewline
54 & 431 & 424.733333333333 & 6.26666666666669 \tabularnewline
55 & 484 & 474.133333333333 & 9.86666666666669 \tabularnewline
56 & 510 & 501.333333333333 & 8.6666666666667 \tabularnewline
57 & 513 & 489.333333333333 & 23.6666666666667 \tabularnewline
58 & 503 & 469.933333333333 & 33.0666666666667 \tabularnewline
59 & 471 & 448.933333333333 & 22.0666666666667 \tabularnewline
60 & 471 & 449.533333333333 & 21.4666666666667 \tabularnewline
\hline
\end{tabular}
%Source: https://freestatistics.org/blog/index.php?pk=147838&T=4

[TABLE]
[ROW][C]Multiple Linear Regression - Actuals, Interpolation, and Residuals[/C][/ROW]
[ROW][C]Time or Index[/C][C]Actuals[/C][C]InterpolationForecast[/C][C]ResidualsPrediction Error[/C][/ROW]
[ROW][C]1[/C][C]579[/C][C]578.866666666666[/C][C]0.133333333334093[/C][/ROW]
[ROW][C]2[/C][C]572[/C][C]570.066666666667[/C][C]1.9333333333333[/C][/ROW]
[ROW][C]3[/C][C]560[/C][C]556.066666666667[/C][C]3.9333333333333[/C][/ROW]
[ROW][C]4[/C][C]551[/C][C]546.666666666667[/C][C]4.33333333333329[/C][/ROW]
[ROW][C]5[/C][C]537[/C][C]534.666666666667[/C][C]2.3333333333333[/C][/ROW]
[ROW][C]6[/C][C]541[/C][C]531.666666666667[/C][C]9.33333333333331[/C][/ROW]
[ROW][C]7[/C][C]588[/C][C]581.066666666667[/C][C]6.93333333333331[/C][/ROW]
[ROW][C]8[/C][C]607[/C][C]608.266666666667[/C][C]-1.2666666666667[/C][/ROW]
[ROW][C]9[/C][C]599[/C][C]596.266666666667[/C][C]2.73333333333329[/C][/ROW]
[ROW][C]10[/C][C]578[/C][C]576.866666666667[/C][C]1.13333333333331[/C][/ROW]
[ROW][C]11[/C][C]563[/C][C]555.866666666667[/C][C]7.1333333333333[/C][/ROW]
[ROW][C]12[/C][C]566[/C][C]556.466666666667[/C][C]9.5333333333333[/C][/ROW]
[ROW][C]13[/C][C]561[/C][C]552.133333333334[/C][C]8.86666666666647[/C][/ROW]
[ROW][C]14[/C][C]554[/C][C]543.333333333333[/C][C]10.6666666666667[/C][/ROW]
[ROW][C]15[/C][C]540[/C][C]529.333333333333[/C][C]10.6666666666666[/C][/ROW]
[ROW][C]16[/C][C]526[/C][C]519.933333333333[/C][C]6.06666666666665[/C][/ROW]
[ROW][C]17[/C][C]512[/C][C]507.933333333333[/C][C]4.06666666666665[/C][/ROW]
[ROW][C]18[/C][C]505[/C][C]504.933333333333[/C][C]0.0666666666666498[/C][/ROW]
[ROW][C]19[/C][C]554[/C][C]554.333333333333[/C][C]-0.333333333333352[/C][/ROW]
[ROW][C]20[/C][C]584[/C][C]581.533333333333[/C][C]2.46666666666665[/C][/ROW]
[ROW][C]21[/C][C]569[/C][C]569.533333333333[/C][C]-0.533333333333349[/C][/ROW]
[ROW][C]22[/C][C]540[/C][C]550.133333333333[/C][C]-10.1333333333333[/C][/ROW]
[ROW][C]23[/C][C]522[/C][C]529.133333333333[/C][C]-7.13333333333335[/C][/ROW]
[ROW][C]24[/C][C]526[/C][C]529.733333333333[/C][C]-3.73333333333335[/C][/ROW]
[ROW][C]25[/C][C]527[/C][C]525.4[/C][C]1.59999999999979[/C][/ROW]
[ROW][C]26[/C][C]516[/C][C]516.6[/C][C]-0.600000000000006[/C][/ROW]
[ROW][C]27[/C][C]503[/C][C]502.6[/C][C]0.400000000000004[/C][/ROW]
[ROW][C]28[/C][C]489[/C][C]493.2[/C][C]-4.2[/C][/ROW]
[ROW][C]29[/C][C]479[/C][C]481.2[/C][C]-2.2[/C][/ROW]
[ROW][C]30[/C][C]475[/C][C]478.2[/C][C]-3.2[/C][/ROW]
[ROW][C]31[/C][C]524[/C][C]527.6[/C][C]-3.6[/C][/ROW]
[ROW][C]32[/C][C]552[/C][C]554.8[/C][C]-2.79999999999999[/C][/ROW]
[ROW][C]33[/C][C]532[/C][C]542.8[/C][C]-10.8[/C][/ROW]
[ROW][C]34[/C][C]511[/C][C]523.4[/C][C]-12.4[/C][/ROW]
[ROW][C]35[/C][C]492[/C][C]502.4[/C][C]-10.4[/C][/ROW]
[ROW][C]36[/C][C]492[/C][C]503[/C][C]-11[/C][/ROW]
[ROW][C]37[/C][C]493[/C][C]498.666666666667[/C][C]-5.66666666666685[/C][/ROW]
[ROW][C]38[/C][C]481[/C][C]489.866666666667[/C][C]-8.86666666666665[/C][/ROW]
[ROW][C]39[/C][C]462[/C][C]475.866666666667[/C][C]-13.8666666666666[/C][/ROW]
[ROW][C]40[/C][C]457[/C][C]466.466666666667[/C][C]-9.46666666666665[/C][/ROW]
[ROW][C]41[/C][C]442[/C][C]454.466666666667[/C][C]-12.4666666666667[/C][/ROW]
[ROW][C]42[/C][C]439[/C][C]451.466666666667[/C][C]-12.4666666666667[/C][/ROW]
[ROW][C]43[/C][C]488[/C][C]500.866666666667[/C][C]-12.8666666666667[/C][/ROW]
[ROW][C]44[/C][C]521[/C][C]528.066666666667[/C][C]-7.06666666666666[/C][/ROW]
[ROW][C]45[/C][C]501[/C][C]516.066666666667[/C][C]-15.0666666666666[/C][/ROW]
[ROW][C]46[/C][C]485[/C][C]496.666666666667[/C][C]-11.6666666666667[/C][/ROW]
[ROW][C]47[/C][C]464[/C][C]475.666666666667[/C][C]-11.6666666666667[/C][/ROW]
[ROW][C]48[/C][C]460[/C][C]476.266666666667[/C][C]-16.2666666666667[/C][/ROW]
[ROW][C]49[/C][C]467[/C][C]471.933333333334[/C][C]-4.9333333333335[/C][/ROW]
[ROW][C]50[/C][C]460[/C][C]463.133333333333[/C][C]-3.13333333333329[/C][/ROW]
[ROW][C]51[/C][C]448[/C][C]449.133333333333[/C][C]-1.1333333333333[/C][/ROW]
[ROW][C]52[/C][C]443[/C][C]439.733333333333[/C][C]3.26666666666671[/C][/ROW]
[ROW][C]53[/C][C]436[/C][C]427.733333333333[/C][C]8.26666666666671[/C][/ROW]
[ROW][C]54[/C][C]431[/C][C]424.733333333333[/C][C]6.26666666666669[/C][/ROW]
[ROW][C]55[/C][C]484[/C][C]474.133333333333[/C][C]9.86666666666669[/C][/ROW]
[ROW][C]56[/C][C]510[/C][C]501.333333333333[/C][C]8.6666666666667[/C][/ROW]
[ROW][C]57[/C][C]513[/C][C]489.333333333333[/C][C]23.6666666666667[/C][/ROW]
[ROW][C]58[/C][C]503[/C][C]469.933333333333[/C][C]33.0666666666667[/C][/ROW]
[ROW][C]59[/C][C]471[/C][C]448.933333333333[/C][C]22.0666666666667[/C][/ROW]
[ROW][C]60[/C][C]471[/C][C]449.533333333333[/C][C]21.4666666666667[/C][/ROW]
[/TABLE]
Source: https://freestatistics.org/blog/index.php?pk=147838&T=4

Globally Unique Identifier (entire table): ba.freestatistics.org/blog/index.php?pk=147838&T=4

As an alternative you can also use a QR Code:  

The GUIDs for individual cells are displayed in the table below:

Multiple Linear Regression - Actuals, Interpolation, and Residuals
Time or IndexActualsInterpolationForecastResidualsPrediction Error
1579578.8666666666660.133333333334093
2572570.0666666666671.9333333333333
3560556.0666666666673.9333333333333
4551546.6666666666674.33333333333329
5537534.6666666666672.3333333333333
6541531.6666666666679.33333333333331
7588581.0666666666676.93333333333331
8607608.266666666667-1.2666666666667
9599596.2666666666672.73333333333329
10578576.8666666666671.13333333333331
11563555.8666666666677.1333333333333
12566556.4666666666679.5333333333333
13561552.1333333333348.86666666666647
14554543.33333333333310.6666666666667
15540529.33333333333310.6666666666666
16526519.9333333333336.06666666666665
17512507.9333333333334.06666666666665
18505504.9333333333330.0666666666666498
19554554.333333333333-0.333333333333352
20584581.5333333333332.46666666666665
21569569.533333333333-0.533333333333349
22540550.133333333333-10.1333333333333
23522529.133333333333-7.13333333333335
24526529.733333333333-3.73333333333335
25527525.41.59999999999979
26516516.6-0.600000000000006
27503502.60.400000000000004
28489493.2-4.2
29479481.2-2.2
30475478.2-3.2
31524527.6-3.6
32552554.8-2.79999999999999
33532542.8-10.8
34511523.4-12.4
35492502.4-10.4
36492503-11
37493498.666666666667-5.66666666666685
38481489.866666666667-8.86666666666665
39462475.866666666667-13.8666666666666
40457466.466666666667-9.46666666666665
41442454.466666666667-12.4666666666667
42439451.466666666667-12.4666666666667
43488500.866666666667-12.8666666666667
44521528.066666666667-7.06666666666666
45501516.066666666667-15.0666666666666
46485496.666666666667-11.6666666666667
47464475.666666666667-11.6666666666667
48460476.266666666667-16.2666666666667
49467471.933333333334-4.9333333333335
50460463.133333333333-3.13333333333329
51448449.133333333333-1.1333333333333
52443439.7333333333333.26666666666671
53436427.7333333333338.26666666666671
54431424.7333333333336.26666666666669
55484474.1333333333339.86666666666669
56510501.3333333333338.6666666666667
57513489.33333333333323.6666666666667
58503469.93333333333333.0666666666667
59471448.93333333333322.0666666666667
60471449.53333333333321.4666666666667


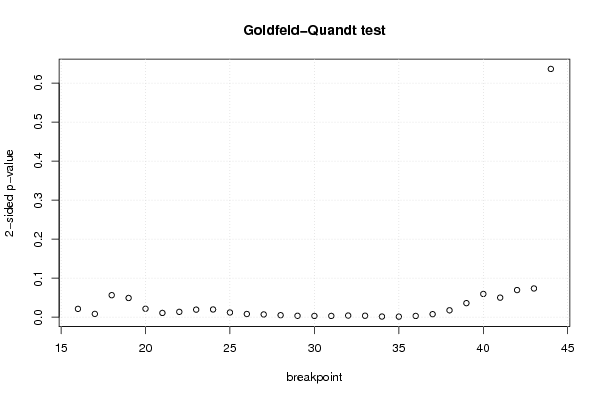
Goldfeld-Quandt test for Heteroskedasticity
p-valuesAlternative Hypothesis
breakpoint indexgreater2-sidedless
160.010706370544170.02141274108833990.98929362945583
170.00427297141882710.00854594283765420.995727028581173
180.02825739432004390.05651478864008780.971742605679956
190.02467078342926190.04934156685852380.975329216570738
200.0108978143593190.0217956287186380.989102185640681
210.005537543934407480.0110750878688150.994462456065592
220.006890361957447920.01378072391489580.993109638042552
230.009726673303195170.01945334660639030.990273326696805
240.009968363478563420.01993672695712680.990031636521437
250.006108078604944010.0122161572098880.993891921395056
260.004156418375282570.008312836750565140.995843581624717
270.003588065126240070.007176130252480140.99641193487376
280.002607511763935660.005215023527871310.997392488236064
290.001855453697271680.003710907394543360.998144546302728
300.001704845504663770.003409691009327540.998295154495336
310.001694390136662510.003388780273325030.998305609863337
320.002162154151461230.004324308302922460.997837845848539
330.001910565991133890.003821131982267780.998089434008866
340.0008985455566742510.00179709111334850.999101454443326
350.0007561100022688750.001512220004537750.999243889997731
360.001658436469513310.003316872939026630.998341563530487
370.003906061425951680.007812122851903370.996093938574048
380.008907281938198330.01781456387639670.991092718061802
390.01805004223183130.03610008446366260.981949957768169
400.02983190171595960.05966380343191920.97016809828404
410.02509482668934220.05018965337868440.974905173310658
420.03484152389313140.06968304778626270.965158476106869
430.0368615891259410.0737231782518820.963138410874059
440.6818750493732940.6362499012534120.318124950626706

\begin{tabular}{lllllllll}
\hline
Goldfeld-Quandt test for Heteroskedasticity \tabularnewline
p-values & Alternative Hypothesis \tabularnewline
breakpoint index & greater & 2-sided & less \tabularnewline
16 & 0.01070637054417 & 0.0214127410883399 & 0.98929362945583 \tabularnewline
17 & 0.0042729714188271 & 0.0085459428376542 & 0.995727028581173 \tabularnewline
18 & 0.0282573943200439 & 0.0565147886400878 & 0.971742605679956 \tabularnewline
19 & 0.0246707834292619 & 0.0493415668585238 & 0.975329216570738 \tabularnewline
20 & 0.010897814359319 & 0.021795628718638 & 0.989102185640681 \tabularnewline
21 & 0.00553754393440748 & 0.011075087868815 & 0.994462456065592 \tabularnewline
22 & 0.00689036195744792 & 0.0137807239148958 & 0.993109638042552 \tabularnewline
23 & 0.00972667330319517 & 0.0194533466063903 & 0.990273326696805 \tabularnewline
24 & 0.00996836347856342 & 0.0199367269571268 & 0.990031636521437 \tabularnewline
25 & 0.00610807860494401 & 0.012216157209888 & 0.993891921395056 \tabularnewline
26 & 0.00415641837528257 & 0.00831283675056514 & 0.995843581624717 \tabularnewline
27 & 0.00358806512624007 & 0.00717613025248014 & 0.99641193487376 \tabularnewline
28 & 0.00260751176393566 & 0.00521502352787131 & 0.997392488236064 \tabularnewline
29 & 0.00185545369727168 & 0.00371090739454336 & 0.998144546302728 \tabularnewline
30 & 0.00170484550466377 & 0.00340969100932754 & 0.998295154495336 \tabularnewline
31 & 0.00169439013666251 & 0.00338878027332503 & 0.998305609863337 \tabularnewline
32 & 0.00216215415146123 & 0.00432430830292246 & 0.997837845848539 \tabularnewline
33 & 0.00191056599113389 & 0.00382113198226778 & 0.998089434008866 \tabularnewline
34 & 0.000898545556674251 & 0.0017970911133485 & 0.999101454443326 \tabularnewline
35 & 0.000756110002268875 & 0.00151222000453775 & 0.999243889997731 \tabularnewline
36 & 0.00165843646951331 & 0.00331687293902663 & 0.998341563530487 \tabularnewline
37 & 0.00390606142595168 & 0.00781212285190337 & 0.996093938574048 \tabularnewline
38 & 0.00890728193819833 & 0.0178145638763967 & 0.991092718061802 \tabularnewline
39 & 0.0180500422318313 & 0.0361000844636626 & 0.981949957768169 \tabularnewline
40 & 0.0298319017159596 & 0.0596638034319192 & 0.97016809828404 \tabularnewline
41 & 0.0250948266893422 & 0.0501896533786844 & 0.974905173310658 \tabularnewline
42 & 0.0348415238931314 & 0.0696830477862627 & 0.965158476106869 \tabularnewline
43 & 0.036861589125941 & 0.073723178251882 & 0.963138410874059 \tabularnewline
44 & 0.681875049373294 & 0.636249901253412 & 0.318124950626706 \tabularnewline
\hline
\end{tabular}
%Source: https://freestatistics.org/blog/index.php?pk=147838&T=5

[TABLE]
[ROW][C]Goldfeld-Quandt test for Heteroskedasticity[/C][/ROW]
[ROW][C]p-values[/C][C]Alternative Hypothesis[/C][/ROW]
[ROW][C]breakpoint index[/C][C]greater[/C][C]2-sided[/C][C]less[/C][/ROW]
[ROW][C]16[/C][C]0.01070637054417[/C][C]0.0214127410883399[/C][C]0.98929362945583[/C][/ROW]
[ROW][C]17[/C][C]0.0042729714188271[/C][C]0.0085459428376542[/C][C]0.995727028581173[/C][/ROW]
[ROW][C]18[/C][C]0.0282573943200439[/C][C]0.0565147886400878[/C][C]0.971742605679956[/C][/ROW]
[ROW][C]19[/C][C]0.0246707834292619[/C][C]0.0493415668585238[/C][C]0.975329216570738[/C][/ROW]
[ROW][C]20[/C][C]0.010897814359319[/C][C]0.021795628718638[/C][C]0.989102185640681[/C][/ROW]
[ROW][C]21[/C][C]0.00553754393440748[/C][C]0.011075087868815[/C][C]0.994462456065592[/C][/ROW]
[ROW][C]22[/C][C]0.00689036195744792[/C][C]0.0137807239148958[/C][C]0.993109638042552[/C][/ROW]
[ROW][C]23[/C][C]0.00972667330319517[/C][C]0.0194533466063903[/C][C]0.990273326696805[/C][/ROW]
[ROW][C]24[/C][C]0.00996836347856342[/C][C]0.0199367269571268[/C][C]0.990031636521437[/C][/ROW]
[ROW][C]25[/C][C]0.00610807860494401[/C][C]0.012216157209888[/C][C]0.993891921395056[/C][/ROW]
[ROW][C]26[/C][C]0.00415641837528257[/C][C]0.00831283675056514[/C][C]0.995843581624717[/C][/ROW]
[ROW][C]27[/C][C]0.00358806512624007[/C][C]0.00717613025248014[/C][C]0.99641193487376[/C][/ROW]
[ROW][C]28[/C][C]0.00260751176393566[/C][C]0.00521502352787131[/C][C]0.997392488236064[/C][/ROW]
[ROW][C]29[/C][C]0.00185545369727168[/C][C]0.00371090739454336[/C][C]0.998144546302728[/C][/ROW]
[ROW][C]30[/C][C]0.00170484550466377[/C][C]0.00340969100932754[/C][C]0.998295154495336[/C][/ROW]
[ROW][C]31[/C][C]0.00169439013666251[/C][C]0.00338878027332503[/C][C]0.998305609863337[/C][/ROW]
[ROW][C]32[/C][C]0.00216215415146123[/C][C]0.00432430830292246[/C][C]0.997837845848539[/C][/ROW]
[ROW][C]33[/C][C]0.00191056599113389[/C][C]0.00382113198226778[/C][C]0.998089434008866[/C][/ROW]
[ROW][C]34[/C][C]0.000898545556674251[/C][C]0.0017970911133485[/C][C]0.999101454443326[/C][/ROW]
[ROW][C]35[/C][C]0.000756110002268875[/C][C]0.00151222000453775[/C][C]0.999243889997731[/C][/ROW]
[ROW][C]36[/C][C]0.00165843646951331[/C][C]0.00331687293902663[/C][C]0.998341563530487[/C][/ROW]
[ROW][C]37[/C][C]0.00390606142595168[/C][C]0.00781212285190337[/C][C]0.996093938574048[/C][/ROW]
[ROW][C]38[/C][C]0.00890728193819833[/C][C]0.0178145638763967[/C][C]0.991092718061802[/C][/ROW]
[ROW][C]39[/C][C]0.0180500422318313[/C][C]0.0361000844636626[/C][C]0.981949957768169[/C][/ROW]
[ROW][C]40[/C][C]0.0298319017159596[/C][C]0.0596638034319192[/C][C]0.97016809828404[/C][/ROW]
[ROW][C]41[/C][C]0.0250948266893422[/C][C]0.0501896533786844[/C][C]0.974905173310658[/C][/ROW]
[ROW][C]42[/C][C]0.0348415238931314[/C][C]0.0696830477862627[/C][C]0.965158476106869[/C][/ROW]
[ROW][C]43[/C][C]0.036861589125941[/C][C]0.073723178251882[/C][C]0.963138410874059[/C][/ROW]
[ROW][C]44[/C][C]0.681875049373294[/C][C]0.636249901253412[/C][C]0.318124950626706[/C][/ROW]
[/TABLE]
Source: https://freestatistics.org/blog/index.php?pk=147838&T=5

Globally Unique Identifier (entire table): ba.freestatistics.org/blog/index.php?pk=147838&T=5

As an alternative you can also use a QR Code:  

The GUIDs for individual cells are displayed in the table below:

Goldfeld-Quandt test for Heteroskedasticity
p-valuesAlternative Hypothesis
breakpoint indexgreater2-sidedless
160.010706370544170.02141274108833990.98929362945583
170.00427297141882710.00854594283765420.995727028581173
180.02825739432004390.05651478864008780.971742605679956
190.02467078342926190.04934156685852380.975329216570738
200.0108978143593190.0217956287186380.989102185640681
210.005537543934407480.0110750878688150.994462456065592
220.006890361957447920.01378072391489580.993109638042552
230.009726673303195170.01945334660639030.990273326696805
240.009968363478563420.01993672695712680.990031636521437
250.006108078604944010.0122161572098880.993891921395056
260.004156418375282570.008312836750565140.995843581624717
270.003588065126240070.007176130252480140.99641193487376
280.002607511763935660.005215023527871310.997392488236064
290.001855453697271680.003710907394543360.998144546302728
300.001704845504663770.003409691009327540.998295154495336
310.001694390136662510.003388780273325030.998305609863337
320.002162154151461230.004324308302922460.997837845848539
330.001910565991133890.003821131982267780.998089434008866
340.0008985455566742510.00179709111334850.999101454443326
350.0007561100022688750.001512220004537750.999243889997731
360.001658436469513310.003316872939026630.998341563530487
370.003906061425951680.007812122851903370.996093938574048
380.008907281938198330.01781456387639670.991092718061802
390.01805004223183130.03610008446366260.981949957768169
400.02983190171595960.05966380343191920.97016809828404
410.02509482668934220.05018965337868440.974905173310658
420.03484152389313140.06968304778626270.965158476106869
430.0368615891259410.0737231782518820.963138410874059
440.6818750493732940.6362499012534120.318124950626706


Meta Analysis of Goldfeld-Quandt test for Heteroskedasticity
Description# significant tests% significant testsOK/NOK
1% type I error level130.448275862068966NOK
5% type I error level230.793103448275862NOK
10% type I error level280.96551724137931NOK

\begin{tabular}{lllllllll}
\hline
Meta Analysis of Goldfeld-Quandt test for Heteroskedasticity \tabularnewline
Description & # significant tests & % significant tests & OK/NOK \tabularnewline
1% type I error level & 13 & 0.448275862068966 & NOK \tabularnewline
5% type I error level & 23 & 0.793103448275862 & NOK \tabularnewline
10% type I error level & 28 & 0.96551724137931 & NOK \tabularnewline
\hline
\end{tabular}
%Source: https://freestatistics.org/blog/index.php?pk=147838&T=6

[TABLE]
[ROW][C]Meta Analysis of Goldfeld-Quandt test for Heteroskedasticity[/C][/ROW]
[ROW][C]Description[/C][C]# significant tests[/C][C]% significant tests[/C][C]OK/NOK[/C][/ROW]
[ROW][C]1% type I error level[/C][C]13[/C][C]0.448275862068966[/C][C]NOK[/C][/ROW]
[ROW][C]5% type I error level[/C][C]23[/C][C]0.793103448275862[/C][C]NOK[/C][/ROW]
[ROW][C]10% type I error level[/C][C]28[/C][C]0.96551724137931[/C][C]NOK[/C][/ROW]
[/TABLE]
Source: https://freestatistics.org/blog/index.php?pk=147838&T=6

Globally Unique Identifier (entire table): ba.freestatistics.org/blog/index.php?pk=147838&T=6

As an alternative you can also use a QR Code:  

The GUIDs for individual cells are displayed in the table below:

Meta Analysis of Goldfeld-Quandt test for Heteroskedasticity
Description# significant tests% significant testsOK/NOK
1% type I error level130.448275862068966NOK
5% type I error level230.793103448275862NOK
10% type I error level280.96551724137931NOK


Parameters (Session):
par1 = 1 ; par2 = Include Monthly Dummies ; par3 = Linear Trend ;
Parameters (R input):
par1 = 1 ; par2 = Include Monthly Dummies ; par3 = Linear Trend ;
R code (references can be found in the software module):
library(lattice)
library(lmtest)
n25 <- 25 #minimum number of obs. for Goldfeld-Quandt test
par1 <- as.numeric(par1)
x <- t(y)
k <- length(x[1,])
n <- length(x[,1])
x1 <- cbind(x[,par1], x[,1:k!=par1])
mycolnames <- c(colnames(x)[par1], colnames(x)[1:k!=par1])
colnames(x1) <- mycolnames #colnames(x)[par1]
x <- x1
if (par3 == 'First Differences'){
x2 <- array(0, dim=c(n-1,k), dimnames=list(1:(n-1), paste('(1-B)',colnames(x),sep='')))
for (i in 1:n-1) {
for (j in 1:k) {
x2[i,j] <- x[i+1,j] - x[i,j]
}
}
x <- x2
}
if (par2 == 'Include Monthly Dummies'){
x2 <- array(0, dim=c(n,11), dimnames=list(1:n, paste('M', seq(1:11), sep ='')))
for (i in 1:11){
x2[seq(i,n,12),i] <- 1
}
x <- cbind(x, x2)
}
if (par2 == 'Include Quarterly Dummies'){
x2 <- array(0, dim=c(n,3), dimnames=list(1:n, paste('Q', seq(1:3), sep ='')))
for (i in 1:3){
x2[seq(i,n,4),i] <- 1
}
x <- cbind(x, x2)
}
k <- length(x[1,])
if (par3 == 'Linear Trend'){
x <- cbind(x, c(1:n))
colnames(x)[k+1] <- 't'
}
x
k <- length(x[1,])
df <- as.data.frame(x)
(mylm <- lm(df))
(mysum <- summary(mylm))
if (n > n25) {
kp3 <- k + 3
nmkm3 <- n - k - 3
gqarr <- array(NA, dim=c(nmkm3-kp3+1,3))
numgqtests <- 0
numsignificant1 <- 0
numsignificant5 <- 0
numsignificant10 <- 0
for (mypoint in kp3:nmkm3) {
j <- 0
numgqtests <- numgqtests + 1
for (myalt in c('greater', 'two.sided', 'less')) {
j <- j + 1
gqarr[mypoint-kp3+1,j] <- gqtest(mylm, point=mypoint, alternative=myalt)$p.value
}
if (gqarr[mypoint-kp3+1,2] < 0.01) numsignificant1 <- numsignificant1 + 1
if (gqarr[mypoint-kp3+1,2] < 0.05) numsignificant5 <- numsignificant5 + 1
if (gqarr[mypoint-kp3+1,2] < 0.10) numsignificant10 <- numsignificant10 + 1
}
gqarr
}
bitmap(file='test0.png')
plot(x[,1], type='l', main='Actuals and Interpolation', ylab='value of Actuals and Interpolation (dots)', xlab='time or index')
points(x[,1]-mysum$resid)
grid()
dev.off()
bitmap(file='test1.png')
plot(mysum$resid, type='b', pch=19, main='Residuals', ylab='value of Residuals', xlab='time or index')
grid()
dev.off()
bitmap(file='test2.png')
hist(mysum$resid, main='Residual Histogram', xlab='values of Residuals')
grid()
dev.off()
bitmap(file='test3.png')
densityplot(~mysum$resid,col='black',main='Residual Density Plot', xlab='values of Residuals')
dev.off()
bitmap(file='test4.png')
qqnorm(mysum$resid, main='Residual Normal Q-Q Plot')
qqline(mysum$resid)
grid()
dev.off()
(myerror <- as.ts(mysum$resid))
bitmap(file='test5.png')
dum <- cbind(lag(myerror,k=1),myerror)
dum
dum1 <- dum[2:length(myerror),]
dum1
z <- as.data.frame(dum1)
z
plot(z,main=paste('Residual Lag plot, lowess, and regression line'), ylab='values of Residuals', xlab='lagged values of Residuals')
lines(lowess(z))
abline(lm(z))
grid()
dev.off()
bitmap(file='test6.png')
acf(mysum$resid, lag.max=length(mysum$resid)/2, main='Residual Autocorrelation Function')
grid()
dev.off()
bitmap(file='test7.png')
pacf(mysum$resid, lag.max=length(mysum$resid)/2, main='Residual Partial Autocorrelation Function')
grid()
dev.off()
bitmap(file='test8.png')
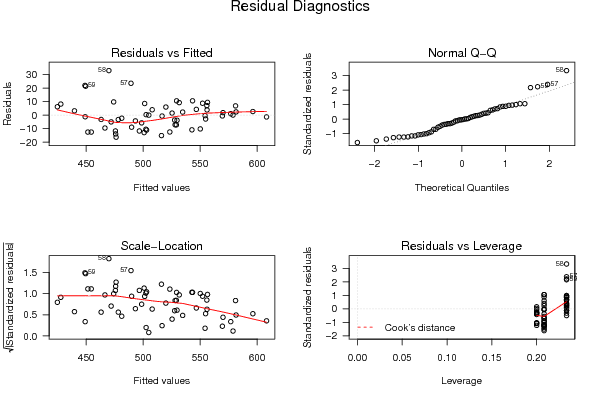
opar <- par(mfrow = c(2,2), oma = c(0, 0, 1.1, 0))
plot(mylm, las = 1, sub='Residual Diagnostics')
par(opar)
dev.off()
if (n > n25) {
bitmap(file='test9.png')
plot(kp3:nmkm3,gqarr[,2], main='Goldfeld-Quandt test',ylab='2-sided p-value',xlab='breakpoint')
grid()
dev.off()
}
load(file='createtable')
a<-table.start()
a<-table.row.start(a)
a<-table.element(a, 'Multiple Linear Regression - Estimated Regression Equation', 1, TRUE)
a<-table.row.end(a)
myeq <- colnames(x)[1]
myeq <- paste(myeq, '[t] = ', sep='')
for (i in 1:k){
if (mysum$coefficients[i,1] > 0) myeq <- paste(myeq, '+', '')
myeq <- paste(myeq, mysum$coefficients[i,1], sep=' ')
if (rownames(mysum$coefficients)[i] != '(Intercept)') {
myeq <- paste(myeq, rownames(mysum$coefficients)[i], sep='')
if (rownames(mysum$coefficients)[i] != 't') myeq <- paste(myeq, '[t]', sep='')
}
}
myeq <- paste(myeq, ' + e[t]')
a<-table.row.start(a)
a<-table.element(a, myeq)
a<-table.row.end(a)
a<-table.end(a)
table.save(a,file='mytable1.tab')
a<-table.start()
a<-table.row.start(a)
a<-table.element(a,hyperlink('ols1.htm','Multiple Linear Regression - Ordinary Least Squares',''), 6, TRUE)
a<-table.row.end(a)
a<-table.row.start(a)
a<-table.element(a,'Variable',header=TRUE)
a<-table.element(a,'Parameter',header=TRUE)
a<-table.element(a,'S.D.',header=TRUE)
a<-table.element(a,'T-STAT
H0: parameter = 0',header=TRUE)
a<-table.element(a,'2-tail p-value',header=TRUE)
a<-table.element(a,'1-tail p-value',header=TRUE)
a<-table.row.end(a)
for (i in 1:k){
a<-table.row.start(a)
a<-table.element(a,rownames(mysum$coefficients)[i],header=TRUE)
a<-table.element(a,mysum$coefficients[i,1])
a<-table.element(a, round(mysum$coefficients[i,2],6))
a<-table.element(a, round(mysum$coefficients[i,3],4))
a<-table.element(a, round(mysum$coefficients[i,4],6))
a<-table.element(a, round(mysum$coefficients[i,4]/2,6))
a<-table.row.end(a)
}
a<-table.end(a)
table.save(a,file='mytable2.tab')
a<-table.start()
a<-table.row.start(a)
a<-table.element(a, 'Multiple Linear Regression - Regression Statistics', 2, TRUE)
a<-table.row.end(a)
a<-table.row.start(a)
a<-table.element(a, 'Multiple R',1,TRUE)
a<-table.element(a, sqrt(mysum$r.squared))
a<-table.row.end(a)
a<-table.row.start(a)
a<-table.element(a, 'R-squared',1,TRUE)
a<-table.element(a, mysum$r.squared)
a<-table.row.end(a)
a<-table.row.start(a)
a<-table.element(a, 'Adjusted R-squared',1,TRUE)
a<-table.element(a, mysum$adj.r.squared)
a<-table.row.end(a)
a<-table.row.start(a)
a<-table.element(a, 'F-TEST (value)',1,TRUE)
a<-table.element(a, mysum$fstatistic[1])
a<-table.row.end(a)
a<-table.row.start(a)
a<-table.element(a, 'F-TEST (DF numerator)',1,TRUE)
a<-table.element(a, mysum$fstatistic[2])
a<-table.row.end(a)
a<-table.row.start(a)
a<-table.element(a, 'F-TEST (DF denominator)',1,TRUE)
a<-table.element(a, mysum$fstatistic[3])
a<-table.row.end(a)
a<-table.row.start(a)
a<-table.element(a, 'p-value',1,TRUE)
a<-table.element(a, 1-pf(mysum$fstatistic[1],mysum$fstatistic[2],mysum$fstatistic[3]))
a<-table.row.end(a)
a<-table.row.start(a)
a<-table.element(a, 'Multiple Linear Regression - Residual Statistics', 2, TRUE)
a<-table.row.end(a)
a<-table.row.start(a)
a<-table.element(a, 'Residual Standard Deviation',1,TRUE)
a<-table.element(a, mysum$sigma)
a<-table.row.end(a)
a<-table.row.start(a)
a<-table.element(a, 'Sum Squared Residuals',1,TRUE)
a<-table.element(a, sum(myerror*myerror))
a<-table.row.end(a)
a<-table.end(a)
table.save(a,file='mytable3.tab')
a<-table.start()
a<-table.row.start(a)
a<-table.element(a, 'Multiple Linear Regression - Actuals, Interpolation, and Residuals', 4, TRUE)
a<-table.row.end(a)
a<-table.row.start(a)
a<-table.element(a, 'Time or Index', 1, TRUE)
a<-table.element(a, 'Actuals', 1, TRUE)
a<-table.element(a, 'Interpolation
Forecast', 1, TRUE)
a<-table.element(a, 'Residuals
Prediction Error', 1, TRUE)
a<-table.row.end(a)
for (i in 1:n) {
a<-table.row.start(a)
a<-table.element(a,i, 1, TRUE)
a<-table.element(a,x[i])
a<-table.element(a,x[i]-mysum$resid[i])
a<-table.element(a,mysum$resid[i])
a<-table.row.end(a)
}
a<-table.end(a)
table.save(a,file='mytable4.tab')
if (n > n25) {
a<-table.start()
a<-table.row.start(a)
a<-table.element(a,'Goldfeld-Quandt test for Heteroskedasticity',4,TRUE)
a<-table.row.end(a)
a<-table.row.start(a)
a<-table.element(a,'p-values',header=TRUE)
a<-table.element(a,'Alternative Hypothesis',3,header=TRUE)
a<-table.row.end(a)
a<-table.row.start(a)
a<-table.element(a,'breakpoint index',header=TRUE)
a<-table.element(a,'greater',header=TRUE)
a<-table.element(a,'2-sided',header=TRUE)
a<-table.element(a,'less',header=TRUE)
a<-table.row.end(a)
for (mypoint in kp3:nmkm3) {
a<-table.row.start(a)
a<-table.element(a,mypoint,header=TRUE)
a<-table.element(a,gqarr[mypoint-kp3+1,1])
a<-table.element(a,gqarr[mypoint-kp3+1,2])
a<-table.element(a,gqarr[mypoint-kp3+1,3])
a<-table.row.end(a)
}
a<-table.end(a)
table.save(a,file='mytable5.tab')
a<-table.start()
a<-table.row.start(a)
a<-table.element(a,'Meta Analysis of Goldfeld-Quandt test for Heteroskedasticity',4,TRUE)
a<-table.row.end(a)
a<-table.row.start(a)
a<-table.element(a,'Description',header=TRUE)
a<-table.element(a,'# significant tests',header=TRUE)
a<-table.element(a,'% significant tests',header=TRUE)
a<-table.element(a,'OK/NOK',header=TRUE)
a<-table.row.end(a)
a<-table.row.start(a)
a<-table.element(a,'1% type I error level',header=TRUE)
a<-table.element(a,numsignificant1)
a<-table.element(a,numsignificant1/numgqtests)
if (numsignificant1/numgqtests < 0.01) dum <- 'OK' else dum <- 'NOK'
a<-table.element(a,dum)
a<-table.row.end(a)
a<-table.row.start(a)
a<-table.element(a,'5% type I error level',header=TRUE)
a<-table.element(a,numsignificant5)
a<-table.element(a,numsignificant5/numgqtests)
if (numsignificant5/numgqtests < 0.05) dum <- 'OK' else dum <- 'NOK'
a<-table.element(a,dum)
a<-table.row.end(a)
a<-table.row.start(a)
a<-table.element(a,'10% type I error level',header=TRUE)
a<-table.element(a,numsignificant10)
a<-table.element(a,numsignificant10/numgqtests)
if (numsignificant10/numgqtests < 0.1) dum <- 'OK' else dum <- 'NOK'
a<-table.element(a,dum)
a<-table.row.end(a)
a<-table.end(a)
table.save(a,file='mytable6.tab')
}