Free Statistics

of Irreproducible Research!

Author's title

Author*The author of this computation has been verified*
R Software Modulerwasp_multipleregression.wasp
Title produced by softwareMultiple Regression
Date of computationWed, 19 Dec 2012 20:16:00 -0500
Cite this page as followsStatistical Computations at FreeStatistics.org, Office for Research Development and Education, URL https://freestatistics.org/blog/index.php?v=date/2012/Dec/19/t1355966170s7b4o8aa0pb1ub8.htm/, Retrieved Thu, 31 Oct 2024 23:09:57 +0000
Statistical Computations at FreeStatistics.org, Office for Research Development and Education, URL https://freestatistics.org/blog/index.php?pk=202515, Retrieved Thu, 31 Oct 2024 23:09:57 +0000
QR Codes:

Original text written by user:
IsPrivate?No (this computation is public)
User-defined keywords
Estimated Impact157
Family? (F = Feedback message, R = changed R code, M = changed R Module, P = changed Parameters, D = changed Data)
-     [Two-Way ANOVA] [] [2010-11-02 14:42:14] [b98453cac15ba1066b407e146608df68]
- RMPD  [One-Way-Between-Groups ANOVA- Free Statistics Software (Calculator)] [] [2012-12-18 22:24:51] [8fb02a06fa197bf14378f27a41ead604]
- RMPD      [Multiple Regression] [] [2012-12-20 01:16:00] [fec1d01507e8c19b843fb6b1ea3b7bfc] [Current]
Feedback Forum

Post a new message
Dataseries X:
0	0
1	0
0	0
0	0
0	0
1	0
0	0
0	0
1	0
0	0
1	0
0	0
0	0
0	0
0	0
0	0
0	0
0	0
1	0
0	0
0	0
1	0
0	0
0	0
1	0
1	0
0	0
1	0
0	0
0	0
0	0
0	0
0	0
0	0
0	0
0	0
1	0
0	0
0	0
1	0
0	0
0	0
0	0
0	0
0	0
0	0
0	0
0	0
0	0
0	0
0	0
1	0
1	0
0	0
0	1
1	0
0	0
0	0
0	0
1	0
1	0
1	0
0	0
0	0
0	0
0	1
0	1
0	0


Summary of computational transaction
Raw Inputview raw input (R code)
Raw Outputview raw output of R engine
Computing time8 seconds
R Server'Gwilym Jenkins' @ jenkins.wessa.net

\begin{tabular}{lllllllll}
\hline
Summary of computational transaction \tabularnewline
Raw Input & view raw input (R code)  \tabularnewline
Raw Output & view raw output of R engine  \tabularnewline
Computing time & 8 seconds \tabularnewline
R Server & 'Gwilym Jenkins' @ jenkins.wessa.net \tabularnewline
\hline
\end{tabular}
%Source: https://freestatistics.org/blog/index.php?pk=202515&T=0

[TABLE]
[ROW][C]Summary of computational transaction[/C][/ROW]
[ROW][C]Raw Input[/C][C]view raw input (R code) [/C][/ROW]
[ROW][C]Raw Output[/C][C]view raw output of R engine [/C][/ROW]
[ROW][C]Computing time[/C][C]8 seconds[/C][/ROW]
[ROW][C]R Server[/C][C]'Gwilym Jenkins' @ jenkins.wessa.net[/C][/ROW]
[/TABLE]
Source: https://freestatistics.org/blog/index.php?pk=202515&T=0

Globally Unique Identifier (entire table): ba.freestatistics.org/blog/index.php?pk=202515&T=0

As an alternative you can also use a QR Code:  

The GUIDs for individual cells are displayed in the table below:

Summary of computational transaction
Raw Inputview raw input (R code)
Raw Outputview raw output of R engine
Computing time8 seconds
R Server'Gwilym Jenkins' @ jenkins.wessa.net


Multiple Linear Regression - Estimated Regression Equation
CorrectAnalysis[t] = -0.0522978300609722 -0.0544462108056355T20[t] + 0.00318918927017984t + e[t]

\begin{tabular}{lllllllll}
\hline
Multiple Linear Regression - Estimated Regression Equation \tabularnewline
CorrectAnalysis[t] =  -0.0522978300609722 -0.0544462108056355T20[t] +  0.00318918927017984t  + e[t] \tabularnewline
\hline
\end{tabular}
%Source: https://freestatistics.org/blog/index.php?pk=202515&T=1

[TABLE]
[ROW][C]Multiple Linear Regression - Estimated Regression Equation[/C][/ROW]
[ROW][C]CorrectAnalysis[t] =  -0.0522978300609722 -0.0544462108056355T20[t] +  0.00318918927017984t  + e[t][/C][/ROW]
[/TABLE]
Source: https://freestatistics.org/blog/index.php?pk=202515&T=1

Globally Unique Identifier (entire table): ba.freestatistics.org/blog/index.php?pk=202515&T=1

As an alternative you can also use a QR Code:  

The GUIDs for individual cells are displayed in the table below:

Multiple Linear Regression - Estimated Regression Equation
CorrectAnalysis[t] = -0.0522978300609722 -0.0544462108056355T20[t] + 0.00318918927017984t + e[t]


Multiple Linear Regression - Ordinary Least Squares
VariableParameterS.D.T-STATH0: parameter = 02-tail p-value1-tail p-value
(Intercept)-0.05229783006097220.050955-1.02640.3085290.154264
T20-0.05444621080563550.055575-0.97970.3308730.165437
t0.003189189270179840.0012262.60120.0114910.005746

\begin{tabular}{lllllllll}
\hline
Multiple Linear Regression - Ordinary Least Squares \tabularnewline
Variable & Parameter & S.D. & T-STATH0: parameter = 0 & 2-tail p-value & 1-tail p-value \tabularnewline
(Intercept) & -0.0522978300609722 & 0.050955 & -1.0264 & 0.308529 & 0.154264 \tabularnewline
T20 & -0.0544462108056355 & 0.055575 & -0.9797 & 0.330873 & 0.165437 \tabularnewline
t & 0.00318918927017984 & 0.001226 & 2.6012 & 0.011491 & 0.005746 \tabularnewline
\hline
\end{tabular}
%Source: https://freestatistics.org/blog/index.php?pk=202515&T=2

[TABLE]
[ROW][C]Multiple Linear Regression - Ordinary Least Squares[/C][/ROW]
[ROW][C]Variable[/C][C]Parameter[/C][C]S.D.[/C][C]T-STATH0: parameter = 0[/C][C]2-tail p-value[/C][C]1-tail p-value[/C][/ROW]
[ROW][C](Intercept)[/C][C]-0.0522978300609722[/C][C]0.050955[/C][C]-1.0264[/C][C]0.308529[/C][C]0.154264[/C][/ROW]
[ROW][C]T20[/C][C]-0.0544462108056355[/C][C]0.055575[/C][C]-0.9797[/C][C]0.330873[/C][C]0.165437[/C][/ROW]
[ROW][C]t[/C][C]0.00318918927017984[/C][C]0.001226[/C][C]2.6012[/C][C]0.011491[/C][C]0.005746[/C][/ROW]
[/TABLE]
Source: https://freestatistics.org/blog/index.php?pk=202515&T=2

Globally Unique Identifier (entire table): ba.freestatistics.org/blog/index.php?pk=202515&T=2

As an alternative you can also use a QR Code:  

The GUIDs for individual cells are displayed in the table below:

Multiple Linear Regression - Ordinary Least Squares
VariableParameterS.D.T-STATH0: parameter = 02-tail p-value1-tail p-value
(Intercept)-0.05229783006097220.050955-1.02640.3085290.154264
T20-0.05444621080563550.055575-0.97970.3308730.165437
t0.003189189270179840.0012262.60120.0114910.005746


Multiple Linear Regression - Regression Statistics
Multiple R0.328959808140758
R-squared0.108214555372004
Adjusted R-squared0.0807750032296043
F-TEST (value)3.94374349881571
F-TEST (DF numerator)2
F-TEST (DF denominator)65
p-value0.0241803364729842
Multiple Linear Regression - Residual Statistics
Residual Standard Deviation0.198351898146436
Sum Squared Residuals2.55732590738911

\begin{tabular}{lllllllll}
\hline
Multiple Linear Regression - Regression Statistics \tabularnewline
Multiple R & 0.328959808140758 \tabularnewline
R-squared & 0.108214555372004 \tabularnewline
Adjusted R-squared & 0.0807750032296043 \tabularnewline
F-TEST (value) & 3.94374349881571 \tabularnewline
F-TEST (DF numerator) & 2 \tabularnewline
F-TEST (DF denominator) & 65 \tabularnewline
p-value & 0.0241803364729842 \tabularnewline
Multiple Linear Regression - Residual Statistics \tabularnewline
Residual Standard Deviation & 0.198351898146436 \tabularnewline
Sum Squared Residuals & 2.55732590738911 \tabularnewline
\hline
\end{tabular}
%Source: https://freestatistics.org/blog/index.php?pk=202515&T=3

[TABLE]
[ROW][C]Multiple Linear Regression - Regression Statistics[/C][/ROW]
[ROW][C]Multiple R[/C][C]0.328959808140758[/C][/ROW]
[ROW][C]R-squared[/C][C]0.108214555372004[/C][/ROW]
[ROW][C]Adjusted R-squared[/C][C]0.0807750032296043[/C][/ROW]
[ROW][C]F-TEST (value)[/C][C]3.94374349881571[/C][/ROW]
[ROW][C]F-TEST (DF numerator)[/C][C]2[/C][/ROW]
[ROW][C]F-TEST (DF denominator)[/C][C]65[/C][/ROW]
[ROW][C]p-value[/C][C]0.0241803364729842[/C][/ROW]
[ROW][C]Multiple Linear Regression - Residual Statistics[/C][/ROW]
[ROW][C]Residual Standard Deviation[/C][C]0.198351898146436[/C][/ROW]
[ROW][C]Sum Squared Residuals[/C][C]2.55732590738911[/C][/ROW]
[/TABLE]
Source: https://freestatistics.org/blog/index.php?pk=202515&T=3

Globally Unique Identifier (entire table): ba.freestatistics.org/blog/index.php?pk=202515&T=3

As an alternative you can also use a QR Code:  

The GUIDs for individual cells are displayed in the table below:

Multiple Linear Regression - Regression Statistics
Multiple R0.328959808140758
R-squared0.108214555372004
Adjusted R-squared0.0807750032296043
F-TEST (value)3.94374349881571
F-TEST (DF numerator)2
F-TEST (DF denominator)65
p-value0.0241803364729842
Multiple Linear Regression - Residual Statistics
Residual Standard Deviation0.198351898146436
Sum Squared Residuals2.55732590738911


Multiple Linear Regression - Actuals, Interpolation, and Residuals
Time or IndexActualsInterpolationForecastResidualsPrediction Error
10-0.04910864079079230.0491086407907923
20-0.1003656623262480.100365662326248
30-0.04273026225043270.0427302622504327
40-0.03954107298025280.0395410729802528
50-0.0363518837100730.036351883710073
60-0.08760890524552870.0876089052455287
70-0.02997350516971330.0299735051697133
80-0.02678431589953350.0267843158995335
90-0.07804133743498910.0780413374349891
100-0.02040593735917380.0204059373591738
110-0.07166295889462940.0716629588946294
120-0.01402755881881410.0140275588188141
130-0.01083836954863420.0108383695486342
140-0.007649180278454410.00764918027845441
150-0.004459991008274560.00445999100827456
160-0.001270801738094720.00127080173809472
1700.00191838753208512-0.00191838753208512
1800.00510757680226497-0.00510757680226497
190-0.04614944473319070.0461494447331907
2000.0114859553426247-0.0114859553426247
2100.0146751446128045-0.0146751446128045
220-0.03658187692265110.0365818769226511
2300.0210535231531642-0.0210535231531642
2400.024242712423344-0.024242712423344
250-0.02701430911211160.0270143091121116
260-0.02382511984193180.0238251198419318
2700.0338102802338836-0.0338102802338836
280-0.01744674130157210.0174467413015721
2900.0401886587742433-0.0401886587742433
3000.0433778480444231-0.0433778480444231
3100.046567037314603-0.046567037314603
3200.0497562265847828-0.0497562265847828
3300.0529454158549626-0.0529454158549626
3400.0561346051251425-0.0561346051251425
3500.0593237943953223-0.0593237943953223
3600.0625129836655022-0.0625129836655022
3700.0112559621300465-0.0112559621300465
3800.0688913622058619-0.0688913622058619
3900.0720805514760417-0.0720805514760417
4000.020823529940586-0.020823529940586
4100.0784589300164014-0.0784589300164014
4200.0816481192865812-0.0816481192865812
4300.0848373085567611-0.0848373085567611
4400.0880264978269409-0.0880264978269409
4500.0912156870971208-0.0912156870971208
4600.0944048763673006-0.0944048763673006
4700.0975940656374805-0.0975940656374805
4800.10078325490766-0.10078325490766
4900.10397244417784-0.10397244417784
5000.10716163344802-0.10716163344802
5100.1103508227182-0.1103508227182
5200.0590938011827442-0.0590938011827442
5300.062282990452924-0.062282990452924
5400.119918390528739-0.119918390528739
5510.1231075797989190.876892420201081
5600.0718505582634636-0.0718505582634636
5700.129485958339279-0.129485958339279
5800.132675147609459-0.132675147609459
5900.135864336879639-0.135864336879639
6000.0846073153441829-0.0846073153441829
6100.0877965046143628-0.0877965046143628
6200.0909856938845426-0.0909856938845426
6300.148621093960358-0.148621093960358
6400.151810283230538-0.151810283230538
6500.154999472500718-0.154999472500718
6610.1581886617708970.841811338229103
6710.1613778510410770.838622148958923
6800.164567040311257-0.164567040311257

\begin{tabular}{lllllllll}
\hline
Multiple Linear Regression - Actuals, Interpolation, and Residuals \tabularnewline
Time or Index & Actuals & InterpolationForecast & ResidualsPrediction Error \tabularnewline
1 & 0 & -0.0491086407907923 & 0.0491086407907923 \tabularnewline
2 & 0 & -0.100365662326248 & 0.100365662326248 \tabularnewline
3 & 0 & -0.0427302622504327 & 0.0427302622504327 \tabularnewline
4 & 0 & -0.0395410729802528 & 0.0395410729802528 \tabularnewline
5 & 0 & -0.036351883710073 & 0.036351883710073 \tabularnewline
6 & 0 & -0.0876089052455287 & 0.0876089052455287 \tabularnewline
7 & 0 & -0.0299735051697133 & 0.0299735051697133 \tabularnewline
8 & 0 & -0.0267843158995335 & 0.0267843158995335 \tabularnewline
9 & 0 & -0.0780413374349891 & 0.0780413374349891 \tabularnewline
10 & 0 & -0.0204059373591738 & 0.0204059373591738 \tabularnewline
11 & 0 & -0.0716629588946294 & 0.0716629588946294 \tabularnewline
12 & 0 & -0.0140275588188141 & 0.0140275588188141 \tabularnewline
13 & 0 & -0.0108383695486342 & 0.0108383695486342 \tabularnewline
14 & 0 & -0.00764918027845441 & 0.00764918027845441 \tabularnewline
15 & 0 & -0.00445999100827456 & 0.00445999100827456 \tabularnewline
16 & 0 & -0.00127080173809472 & 0.00127080173809472 \tabularnewline
17 & 0 & 0.00191838753208512 & -0.00191838753208512 \tabularnewline
18 & 0 & 0.00510757680226497 & -0.00510757680226497 \tabularnewline
19 & 0 & -0.0461494447331907 & 0.0461494447331907 \tabularnewline
20 & 0 & 0.0114859553426247 & -0.0114859553426247 \tabularnewline
21 & 0 & 0.0146751446128045 & -0.0146751446128045 \tabularnewline
22 & 0 & -0.0365818769226511 & 0.0365818769226511 \tabularnewline
23 & 0 & 0.0210535231531642 & -0.0210535231531642 \tabularnewline
24 & 0 & 0.024242712423344 & -0.024242712423344 \tabularnewline
25 & 0 & -0.0270143091121116 & 0.0270143091121116 \tabularnewline
26 & 0 & -0.0238251198419318 & 0.0238251198419318 \tabularnewline
27 & 0 & 0.0338102802338836 & -0.0338102802338836 \tabularnewline
28 & 0 & -0.0174467413015721 & 0.0174467413015721 \tabularnewline
29 & 0 & 0.0401886587742433 & -0.0401886587742433 \tabularnewline
30 & 0 & 0.0433778480444231 & -0.0433778480444231 \tabularnewline
31 & 0 & 0.046567037314603 & -0.046567037314603 \tabularnewline
32 & 0 & 0.0497562265847828 & -0.0497562265847828 \tabularnewline
33 & 0 & 0.0529454158549626 & -0.0529454158549626 \tabularnewline
34 & 0 & 0.0561346051251425 & -0.0561346051251425 \tabularnewline
35 & 0 & 0.0593237943953223 & -0.0593237943953223 \tabularnewline
36 & 0 & 0.0625129836655022 & -0.0625129836655022 \tabularnewline
37 & 0 & 0.0112559621300465 & -0.0112559621300465 \tabularnewline
38 & 0 & 0.0688913622058619 & -0.0688913622058619 \tabularnewline
39 & 0 & 0.0720805514760417 & -0.0720805514760417 \tabularnewline
40 & 0 & 0.020823529940586 & -0.020823529940586 \tabularnewline
41 & 0 & 0.0784589300164014 & -0.0784589300164014 \tabularnewline
42 & 0 & 0.0816481192865812 & -0.0816481192865812 \tabularnewline
43 & 0 & 0.0848373085567611 & -0.0848373085567611 \tabularnewline
44 & 0 & 0.0880264978269409 & -0.0880264978269409 \tabularnewline
45 & 0 & 0.0912156870971208 & -0.0912156870971208 \tabularnewline
46 & 0 & 0.0944048763673006 & -0.0944048763673006 \tabularnewline
47 & 0 & 0.0975940656374805 & -0.0975940656374805 \tabularnewline
48 & 0 & 0.10078325490766 & -0.10078325490766 \tabularnewline
49 & 0 & 0.10397244417784 & -0.10397244417784 \tabularnewline
50 & 0 & 0.10716163344802 & -0.10716163344802 \tabularnewline
51 & 0 & 0.1103508227182 & -0.1103508227182 \tabularnewline
52 & 0 & 0.0590938011827442 & -0.0590938011827442 \tabularnewline
53 & 0 & 0.062282990452924 & -0.062282990452924 \tabularnewline
54 & 0 & 0.119918390528739 & -0.119918390528739 \tabularnewline
55 & 1 & 0.123107579798919 & 0.876892420201081 \tabularnewline
56 & 0 & 0.0718505582634636 & -0.0718505582634636 \tabularnewline
57 & 0 & 0.129485958339279 & -0.129485958339279 \tabularnewline
58 & 0 & 0.132675147609459 & -0.132675147609459 \tabularnewline
59 & 0 & 0.135864336879639 & -0.135864336879639 \tabularnewline
60 & 0 & 0.0846073153441829 & -0.0846073153441829 \tabularnewline
61 & 0 & 0.0877965046143628 & -0.0877965046143628 \tabularnewline
62 & 0 & 0.0909856938845426 & -0.0909856938845426 \tabularnewline
63 & 0 & 0.148621093960358 & -0.148621093960358 \tabularnewline
64 & 0 & 0.151810283230538 & -0.151810283230538 \tabularnewline
65 & 0 & 0.154999472500718 & -0.154999472500718 \tabularnewline
66 & 1 & 0.158188661770897 & 0.841811338229103 \tabularnewline
67 & 1 & 0.161377851041077 & 0.838622148958923 \tabularnewline
68 & 0 & 0.164567040311257 & -0.164567040311257 \tabularnewline
\hline
\end{tabular}
%Source: https://freestatistics.org/blog/index.php?pk=202515&T=4

[TABLE]
[ROW][C]Multiple Linear Regression - Actuals, Interpolation, and Residuals[/C][/ROW]
[ROW][C]Time or Index[/C][C]Actuals[/C][C]InterpolationForecast[/C][C]ResidualsPrediction Error[/C][/ROW]
[ROW][C]1[/C][C]0[/C][C]-0.0491086407907923[/C][C]0.0491086407907923[/C][/ROW]
[ROW][C]2[/C][C]0[/C][C]-0.100365662326248[/C][C]0.100365662326248[/C][/ROW]
[ROW][C]3[/C][C]0[/C][C]-0.0427302622504327[/C][C]0.0427302622504327[/C][/ROW]
[ROW][C]4[/C][C]0[/C][C]-0.0395410729802528[/C][C]0.0395410729802528[/C][/ROW]
[ROW][C]5[/C][C]0[/C][C]-0.036351883710073[/C][C]0.036351883710073[/C][/ROW]
[ROW][C]6[/C][C]0[/C][C]-0.0876089052455287[/C][C]0.0876089052455287[/C][/ROW]
[ROW][C]7[/C][C]0[/C][C]-0.0299735051697133[/C][C]0.0299735051697133[/C][/ROW]
[ROW][C]8[/C][C]0[/C][C]-0.0267843158995335[/C][C]0.0267843158995335[/C][/ROW]
[ROW][C]9[/C][C]0[/C][C]-0.0780413374349891[/C][C]0.0780413374349891[/C][/ROW]
[ROW][C]10[/C][C]0[/C][C]-0.0204059373591738[/C][C]0.0204059373591738[/C][/ROW]
[ROW][C]11[/C][C]0[/C][C]-0.0716629588946294[/C][C]0.0716629588946294[/C][/ROW]
[ROW][C]12[/C][C]0[/C][C]-0.0140275588188141[/C][C]0.0140275588188141[/C][/ROW]
[ROW][C]13[/C][C]0[/C][C]-0.0108383695486342[/C][C]0.0108383695486342[/C][/ROW]
[ROW][C]14[/C][C]0[/C][C]-0.00764918027845441[/C][C]0.00764918027845441[/C][/ROW]
[ROW][C]15[/C][C]0[/C][C]-0.00445999100827456[/C][C]0.00445999100827456[/C][/ROW]
[ROW][C]16[/C][C]0[/C][C]-0.00127080173809472[/C][C]0.00127080173809472[/C][/ROW]
[ROW][C]17[/C][C]0[/C][C]0.00191838753208512[/C][C]-0.00191838753208512[/C][/ROW]
[ROW][C]18[/C][C]0[/C][C]0.00510757680226497[/C][C]-0.00510757680226497[/C][/ROW]
[ROW][C]19[/C][C]0[/C][C]-0.0461494447331907[/C][C]0.0461494447331907[/C][/ROW]
[ROW][C]20[/C][C]0[/C][C]0.0114859553426247[/C][C]-0.0114859553426247[/C][/ROW]
[ROW][C]21[/C][C]0[/C][C]0.0146751446128045[/C][C]-0.0146751446128045[/C][/ROW]
[ROW][C]22[/C][C]0[/C][C]-0.0365818769226511[/C][C]0.0365818769226511[/C][/ROW]
[ROW][C]23[/C][C]0[/C][C]0.0210535231531642[/C][C]-0.0210535231531642[/C][/ROW]
[ROW][C]24[/C][C]0[/C][C]0.024242712423344[/C][C]-0.024242712423344[/C][/ROW]
[ROW][C]25[/C][C]0[/C][C]-0.0270143091121116[/C][C]0.0270143091121116[/C][/ROW]
[ROW][C]26[/C][C]0[/C][C]-0.0238251198419318[/C][C]0.0238251198419318[/C][/ROW]
[ROW][C]27[/C][C]0[/C][C]0.0338102802338836[/C][C]-0.0338102802338836[/C][/ROW]
[ROW][C]28[/C][C]0[/C][C]-0.0174467413015721[/C][C]0.0174467413015721[/C][/ROW]
[ROW][C]29[/C][C]0[/C][C]0.0401886587742433[/C][C]-0.0401886587742433[/C][/ROW]
[ROW][C]30[/C][C]0[/C][C]0.0433778480444231[/C][C]-0.0433778480444231[/C][/ROW]
[ROW][C]31[/C][C]0[/C][C]0.046567037314603[/C][C]-0.046567037314603[/C][/ROW]
[ROW][C]32[/C][C]0[/C][C]0.0497562265847828[/C][C]-0.0497562265847828[/C][/ROW]
[ROW][C]33[/C][C]0[/C][C]0.0529454158549626[/C][C]-0.0529454158549626[/C][/ROW]
[ROW][C]34[/C][C]0[/C][C]0.0561346051251425[/C][C]-0.0561346051251425[/C][/ROW]
[ROW][C]35[/C][C]0[/C][C]0.0593237943953223[/C][C]-0.0593237943953223[/C][/ROW]
[ROW][C]36[/C][C]0[/C][C]0.0625129836655022[/C][C]-0.0625129836655022[/C][/ROW]
[ROW][C]37[/C][C]0[/C][C]0.0112559621300465[/C][C]-0.0112559621300465[/C][/ROW]
[ROW][C]38[/C][C]0[/C][C]0.0688913622058619[/C][C]-0.0688913622058619[/C][/ROW]
[ROW][C]39[/C][C]0[/C][C]0.0720805514760417[/C][C]-0.0720805514760417[/C][/ROW]
[ROW][C]40[/C][C]0[/C][C]0.020823529940586[/C][C]-0.020823529940586[/C][/ROW]
[ROW][C]41[/C][C]0[/C][C]0.0784589300164014[/C][C]-0.0784589300164014[/C][/ROW]
[ROW][C]42[/C][C]0[/C][C]0.0816481192865812[/C][C]-0.0816481192865812[/C][/ROW]
[ROW][C]43[/C][C]0[/C][C]0.0848373085567611[/C][C]-0.0848373085567611[/C][/ROW]
[ROW][C]44[/C][C]0[/C][C]0.0880264978269409[/C][C]-0.0880264978269409[/C][/ROW]
[ROW][C]45[/C][C]0[/C][C]0.0912156870971208[/C][C]-0.0912156870971208[/C][/ROW]
[ROW][C]46[/C][C]0[/C][C]0.0944048763673006[/C][C]-0.0944048763673006[/C][/ROW]
[ROW][C]47[/C][C]0[/C][C]0.0975940656374805[/C][C]-0.0975940656374805[/C][/ROW]
[ROW][C]48[/C][C]0[/C][C]0.10078325490766[/C][C]-0.10078325490766[/C][/ROW]
[ROW][C]49[/C][C]0[/C][C]0.10397244417784[/C][C]-0.10397244417784[/C][/ROW]
[ROW][C]50[/C][C]0[/C][C]0.10716163344802[/C][C]-0.10716163344802[/C][/ROW]
[ROW][C]51[/C][C]0[/C][C]0.1103508227182[/C][C]-0.1103508227182[/C][/ROW]
[ROW][C]52[/C][C]0[/C][C]0.0590938011827442[/C][C]-0.0590938011827442[/C][/ROW]
[ROW][C]53[/C][C]0[/C][C]0.062282990452924[/C][C]-0.062282990452924[/C][/ROW]
[ROW][C]54[/C][C]0[/C][C]0.119918390528739[/C][C]-0.119918390528739[/C][/ROW]
[ROW][C]55[/C][C]1[/C][C]0.123107579798919[/C][C]0.876892420201081[/C][/ROW]
[ROW][C]56[/C][C]0[/C][C]0.0718505582634636[/C][C]-0.0718505582634636[/C][/ROW]
[ROW][C]57[/C][C]0[/C][C]0.129485958339279[/C][C]-0.129485958339279[/C][/ROW]
[ROW][C]58[/C][C]0[/C][C]0.132675147609459[/C][C]-0.132675147609459[/C][/ROW]
[ROW][C]59[/C][C]0[/C][C]0.135864336879639[/C][C]-0.135864336879639[/C][/ROW]
[ROW][C]60[/C][C]0[/C][C]0.0846073153441829[/C][C]-0.0846073153441829[/C][/ROW]
[ROW][C]61[/C][C]0[/C][C]0.0877965046143628[/C][C]-0.0877965046143628[/C][/ROW]
[ROW][C]62[/C][C]0[/C][C]0.0909856938845426[/C][C]-0.0909856938845426[/C][/ROW]
[ROW][C]63[/C][C]0[/C][C]0.148621093960358[/C][C]-0.148621093960358[/C][/ROW]
[ROW][C]64[/C][C]0[/C][C]0.151810283230538[/C][C]-0.151810283230538[/C][/ROW]
[ROW][C]65[/C][C]0[/C][C]0.154999472500718[/C][C]-0.154999472500718[/C][/ROW]
[ROW][C]66[/C][C]1[/C][C]0.158188661770897[/C][C]0.841811338229103[/C][/ROW]
[ROW][C]67[/C][C]1[/C][C]0.161377851041077[/C][C]0.838622148958923[/C][/ROW]
[ROW][C]68[/C][C]0[/C][C]0.164567040311257[/C][C]-0.164567040311257[/C][/ROW]
[/TABLE]
Source: https://freestatistics.org/blog/index.php?pk=202515&T=4

Globally Unique Identifier (entire table): ba.freestatistics.org/blog/index.php?pk=202515&T=4

As an alternative you can also use a QR Code:  

The GUIDs for individual cells are displayed in the table below:

Multiple Linear Regression - Actuals, Interpolation, and Residuals
Time or IndexActualsInterpolationForecastResidualsPrediction Error
10-0.04910864079079230.0491086407907923
20-0.1003656623262480.100365662326248
30-0.04273026225043270.0427302622504327
40-0.03954107298025280.0395410729802528
50-0.0363518837100730.036351883710073
60-0.08760890524552870.0876089052455287
70-0.02997350516971330.0299735051697133
80-0.02678431589953350.0267843158995335
90-0.07804133743498910.0780413374349891
100-0.02040593735917380.0204059373591738
110-0.07166295889462940.0716629588946294
120-0.01402755881881410.0140275588188141
130-0.01083836954863420.0108383695486342
140-0.007649180278454410.00764918027845441
150-0.004459991008274560.00445999100827456
160-0.001270801738094720.00127080173809472
1700.00191838753208512-0.00191838753208512
1800.00510757680226497-0.00510757680226497
190-0.04614944473319070.0461494447331907
2000.0114859553426247-0.0114859553426247
2100.0146751446128045-0.0146751446128045
220-0.03658187692265110.0365818769226511
2300.0210535231531642-0.0210535231531642
2400.024242712423344-0.024242712423344
250-0.02701430911211160.0270143091121116
260-0.02382511984193180.0238251198419318
2700.0338102802338836-0.0338102802338836
280-0.01744674130157210.0174467413015721
2900.0401886587742433-0.0401886587742433
3000.0433778480444231-0.0433778480444231
3100.046567037314603-0.046567037314603
3200.0497562265847828-0.0497562265847828
3300.0529454158549626-0.0529454158549626
3400.0561346051251425-0.0561346051251425
3500.0593237943953223-0.0593237943953223
3600.0625129836655022-0.0625129836655022
3700.0112559621300465-0.0112559621300465
3800.0688913622058619-0.0688913622058619
3900.0720805514760417-0.0720805514760417
4000.020823529940586-0.020823529940586
4100.0784589300164014-0.0784589300164014
4200.0816481192865812-0.0816481192865812
4300.0848373085567611-0.0848373085567611
4400.0880264978269409-0.0880264978269409
4500.0912156870971208-0.0912156870971208
4600.0944048763673006-0.0944048763673006
4700.0975940656374805-0.0975940656374805
4800.10078325490766-0.10078325490766
4900.10397244417784-0.10397244417784
5000.10716163344802-0.10716163344802
5100.1103508227182-0.1103508227182
5200.0590938011827442-0.0590938011827442
5300.062282990452924-0.062282990452924
5400.119918390528739-0.119918390528739
5510.1231075797989190.876892420201081
5600.0718505582634636-0.0718505582634636
5700.129485958339279-0.129485958339279
5800.132675147609459-0.132675147609459
5900.135864336879639-0.135864336879639
6000.0846073153441829-0.0846073153441829
6100.0877965046143628-0.0877965046143628
6200.0909856938845426-0.0909856938845426
6300.148621093960358-0.148621093960358
6400.151810283230538-0.151810283230538
6500.154999472500718-0.154999472500718
6610.1581886617708970.841811338229103
6710.1613778510410770.838622148958923
6800.164567040311257-0.164567040311257


Goldfeld-Quandt test for Heteroskedasticity
p-valuesAlternative Hypothesis
breakpoint indexgreater2-sidedless
6001
7001
8001
9001
10001
11001
12001
13001
14001
15001
16001
17001
18001
19001
20001
21001
22001
23001
24001
25001
26001
27001
28001
29001
30001
31001
32001
33001
34001
35001
36001
37001
38001
39001
40001
41001
42001
43001
44001
45001
46001
47001
48001
49001
50001
51001
52001
53001
54001
558.89119376880403e-071.77823875376081e-060.999999110880623
565.22051661752239e-071.04410332350448e-060.999999477948338
572.12834342340169e-074.25668684680338e-070.999999787165658
588.2307358435411e-081.64614716870822e-070.999999917692642
593.70901715420943e-087.41803430841886e-080.999999962909829
601.21020962494463e-082.42041924988925e-080.999999987897904
613.024947139116e-096.049894278232e-090.999999996975053
625.83994117093014e-101.16798823418603e-090.999999999416006

\begin{tabular}{lllllllll}
\hline
Goldfeld-Quandt test for Heteroskedasticity \tabularnewline
p-values & Alternative Hypothesis \tabularnewline
breakpoint index & greater & 2-sided & less \tabularnewline
6 & 0 & 0 & 1 \tabularnewline
7 & 0 & 0 & 1 \tabularnewline
8 & 0 & 0 & 1 \tabularnewline
9 & 0 & 0 & 1 \tabularnewline
10 & 0 & 0 & 1 \tabularnewline
11 & 0 & 0 & 1 \tabularnewline
12 & 0 & 0 & 1 \tabularnewline
13 & 0 & 0 & 1 \tabularnewline
14 & 0 & 0 & 1 \tabularnewline
15 & 0 & 0 & 1 \tabularnewline
16 & 0 & 0 & 1 \tabularnewline
17 & 0 & 0 & 1 \tabularnewline
18 & 0 & 0 & 1 \tabularnewline
19 & 0 & 0 & 1 \tabularnewline
20 & 0 & 0 & 1 \tabularnewline
21 & 0 & 0 & 1 \tabularnewline
22 & 0 & 0 & 1 \tabularnewline
23 & 0 & 0 & 1 \tabularnewline
24 & 0 & 0 & 1 \tabularnewline
25 & 0 & 0 & 1 \tabularnewline
26 & 0 & 0 & 1 \tabularnewline
27 & 0 & 0 & 1 \tabularnewline
28 & 0 & 0 & 1 \tabularnewline
29 & 0 & 0 & 1 \tabularnewline
30 & 0 & 0 & 1 \tabularnewline
31 & 0 & 0 & 1 \tabularnewline
32 & 0 & 0 & 1 \tabularnewline
33 & 0 & 0 & 1 \tabularnewline
34 & 0 & 0 & 1 \tabularnewline
35 & 0 & 0 & 1 \tabularnewline
36 & 0 & 0 & 1 \tabularnewline
37 & 0 & 0 & 1 \tabularnewline
38 & 0 & 0 & 1 \tabularnewline
39 & 0 & 0 & 1 \tabularnewline
40 & 0 & 0 & 1 \tabularnewline
41 & 0 & 0 & 1 \tabularnewline
42 & 0 & 0 & 1 \tabularnewline
43 & 0 & 0 & 1 \tabularnewline
44 & 0 & 0 & 1 \tabularnewline
45 & 0 & 0 & 1 \tabularnewline
46 & 0 & 0 & 1 \tabularnewline
47 & 0 & 0 & 1 \tabularnewline
48 & 0 & 0 & 1 \tabularnewline
49 & 0 & 0 & 1 \tabularnewline
50 & 0 & 0 & 1 \tabularnewline
51 & 0 & 0 & 1 \tabularnewline
52 & 0 & 0 & 1 \tabularnewline
53 & 0 & 0 & 1 \tabularnewline
54 & 0 & 0 & 1 \tabularnewline
55 & 8.89119376880403e-07 & 1.77823875376081e-06 & 0.999999110880623 \tabularnewline
56 & 5.22051661752239e-07 & 1.04410332350448e-06 & 0.999999477948338 \tabularnewline
57 & 2.12834342340169e-07 & 4.25668684680338e-07 & 0.999999787165658 \tabularnewline
58 & 8.2307358435411e-08 & 1.64614716870822e-07 & 0.999999917692642 \tabularnewline
59 & 3.70901715420943e-08 & 7.41803430841886e-08 & 0.999999962909829 \tabularnewline
60 & 1.21020962494463e-08 & 2.42041924988925e-08 & 0.999999987897904 \tabularnewline
61 & 3.024947139116e-09 & 6.049894278232e-09 & 0.999999996975053 \tabularnewline
62 & 5.83994117093014e-10 & 1.16798823418603e-09 & 0.999999999416006 \tabularnewline
\hline
\end{tabular}
%Source: https://freestatistics.org/blog/index.php?pk=202515&T=5

[TABLE]
[ROW][C]Goldfeld-Quandt test for Heteroskedasticity[/C][/ROW]
[ROW][C]p-values[/C][C]Alternative Hypothesis[/C][/ROW]
[ROW][C]breakpoint index[/C][C]greater[/C][C]2-sided[/C][C]less[/C][/ROW]
[ROW][C]6[/C][C]0[/C][C]0[/C][C]1[/C][/ROW]
[ROW][C]7[/C][C]0[/C][C]0[/C][C]1[/C][/ROW]
[ROW][C]8[/C][C]0[/C][C]0[/C][C]1[/C][/ROW]
[ROW][C]9[/C][C]0[/C][C]0[/C][C]1[/C][/ROW]
[ROW][C]10[/C][C]0[/C][C]0[/C][C]1[/C][/ROW]
[ROW][C]11[/C][C]0[/C][C]0[/C][C]1[/C][/ROW]
[ROW][C]12[/C][C]0[/C][C]0[/C][C]1[/C][/ROW]
[ROW][C]13[/C][C]0[/C][C]0[/C][C]1[/C][/ROW]
[ROW][C]14[/C][C]0[/C][C]0[/C][C]1[/C][/ROW]
[ROW][C]15[/C][C]0[/C][C]0[/C][C]1[/C][/ROW]
[ROW][C]16[/C][C]0[/C][C]0[/C][C]1[/C][/ROW]
[ROW][C]17[/C][C]0[/C][C]0[/C][C]1[/C][/ROW]
[ROW][C]18[/C][C]0[/C][C]0[/C][C]1[/C][/ROW]
[ROW][C]19[/C][C]0[/C][C]0[/C][C]1[/C][/ROW]
[ROW][C]20[/C][C]0[/C][C]0[/C][C]1[/C][/ROW]
[ROW][C]21[/C][C]0[/C][C]0[/C][C]1[/C][/ROW]
[ROW][C]22[/C][C]0[/C][C]0[/C][C]1[/C][/ROW]
[ROW][C]23[/C][C]0[/C][C]0[/C][C]1[/C][/ROW]
[ROW][C]24[/C][C]0[/C][C]0[/C][C]1[/C][/ROW]
[ROW][C]25[/C][C]0[/C][C]0[/C][C]1[/C][/ROW]
[ROW][C]26[/C][C]0[/C][C]0[/C][C]1[/C][/ROW]
[ROW][C]27[/C][C]0[/C][C]0[/C][C]1[/C][/ROW]
[ROW][C]28[/C][C]0[/C][C]0[/C][C]1[/C][/ROW]
[ROW][C]29[/C][C]0[/C][C]0[/C][C]1[/C][/ROW]
[ROW][C]30[/C][C]0[/C][C]0[/C][C]1[/C][/ROW]
[ROW][C]31[/C][C]0[/C][C]0[/C][C]1[/C][/ROW]
[ROW][C]32[/C][C]0[/C][C]0[/C][C]1[/C][/ROW]
[ROW][C]33[/C][C]0[/C][C]0[/C][C]1[/C][/ROW]
[ROW][C]34[/C][C]0[/C][C]0[/C][C]1[/C][/ROW]
[ROW][C]35[/C][C]0[/C][C]0[/C][C]1[/C][/ROW]
[ROW][C]36[/C][C]0[/C][C]0[/C][C]1[/C][/ROW]
[ROW][C]37[/C][C]0[/C][C]0[/C][C]1[/C][/ROW]
[ROW][C]38[/C][C]0[/C][C]0[/C][C]1[/C][/ROW]
[ROW][C]39[/C][C]0[/C][C]0[/C][C]1[/C][/ROW]
[ROW][C]40[/C][C]0[/C][C]0[/C][C]1[/C][/ROW]
[ROW][C]41[/C][C]0[/C][C]0[/C][C]1[/C][/ROW]
[ROW][C]42[/C][C]0[/C][C]0[/C][C]1[/C][/ROW]
[ROW][C]43[/C][C]0[/C][C]0[/C][C]1[/C][/ROW]
[ROW][C]44[/C][C]0[/C][C]0[/C][C]1[/C][/ROW]
[ROW][C]45[/C][C]0[/C][C]0[/C][C]1[/C][/ROW]
[ROW][C]46[/C][C]0[/C][C]0[/C][C]1[/C][/ROW]
[ROW][C]47[/C][C]0[/C][C]0[/C][C]1[/C][/ROW]
[ROW][C]48[/C][C]0[/C][C]0[/C][C]1[/C][/ROW]
[ROW][C]49[/C][C]0[/C][C]0[/C][C]1[/C][/ROW]
[ROW][C]50[/C][C]0[/C][C]0[/C][C]1[/C][/ROW]
[ROW][C]51[/C][C]0[/C][C]0[/C][C]1[/C][/ROW]
[ROW][C]52[/C][C]0[/C][C]0[/C][C]1[/C][/ROW]
[ROW][C]53[/C][C]0[/C][C]0[/C][C]1[/C][/ROW]
[ROW][C]54[/C][C]0[/C][C]0[/C][C]1[/C][/ROW]
[ROW][C]55[/C][C]8.89119376880403e-07[/C][C]1.77823875376081e-06[/C][C]0.999999110880623[/C][/ROW]
[ROW][C]56[/C][C]5.22051661752239e-07[/C][C]1.04410332350448e-06[/C][C]0.999999477948338[/C][/ROW]
[ROW][C]57[/C][C]2.12834342340169e-07[/C][C]4.25668684680338e-07[/C][C]0.999999787165658[/C][/ROW]
[ROW][C]58[/C][C]8.2307358435411e-08[/C][C]1.64614716870822e-07[/C][C]0.999999917692642[/C][/ROW]
[ROW][C]59[/C][C]3.70901715420943e-08[/C][C]7.41803430841886e-08[/C][C]0.999999962909829[/C][/ROW]
[ROW][C]60[/C][C]1.21020962494463e-08[/C][C]2.42041924988925e-08[/C][C]0.999999987897904[/C][/ROW]
[ROW][C]61[/C][C]3.024947139116e-09[/C][C]6.049894278232e-09[/C][C]0.999999996975053[/C][/ROW]
[ROW][C]62[/C][C]5.83994117093014e-10[/C][C]1.16798823418603e-09[/C][C]0.999999999416006[/C][/ROW]
[/TABLE]
Source: https://freestatistics.org/blog/index.php?pk=202515&T=5

Globally Unique Identifier (entire table): ba.freestatistics.org/blog/index.php?pk=202515&T=5

As an alternative you can also use a QR Code:  

The GUIDs for individual cells are displayed in the table below:

Goldfeld-Quandt test for Heteroskedasticity
p-valuesAlternative Hypothesis
breakpoint indexgreater2-sidedless
6001
7001
8001
9001
10001
11001
12001
13001
14001
15001
16001
17001
18001
19001
20001
21001
22001
23001
24001
25001
26001
27001
28001
29001
30001
31001
32001
33001
34001
35001
36001
37001
38001
39001
40001
41001
42001
43001
44001
45001
46001
47001
48001
49001
50001
51001
52001
53001
54001
558.89119376880403e-071.77823875376081e-060.999999110880623
565.22051661752239e-071.04410332350448e-060.999999477948338
572.12834342340169e-074.25668684680338e-070.999999787165658
588.2307358435411e-081.64614716870822e-070.999999917692642
593.70901715420943e-087.41803430841886e-080.999999962909829
601.21020962494463e-082.42041924988925e-080.999999987897904
613.024947139116e-096.049894278232e-090.999999996975053
625.83994117093014e-101.16798823418603e-090.999999999416006


Meta Analysis of Goldfeld-Quandt test for Heteroskedasticity
Description# significant tests% significant testsOK/NOK
1% type I error level571NOK
5% type I error level571NOK
10% type I error level571NOK

\begin{tabular}{lllllllll}
\hline
Meta Analysis of Goldfeld-Quandt test for Heteroskedasticity \tabularnewline
Description & # significant tests & % significant tests & OK/NOK \tabularnewline
1% type I error level & 57 & 1 & NOK \tabularnewline
5% type I error level & 57 & 1 & NOK \tabularnewline
10% type I error level & 57 & 1 & NOK \tabularnewline
\hline
\end{tabular}
%Source: https://freestatistics.org/blog/index.php?pk=202515&T=6

[TABLE]
[ROW][C]Meta Analysis of Goldfeld-Quandt test for Heteroskedasticity[/C][/ROW]
[ROW][C]Description[/C][C]# significant tests[/C][C]% significant tests[/C][C]OK/NOK[/C][/ROW]
[ROW][C]1% type I error level[/C][C]57[/C][C]1[/C][C]NOK[/C][/ROW]
[ROW][C]5% type I error level[/C][C]57[/C][C]1[/C][C]NOK[/C][/ROW]
[ROW][C]10% type I error level[/C][C]57[/C][C]1[/C][C]NOK[/C][/ROW]
[/TABLE]
Source: https://freestatistics.org/blog/index.php?pk=202515&T=6

Globally Unique Identifier (entire table): ba.freestatistics.org/blog/index.php?pk=202515&T=6

As an alternative you can also use a QR Code:  

The GUIDs for individual cells are displayed in the table below:

Meta Analysis of Goldfeld-Quandt test for Heteroskedasticity
Description# significant tests% significant testsOK/NOK
1% type I error level571NOK
5% type I error level571NOK
10% type I error level571NOK


Parameters (Session):
Parameters (R input):
par1 = 2 ; par2 = Do not include Seasonal Dummies ; par3 = Linear Trend ;
R code (references can be found in the software module):
library(lattice)
library(lmtest)
n25 <- 25 #minimum number of obs. for Goldfeld-Quandt test
par1 <- as.numeric(par1)
x <- t(y)
k <- length(x[1,])
n <- length(x[,1])
x1 <- cbind(x[,par1], x[,1:k!=par1])
mycolnames <- c(colnames(x)[par1], colnames(x)[1:k!=par1])
colnames(x1) <- mycolnames #colnames(x)[par1]
x <- x1
if (par3 == 'First Differences'){
x2 <- array(0, dim=c(n-1,k), dimnames=list(1:(n-1), paste('(1-B)',colnames(x),sep='')))
for (i in 1:n-1) {
for (j in 1:k) {
x2[i,j] <- x[i+1,j] - x[i,j]
}
}
x <- x2
}
if (par2 == 'Include Monthly Dummies'){
x2 <- array(0, dim=c(n,11), dimnames=list(1:n, paste('M', seq(1:11), sep ='')))
for (i in 1:11){
x2[seq(i,n,12),i] <- 1
}
x <- cbind(x, x2)
}
if (par2 == 'Include Quarterly Dummies'){
x2 <- array(0, dim=c(n,3), dimnames=list(1:n, paste('Q', seq(1:3), sep ='')))
for (i in 1:3){
x2[seq(i,n,4),i] <- 1
}
x <- cbind(x, x2)
}
k <- length(x[1,])
if (par3 == 'Linear Trend'){
x <- cbind(x, c(1:n))
colnames(x)[k+1] <- 't'
}
x
k <- length(x[1,])
df <- as.data.frame(x)
(mylm <- lm(df))
(mysum <- summary(mylm))
if (n > n25) {
kp3 <- k + 3
nmkm3 <- n - k - 3
gqarr <- array(NA, dim=c(nmkm3-kp3+1,3))
numgqtests <- 0
numsignificant1 <- 0
numsignificant5 <- 0
numsignificant10 <- 0
for (mypoint in kp3:nmkm3) {
j <- 0
numgqtests <- numgqtests + 1
for (myalt in c('greater', 'two.sided', 'less')) {
j <- j + 1
gqarr[mypoint-kp3+1,j] <- gqtest(mylm, point=mypoint, alternative=myalt)$p.value
}
if (gqarr[mypoint-kp3+1,2] < 0.01) numsignificant1 <- numsignificant1 + 1
if (gqarr[mypoint-kp3+1,2] < 0.05) numsignificant5 <- numsignificant5 + 1
if (gqarr[mypoint-kp3+1,2] < 0.10) numsignificant10 <- numsignificant10 + 1
}
gqarr
}
bitmap(file='test0.png')
plot(x[,1], type='l', main='Actuals and Interpolation', ylab='value of Actuals and Interpolation (dots)', xlab='time or index')
points(x[,1]-mysum$resid)
grid()
dev.off()
bitmap(file='test1.png')
plot(mysum$resid, type='b', pch=19, main='Residuals', ylab='value of Residuals', xlab='time or index')
grid()
dev.off()
bitmap(file='test2.png')
hist(mysum$resid, main='Residual Histogram', xlab='values of Residuals')
grid()
dev.off()
bitmap(file='test3.png')
densityplot(~mysum$resid,col='black',main='Residual Density Plot', xlab='values of Residuals')
dev.off()
bitmap(file='test4.png')
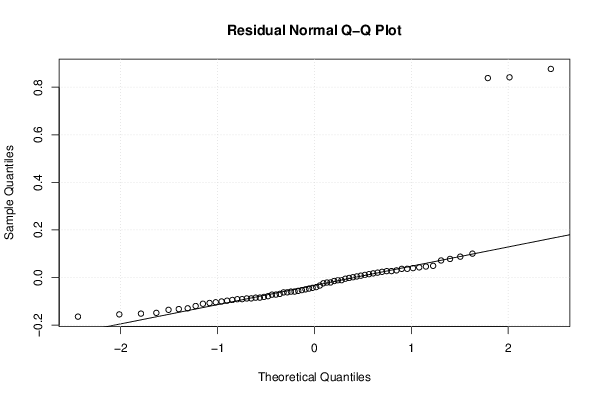
qqnorm(mysum$resid, main='Residual Normal Q-Q Plot')
qqline(mysum$resid)
grid()
dev.off()
(myerror <- as.ts(mysum$resid))
bitmap(file='test5.png')
dum <- cbind(lag(myerror,k=1),myerror)
dum
dum1 <- dum[2:length(myerror),]
dum1
z <- as.data.frame(dum1)
z
plot(z,main=paste('Residual Lag plot, lowess, and regression line'), ylab='values of Residuals', xlab='lagged values of Residuals')
lines(lowess(z))
abline(lm(z))
grid()
dev.off()
bitmap(file='test6.png')
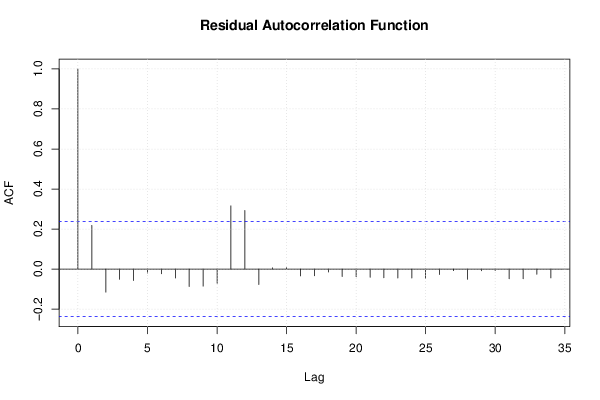
acf(mysum$resid, lag.max=length(mysum$resid)/2, main='Residual Autocorrelation Function')
grid()
dev.off()
bitmap(file='test7.png')
pacf(mysum$resid, lag.max=length(mysum$resid)/2, main='Residual Partial Autocorrelation Function')
grid()
dev.off()
bitmap(file='test8.png')
opar <- par(mfrow = c(2,2), oma = c(0, 0, 1.1, 0))
plot(mylm, las = 1, sub='Residual Diagnostics')
par(opar)
dev.off()
if (n > n25) {
bitmap(file='test9.png')
plot(kp3:nmkm3,gqarr[,2], main='Goldfeld-Quandt test',ylab='2-sided p-value',xlab='breakpoint')
grid()
dev.off()
}
load(file='createtable')
a<-table.start()
a<-table.row.start(a)
a<-table.element(a, 'Multiple Linear Regression - Estimated Regression Equation', 1, TRUE)
a<-table.row.end(a)
myeq <- colnames(x)[1]
myeq <- paste(myeq, '[t] = ', sep='')
for (i in 1:k){
if (mysum$coefficients[i,1] > 0) myeq <- paste(myeq, '+', '')
myeq <- paste(myeq, mysum$coefficients[i,1], sep=' ')
if (rownames(mysum$coefficients)[i] != '(Intercept)') {
myeq <- paste(myeq, rownames(mysum$coefficients)[i], sep='')
if (rownames(mysum$coefficients)[i] != 't') myeq <- paste(myeq, '[t]', sep='')
}
}
myeq <- paste(myeq, ' + e[t]')
a<-table.row.start(a)
a<-table.element(a, myeq)
a<-table.row.end(a)
a<-table.end(a)
table.save(a,file='mytable1.tab')
a<-table.start()
a<-table.row.start(a)
a<-table.element(a,hyperlink('ols1.htm','Multiple Linear Regression - Ordinary Least Squares',''), 6, TRUE)
a<-table.row.end(a)
a<-table.row.start(a)
a<-table.element(a,'Variable',header=TRUE)
a<-table.element(a,'Parameter',header=TRUE)
a<-table.element(a,'S.D.',header=TRUE)
a<-table.element(a,'T-STAT
H0: parameter = 0',header=TRUE)
a<-table.element(a,'2-tail p-value',header=TRUE)
a<-table.element(a,'1-tail p-value',header=TRUE)
a<-table.row.end(a)
for (i in 1:k){
a<-table.row.start(a)
a<-table.element(a,rownames(mysum$coefficients)[i],header=TRUE)
a<-table.element(a,mysum$coefficients[i,1])
a<-table.element(a, round(mysum$coefficients[i,2],6))
a<-table.element(a, round(mysum$coefficients[i,3],4))
a<-table.element(a, round(mysum$coefficients[i,4],6))
a<-table.element(a, round(mysum$coefficients[i,4]/2,6))
a<-table.row.end(a)
}
a<-table.end(a)
table.save(a,file='mytable2.tab')
a<-table.start()
a<-table.row.start(a)
a<-table.element(a, 'Multiple Linear Regression - Regression Statistics', 2, TRUE)
a<-table.row.end(a)
a<-table.row.start(a)
a<-table.element(a, 'Multiple R',1,TRUE)
a<-table.element(a, sqrt(mysum$r.squared))
a<-table.row.end(a)
a<-table.row.start(a)
a<-table.element(a, 'R-squared',1,TRUE)
a<-table.element(a, mysum$r.squared)
a<-table.row.end(a)
a<-table.row.start(a)
a<-table.element(a, 'Adjusted R-squared',1,TRUE)
a<-table.element(a, mysum$adj.r.squared)
a<-table.row.end(a)
a<-table.row.start(a)
a<-table.element(a, 'F-TEST (value)',1,TRUE)
a<-table.element(a, mysum$fstatistic[1])
a<-table.row.end(a)
a<-table.row.start(a)
a<-table.element(a, 'F-TEST (DF numerator)',1,TRUE)
a<-table.element(a, mysum$fstatistic[2])
a<-table.row.end(a)
a<-table.row.start(a)
a<-table.element(a, 'F-TEST (DF denominator)',1,TRUE)
a<-table.element(a, mysum$fstatistic[3])
a<-table.row.end(a)
a<-table.row.start(a)
a<-table.element(a, 'p-value',1,TRUE)
a<-table.element(a, 1-pf(mysum$fstatistic[1],mysum$fstatistic[2],mysum$fstatistic[3]))
a<-table.row.end(a)
a<-table.row.start(a)
a<-table.element(a, 'Multiple Linear Regression - Residual Statistics', 2, TRUE)
a<-table.row.end(a)
a<-table.row.start(a)
a<-table.element(a, 'Residual Standard Deviation',1,TRUE)
a<-table.element(a, mysum$sigma)
a<-table.row.end(a)
a<-table.row.start(a)
a<-table.element(a, 'Sum Squared Residuals',1,TRUE)
a<-table.element(a, sum(myerror*myerror))
a<-table.row.end(a)
a<-table.end(a)
table.save(a,file='mytable3.tab')
a<-table.start()
a<-table.row.start(a)
a<-table.element(a, 'Multiple Linear Regression - Actuals, Interpolation, and Residuals', 4, TRUE)
a<-table.row.end(a)
a<-table.row.start(a)
a<-table.element(a, 'Time or Index', 1, TRUE)
a<-table.element(a, 'Actuals', 1, TRUE)
a<-table.element(a, 'Interpolation
Forecast', 1, TRUE)
a<-table.element(a, 'Residuals
Prediction Error', 1, TRUE)
a<-table.row.end(a)
for (i in 1:n) {
a<-table.row.start(a)
a<-table.element(a,i, 1, TRUE)
a<-table.element(a,x[i])
a<-table.element(a,x[i]-mysum$resid[i])
a<-table.element(a,mysum$resid[i])
a<-table.row.end(a)
}
a<-table.end(a)
table.save(a,file='mytable4.tab')
if (n > n25) {
a<-table.start()
a<-table.row.start(a)
a<-table.element(a,'Goldfeld-Quandt test for Heteroskedasticity',4,TRUE)
a<-table.row.end(a)
a<-table.row.start(a)
a<-table.element(a,'p-values',header=TRUE)
a<-table.element(a,'Alternative Hypothesis',3,header=TRUE)
a<-table.row.end(a)
a<-table.row.start(a)
a<-table.element(a,'breakpoint index',header=TRUE)
a<-table.element(a,'greater',header=TRUE)
a<-table.element(a,'2-sided',header=TRUE)
a<-table.element(a,'less',header=TRUE)
a<-table.row.end(a)
for (mypoint in kp3:nmkm3) {
a<-table.row.start(a)
a<-table.element(a,mypoint,header=TRUE)
a<-table.element(a,gqarr[mypoint-kp3+1,1])
a<-table.element(a,gqarr[mypoint-kp3+1,2])
a<-table.element(a,gqarr[mypoint-kp3+1,3])
a<-table.row.end(a)
}
a<-table.end(a)
table.save(a,file='mytable5.tab')
a<-table.start()
a<-table.row.start(a)
a<-table.element(a,'Meta Analysis of Goldfeld-Quandt test for Heteroskedasticity',4,TRUE)
a<-table.row.end(a)
a<-table.row.start(a)
a<-table.element(a,'Description',header=TRUE)
a<-table.element(a,'# significant tests',header=TRUE)
a<-table.element(a,'% significant tests',header=TRUE)
a<-table.element(a,'OK/NOK',header=TRUE)
a<-table.row.end(a)
a<-table.row.start(a)
a<-table.element(a,'1% type I error level',header=TRUE)
a<-table.element(a,numsignificant1)
a<-table.element(a,numsignificant1/numgqtests)
if (numsignificant1/numgqtests < 0.01) dum <- 'OK' else dum <- 'NOK'
a<-table.element(a,dum)
a<-table.row.end(a)
a<-table.row.start(a)
a<-table.element(a,'5% type I error level',header=TRUE)
a<-table.element(a,numsignificant5)
a<-table.element(a,numsignificant5/numgqtests)
if (numsignificant5/numgqtests < 0.05) dum <- 'OK' else dum <- 'NOK'
a<-table.element(a,dum)
a<-table.row.end(a)
a<-table.row.start(a)
a<-table.element(a,'10% type I error level',header=TRUE)
a<-table.element(a,numsignificant10)
a<-table.element(a,numsignificant10/numgqtests)
if (numsignificant10/numgqtests < 0.1) dum <- 'OK' else dum <- 'NOK'
a<-table.element(a,dum)
a<-table.row.end(a)
a<-table.end(a)
table.save(a,file='mytable6.tab')
}