Free Statistics

of Irreproducible Research!

Author's title

Author*The author of this computation has been verified*
R Software Modulerwasp_multipleregression.wasp
Title produced by softwareMultiple Regression
Date of computationSun, 30 Aug 2015 17:08:50 +0100
Cite this page as followsStatistical Computations at FreeStatistics.org, Office for Research Development and Education, URL https://freestatistics.org/blog/index.php?v=date/2015/Aug/30/t1440950944k1y4y1xis80m1ah.htm/, Retrieved Fri, 01 Nov 2024 00:07:57 +0000
Statistical Computations at FreeStatistics.org, Office for Research Development and Education, URL https://freestatistics.org/blog/index.php?pk=280372, Retrieved Fri, 01 Nov 2024 00:07:57 +0000
QR Codes:

Original text written by user:
IsPrivate?No (this computation is public)
User-defined keywords
Estimated Impact137
Family? (F = Feedback message, R = changed R code, M = changed R Module, P = changed Parameters, D = changed Data)
-     [Multiple Regression] [whahahow] [2014-12-11 15:00:21] [7eb13db22541969154978f29ab2d6b12]
- R  D    [Multiple Regression] [Thomas boxplot st...] [2015-08-30 16:08:50] [98d5d60fbe7cdd1cc5f92fd2f560c762] [Current]
Feedback Forum

Post a new message
Dataseries X:
21	62	72	5.0	11
11	56	61	3.0	13
14	57	68	7.5	12
13	51	61	7.0	15
10	56	64	6.0	13
15	30	65	6.0	16
12	61	69	1.0	12
17	47	63	6.0	12
14	56	75	5.0	15
15	50	63	1.0	12
13	67	73	6.5	12
16	41	75	0.0	11
14	45	63	3.5	12
10	48	63	7.5	11
12	44	62	3.5	14
10	37	64	6.0	12
16	56	60	3.5	15
9	66	56	7.5	14
13	38	59	6.5	12
11	34	68	3.5	14
12	49	66	4.0	11
10	55	73	7.5	13
9	49	72	4.5	14
14	59	71	0.0	16
14	40	59	3.5	13
10	58	64	5.5	14
8	60	66	5.0	16
13	63	78	4.5	11
9	56	68	2.5	13
14	54	73	7.5	13
8	52	62	7.0	15
16	34	65	0.0	12
14	69	68	4.5	13
14	32	65	3.0	12
8	48	60	1.5	14
11	67	71	3.5	14
11	58	65	2.5	16
13	57	68	5.5	15
12	42	64	8.0	14
13	64	74	1.0	13
9	58	69	5.0	14
10	66	76	4.5	15
12	26	68	3.0	14
11	61	72	3.0	12
13	52	67	8.0	7
17	51	63	2.5	12
15	55	59	7.0	15
15	50	73	0.0	12
14	60	66	1.0	13
10	56	62	3.5	11
15	63	69	5.5	14
14	61	66	5.5	13


Summary of computational transaction
Raw Inputview raw input (R code)
Raw Outputview raw output of R engine
Computing time5 seconds
R Server'George Udny Yule' @ yule.wessa.net

\begin{tabular}{lllllllll}
\hline
Summary of computational transaction \tabularnewline
Raw Input & view raw input (R code)  \tabularnewline
Raw Output & view raw output of R engine  \tabularnewline
Computing time & 5 seconds \tabularnewline
R Server & 'George Udny Yule' @ yule.wessa.net \tabularnewline
\hline
\end{tabular}
%Source: https://freestatistics.org/blog/index.php?pk=280372&T=0

[TABLE]
[ROW][C]Summary of computational transaction[/C][/ROW]
[ROW][C]Raw Input[/C][C]view raw input (R code) [/C][/ROW]
[ROW][C]Raw Output[/C][C]view raw output of R engine [/C][/ROW]
[ROW][C]Computing time[/C][C]5 seconds[/C][/ROW]
[ROW][C]R Server[/C][C]'George Udny Yule' @ yule.wessa.net[/C][/ROW]
[/TABLE]
Source: https://freestatistics.org/blog/index.php?pk=280372&T=0

Globally Unique Identifier (entire table): ba.freestatistics.org/blog/index.php?pk=280372&T=0

As an alternative you can also use a QR Code:  

The GUIDs for individual cells are displayed in the table below:

Summary of computational transaction
Raw Inputview raw input (R code)
Raw Outputview raw output of R engine
Computing time5 seconds
R Server'George Udny Yule' @ yule.wessa.net


Multiple Linear Regression - Estimated Regression Equation
CESDTOT[t] = + 16.4723 -0.027332AMS.I[t] + 0.0470479AMS.E[t] -0.178899Ex[t] -0.367804Stresstot[t] + e[t]

\begin{tabular}{lllllllll}
\hline
Multiple Linear Regression - Estimated Regression Equation \tabularnewline
CESDTOT[t] =  +  16.4723 -0.027332AMS.I[t] +  0.0470479AMS.E[t] -0.178899Ex[t] -0.367804Stresstot[t]  + e[t] \tabularnewline
\hline
\end{tabular}
%Source: https://freestatistics.org/blog/index.php?pk=280372&T=1

[TABLE]
[ROW][C]Multiple Linear Regression - Estimated Regression Equation[/C][/ROW]
[ROW][C]CESDTOT[t] =  +  16.4723 -0.027332AMS.I[t] +  0.0470479AMS.E[t] -0.178899Ex[t] -0.367804Stresstot[t]  + e[t][/C][/ROW]
[/TABLE]
Source: https://freestatistics.org/blog/index.php?pk=280372&T=1

Globally Unique Identifier (entire table): ba.freestatistics.org/blog/index.php?pk=280372&T=1

As an alternative you can also use a QR Code:  

The GUIDs for individual cells are displayed in the table below:

Multiple Linear Regression - Estimated Regression Equation
CESDTOT[t] = + 16.4723 -0.027332AMS.I[t] + 0.0470479AMS.E[t] -0.178899Ex[t] -0.367804Stresstot[t] + e[t]


Multiple Linear Regression - Ordinary Least Squares
VariableParameterS.D.T-STATH0: parameter = 02-tail p-value1-tail p-value
(Intercept)16.47236.162322.6730.01030110.00515056
AMS.I-0.0273320.0383456-0.71280.4795040.239752
AMS.E0.04704790.07906150.59510.5546440.277322
Ex-0.1788990.164443-1.0880.2821840.141092
Stresstot-0.3678040.22151-1.660.1034830.0517417

\begin{tabular}{lllllllll}
\hline
Multiple Linear Regression - Ordinary Least Squares \tabularnewline
Variable & Parameter & S.D. & T-STATH0: parameter = 0 & 2-tail p-value & 1-tail p-value \tabularnewline
(Intercept) & 16.4723 & 6.16232 & 2.673 & 0.0103011 & 0.00515056 \tabularnewline
AMS.I & -0.027332 & 0.0383456 & -0.7128 & 0.479504 & 0.239752 \tabularnewline
AMS.E & 0.0470479 & 0.0790615 & 0.5951 & 0.554644 & 0.277322 \tabularnewline
Ex & -0.178899 & 0.164443 & -1.088 & 0.282184 & 0.141092 \tabularnewline
Stresstot & -0.367804 & 0.22151 & -1.66 & 0.103483 & 0.0517417 \tabularnewline
\hline
\end{tabular}
%Source: https://freestatistics.org/blog/index.php?pk=280372&T=2

[TABLE]
[ROW][C]Multiple Linear Regression - Ordinary Least Squares[/C][/ROW]
[ROW][C]Variable[/C][C]Parameter[/C][C]S.D.[/C][C]T-STATH0: parameter = 0[/C][C]2-tail p-value[/C][C]1-tail p-value[/C][/ROW]
[ROW][C](Intercept)[/C][C]16.4723[/C][C]6.16232[/C][C]2.673[/C][C]0.0103011[/C][C]0.00515056[/C][/ROW]
[ROW][C]AMS.I[/C][C]-0.027332[/C][C]0.0383456[/C][C]-0.7128[/C][C]0.479504[/C][C]0.239752[/C][/ROW]
[ROW][C]AMS.E[/C][C]0.0470479[/C][C]0.0790615[/C][C]0.5951[/C][C]0.554644[/C][C]0.277322[/C][/ROW]
[ROW][C]Ex[/C][C]-0.178899[/C][C]0.164443[/C][C]-1.088[/C][C]0.282184[/C][C]0.141092[/C][/ROW]
[ROW][C]Stresstot[/C][C]-0.367804[/C][C]0.22151[/C][C]-1.66[/C][C]0.103483[/C][C]0.0517417[/C][/ROW]
[/TABLE]
Source: https://freestatistics.org/blog/index.php?pk=280372&T=2

Globally Unique Identifier (entire table): ba.freestatistics.org/blog/index.php?pk=280372&T=2

As an alternative you can also use a QR Code:  

The GUIDs for individual cells are displayed in the table below:

Multiple Linear Regression - Ordinary Least Squares
VariableParameterS.D.T-STATH0: parameter = 02-tail p-value1-tail p-value
(Intercept)16.47236.162322.6730.01030110.00515056
AMS.I-0.0273320.0383456-0.71280.4795040.239752
AMS.E0.04704790.07906150.59510.5546440.277322
Ex-0.1788990.164443-1.0880.2821840.141092
Stresstot-0.3678040.22151-1.660.1034830.0517417


Multiple Linear Regression - Regression Statistics
Multiple R0.327262
R-squared0.107101
Adjusted R-squared0.0311093
F-TEST (value)1.40938
F-TEST (DF numerator)4
F-TEST (DF denominator)47
p-value0.245479
Multiple Linear Regression - Residual Statistics
Residual Standard Deviation2.65374
Sum Squared Residuals330.991

\begin{tabular}{lllllllll}
\hline
Multiple Linear Regression - Regression Statistics \tabularnewline
Multiple R & 0.327262 \tabularnewline
R-squared & 0.107101 \tabularnewline
Adjusted R-squared & 0.0311093 \tabularnewline
F-TEST (value) & 1.40938 \tabularnewline
F-TEST (DF numerator) & 4 \tabularnewline
F-TEST (DF denominator) & 47 \tabularnewline
p-value & 0.245479 \tabularnewline
Multiple Linear Regression - Residual Statistics \tabularnewline
Residual Standard Deviation & 2.65374 \tabularnewline
Sum Squared Residuals & 330.991 \tabularnewline
\hline
\end{tabular}
%Source: https://freestatistics.org/blog/index.php?pk=280372&T=3

[TABLE]
[ROW][C]Multiple Linear Regression - Regression Statistics[/C][/ROW]
[ROW][C]Multiple R[/C][C]0.327262[/C][/ROW]
[ROW][C]R-squared[/C][C]0.107101[/C][/ROW]
[ROW][C]Adjusted R-squared[/C][C]0.0311093[/C][/ROW]
[ROW][C]F-TEST (value)[/C][C]1.40938[/C][/ROW]
[ROW][C]F-TEST (DF numerator)[/C][C]4[/C][/ROW]
[ROW][C]F-TEST (DF denominator)[/C][C]47[/C][/ROW]
[ROW][C]p-value[/C][C]0.245479[/C][/ROW]
[ROW][C]Multiple Linear Regression - Residual Statistics[/C][/ROW]
[ROW][C]Residual Standard Deviation[/C][C]2.65374[/C][/ROW]
[ROW][C]Sum Squared Residuals[/C][C]330.991[/C][/ROW]
[/TABLE]
Source: https://freestatistics.org/blog/index.php?pk=280372&T=3

Globally Unique Identifier (entire table): ba.freestatistics.org/blog/index.php?pk=280372&T=3

As an alternative you can also use a QR Code:  

The GUIDs for individual cells are displayed in the table below:

Multiple Linear Regression - Regression Statistics
Multiple R0.327262
R-squared0.107101
Adjusted R-squared0.0311093
F-TEST (value)1.40938
F-TEST (DF numerator)4
F-TEST (DF denominator)47
p-value0.245479
Multiple Linear Regression - Residual Statistics
Residual Standard Deviation2.65374
Sum Squared Residuals330.991


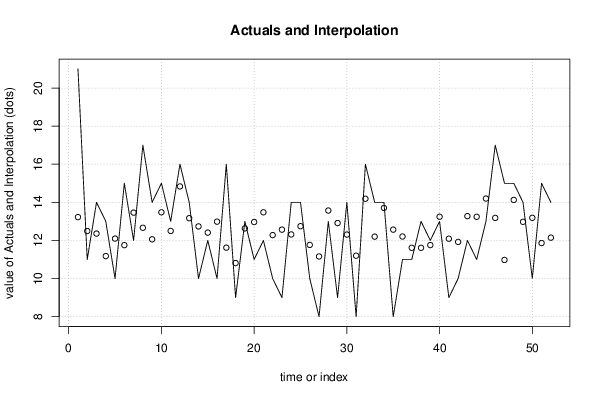
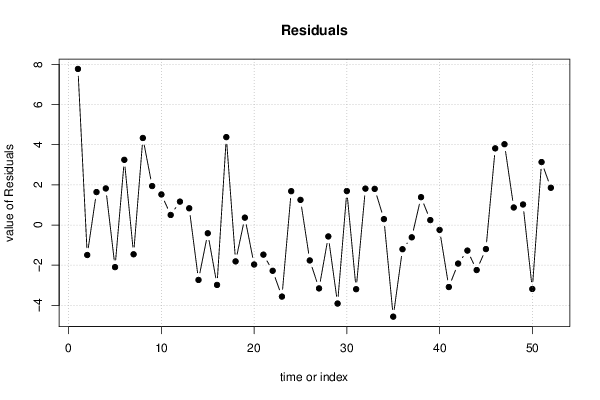
Multiple Linear Regression - Actuals, Interpolation, and Residuals
Time or IndexActualsInterpolationForecastResidualsPrediction Error
12113.22497.77515
21112.4935-1.49351
31412.35831.64173
41311.1791.82104
51012.098-2.09795
61511.75223.24778
71213.4588-1.45883
81712.66474.3353
91412.05881.94123
101513.47721.5228
111312.49910.500914
121614.83451.16554
131413.16660.833391
141012.7368-2.73682
151212.4113-0.411285
161012.9851-2.98507
171611.62144.3786
18910.8121-1.8121
191312.6330.366955
201112.9669-1.96689
211213.4768-1.47678
221012.2804-2.28037
23912.5662-3.56621
241412.31531.68472
251412.74731.25273
261011.7649-1.76493
27811.1582-3.15821
281313.5693-0.569257
29912.9123-3.91229
301412.30771.6923
31811.1987-3.19868
321614.18751.8125
331412.19921.80082
341413.70550.294529
35812.5657-4.56566
361112.2061-1.20608
371111.6131-0.613072
381311.61271.38735
391211.7550.245001
401313.2443-0.244272
41912.0896-3.08962
421011.9219-1.92195
431213.275-1.275
441113.2422-2.24218
451314.1975-1.19745
461713.18153.81848
471510.97554.02446
481514.12660.873424
491412.97721.02278
501013.1867-3.18671
511511.86353.13649
521412.14481.85516

\begin{tabular}{lllllllll}
\hline
Multiple Linear Regression - Actuals, Interpolation, and Residuals \tabularnewline
Time or Index & Actuals & InterpolationForecast & ResidualsPrediction Error \tabularnewline
1 & 21 & 13.2249 & 7.77515 \tabularnewline
2 & 11 & 12.4935 & -1.49351 \tabularnewline
3 & 14 & 12.3583 & 1.64173 \tabularnewline
4 & 13 & 11.179 & 1.82104 \tabularnewline
5 & 10 & 12.098 & -2.09795 \tabularnewline
6 & 15 & 11.7522 & 3.24778 \tabularnewline
7 & 12 & 13.4588 & -1.45883 \tabularnewline
8 & 17 & 12.6647 & 4.3353 \tabularnewline
9 & 14 & 12.0588 & 1.94123 \tabularnewline
10 & 15 & 13.4772 & 1.5228 \tabularnewline
11 & 13 & 12.4991 & 0.500914 \tabularnewline
12 & 16 & 14.8345 & 1.16554 \tabularnewline
13 & 14 & 13.1666 & 0.833391 \tabularnewline
14 & 10 & 12.7368 & -2.73682 \tabularnewline
15 & 12 & 12.4113 & -0.411285 \tabularnewline
16 & 10 & 12.9851 & -2.98507 \tabularnewline
17 & 16 & 11.6214 & 4.3786 \tabularnewline
18 & 9 & 10.8121 & -1.8121 \tabularnewline
19 & 13 & 12.633 & 0.366955 \tabularnewline
20 & 11 & 12.9669 & -1.96689 \tabularnewline
21 & 12 & 13.4768 & -1.47678 \tabularnewline
22 & 10 & 12.2804 & -2.28037 \tabularnewline
23 & 9 & 12.5662 & -3.56621 \tabularnewline
24 & 14 & 12.3153 & 1.68472 \tabularnewline
25 & 14 & 12.7473 & 1.25273 \tabularnewline
26 & 10 & 11.7649 & -1.76493 \tabularnewline
27 & 8 & 11.1582 & -3.15821 \tabularnewline
28 & 13 & 13.5693 & -0.569257 \tabularnewline
29 & 9 & 12.9123 & -3.91229 \tabularnewline
30 & 14 & 12.3077 & 1.6923 \tabularnewline
31 & 8 & 11.1987 & -3.19868 \tabularnewline
32 & 16 & 14.1875 & 1.8125 \tabularnewline
33 & 14 & 12.1992 & 1.80082 \tabularnewline
34 & 14 & 13.7055 & 0.294529 \tabularnewline
35 & 8 & 12.5657 & -4.56566 \tabularnewline
36 & 11 & 12.2061 & -1.20608 \tabularnewline
37 & 11 & 11.6131 & -0.613072 \tabularnewline
38 & 13 & 11.6127 & 1.38735 \tabularnewline
39 & 12 & 11.755 & 0.245001 \tabularnewline
40 & 13 & 13.2443 & -0.244272 \tabularnewline
41 & 9 & 12.0896 & -3.08962 \tabularnewline
42 & 10 & 11.9219 & -1.92195 \tabularnewline
43 & 12 & 13.275 & -1.275 \tabularnewline
44 & 11 & 13.2422 & -2.24218 \tabularnewline
45 & 13 & 14.1975 & -1.19745 \tabularnewline
46 & 17 & 13.1815 & 3.81848 \tabularnewline
47 & 15 & 10.9755 & 4.02446 \tabularnewline
48 & 15 & 14.1266 & 0.873424 \tabularnewline
49 & 14 & 12.9772 & 1.02278 \tabularnewline
50 & 10 & 13.1867 & -3.18671 \tabularnewline
51 & 15 & 11.8635 & 3.13649 \tabularnewline
52 & 14 & 12.1448 & 1.85516 \tabularnewline
\hline
\end{tabular}
%Source: https://freestatistics.org/blog/index.php?pk=280372&T=4

[TABLE]
[ROW][C]Multiple Linear Regression - Actuals, Interpolation, and Residuals[/C][/ROW]
[ROW][C]Time or Index[/C][C]Actuals[/C][C]InterpolationForecast[/C][C]ResidualsPrediction Error[/C][/ROW]
[ROW][C]1[/C][C]21[/C][C]13.2249[/C][C]7.77515[/C][/ROW]
[ROW][C]2[/C][C]11[/C][C]12.4935[/C][C]-1.49351[/C][/ROW]
[ROW][C]3[/C][C]14[/C][C]12.3583[/C][C]1.64173[/C][/ROW]
[ROW][C]4[/C][C]13[/C][C]11.179[/C][C]1.82104[/C][/ROW]
[ROW][C]5[/C][C]10[/C][C]12.098[/C][C]-2.09795[/C][/ROW]
[ROW][C]6[/C][C]15[/C][C]11.7522[/C][C]3.24778[/C][/ROW]
[ROW][C]7[/C][C]12[/C][C]13.4588[/C][C]-1.45883[/C][/ROW]
[ROW][C]8[/C][C]17[/C][C]12.6647[/C][C]4.3353[/C][/ROW]
[ROW][C]9[/C][C]14[/C][C]12.0588[/C][C]1.94123[/C][/ROW]
[ROW][C]10[/C][C]15[/C][C]13.4772[/C][C]1.5228[/C][/ROW]
[ROW][C]11[/C][C]13[/C][C]12.4991[/C][C]0.500914[/C][/ROW]
[ROW][C]12[/C][C]16[/C][C]14.8345[/C][C]1.16554[/C][/ROW]
[ROW][C]13[/C][C]14[/C][C]13.1666[/C][C]0.833391[/C][/ROW]
[ROW][C]14[/C][C]10[/C][C]12.7368[/C][C]-2.73682[/C][/ROW]
[ROW][C]15[/C][C]12[/C][C]12.4113[/C][C]-0.411285[/C][/ROW]
[ROW][C]16[/C][C]10[/C][C]12.9851[/C][C]-2.98507[/C][/ROW]
[ROW][C]17[/C][C]16[/C][C]11.6214[/C][C]4.3786[/C][/ROW]
[ROW][C]18[/C][C]9[/C][C]10.8121[/C][C]-1.8121[/C][/ROW]
[ROW][C]19[/C][C]13[/C][C]12.633[/C][C]0.366955[/C][/ROW]
[ROW][C]20[/C][C]11[/C][C]12.9669[/C][C]-1.96689[/C][/ROW]
[ROW][C]21[/C][C]12[/C][C]13.4768[/C][C]-1.47678[/C][/ROW]
[ROW][C]22[/C][C]10[/C][C]12.2804[/C][C]-2.28037[/C][/ROW]
[ROW][C]23[/C][C]9[/C][C]12.5662[/C][C]-3.56621[/C][/ROW]
[ROW][C]24[/C][C]14[/C][C]12.3153[/C][C]1.68472[/C][/ROW]
[ROW][C]25[/C][C]14[/C][C]12.7473[/C][C]1.25273[/C][/ROW]
[ROW][C]26[/C][C]10[/C][C]11.7649[/C][C]-1.76493[/C][/ROW]
[ROW][C]27[/C][C]8[/C][C]11.1582[/C][C]-3.15821[/C][/ROW]
[ROW][C]28[/C][C]13[/C][C]13.5693[/C][C]-0.569257[/C][/ROW]
[ROW][C]29[/C][C]9[/C][C]12.9123[/C][C]-3.91229[/C][/ROW]
[ROW][C]30[/C][C]14[/C][C]12.3077[/C][C]1.6923[/C][/ROW]
[ROW][C]31[/C][C]8[/C][C]11.1987[/C][C]-3.19868[/C][/ROW]
[ROW][C]32[/C][C]16[/C][C]14.1875[/C][C]1.8125[/C][/ROW]
[ROW][C]33[/C][C]14[/C][C]12.1992[/C][C]1.80082[/C][/ROW]
[ROW][C]34[/C][C]14[/C][C]13.7055[/C][C]0.294529[/C][/ROW]
[ROW][C]35[/C][C]8[/C][C]12.5657[/C][C]-4.56566[/C][/ROW]
[ROW][C]36[/C][C]11[/C][C]12.2061[/C][C]-1.20608[/C][/ROW]
[ROW][C]37[/C][C]11[/C][C]11.6131[/C][C]-0.613072[/C][/ROW]
[ROW][C]38[/C][C]13[/C][C]11.6127[/C][C]1.38735[/C][/ROW]
[ROW][C]39[/C][C]12[/C][C]11.755[/C][C]0.245001[/C][/ROW]
[ROW][C]40[/C][C]13[/C][C]13.2443[/C][C]-0.244272[/C][/ROW]
[ROW][C]41[/C][C]9[/C][C]12.0896[/C][C]-3.08962[/C][/ROW]
[ROW][C]42[/C][C]10[/C][C]11.9219[/C][C]-1.92195[/C][/ROW]
[ROW][C]43[/C][C]12[/C][C]13.275[/C][C]-1.275[/C][/ROW]
[ROW][C]44[/C][C]11[/C][C]13.2422[/C][C]-2.24218[/C][/ROW]
[ROW][C]45[/C][C]13[/C][C]14.1975[/C][C]-1.19745[/C][/ROW]
[ROW][C]46[/C][C]17[/C][C]13.1815[/C][C]3.81848[/C][/ROW]
[ROW][C]47[/C][C]15[/C][C]10.9755[/C][C]4.02446[/C][/ROW]
[ROW][C]48[/C][C]15[/C][C]14.1266[/C][C]0.873424[/C][/ROW]
[ROW][C]49[/C][C]14[/C][C]12.9772[/C][C]1.02278[/C][/ROW]
[ROW][C]50[/C][C]10[/C][C]13.1867[/C][C]-3.18671[/C][/ROW]
[ROW][C]51[/C][C]15[/C][C]11.8635[/C][C]3.13649[/C][/ROW]
[ROW][C]52[/C][C]14[/C][C]12.1448[/C][C]1.85516[/C][/ROW]
[/TABLE]
Source: https://freestatistics.org/blog/index.php?pk=280372&T=4

Globally Unique Identifier (entire table): ba.freestatistics.org/blog/index.php?pk=280372&T=4

As an alternative you can also use a QR Code:  

The GUIDs for individual cells are displayed in the table below:

Multiple Linear Regression - Actuals, Interpolation, and Residuals
Time or IndexActualsInterpolationForecastResidualsPrediction Error
12113.22497.77515
21112.4935-1.49351
31412.35831.64173
41311.1791.82104
51012.098-2.09795
61511.75223.24778
71213.4588-1.45883
81712.66474.3353
91412.05881.94123
101513.47721.5228
111312.49910.500914
121614.83451.16554
131413.16660.833391
141012.7368-2.73682
151212.4113-0.411285
161012.9851-2.98507
171611.62144.3786
18910.8121-1.8121
191312.6330.366955
201112.9669-1.96689
211213.4768-1.47678
221012.2804-2.28037
23912.5662-3.56621
241412.31531.68472
251412.74731.25273
261011.7649-1.76493
27811.1582-3.15821
281313.5693-0.569257
29912.9123-3.91229
301412.30771.6923
31811.1987-3.19868
321614.18751.8125
331412.19921.80082
341413.70550.294529
35812.5657-4.56566
361112.2061-1.20608
371111.6131-0.613072
381311.61271.38735
391211.7550.245001
401313.2443-0.244272
41912.0896-3.08962
421011.9219-1.92195
431213.275-1.275
441113.2422-2.24218
451314.1975-1.19745
461713.18153.81848
471510.97554.02446
481514.12660.873424
491412.97721.02278
501013.1867-3.18671
511511.86353.13649
521412.14481.85516


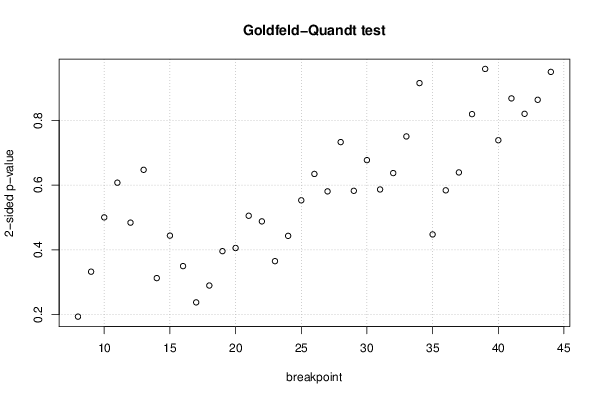
Goldfeld-Quandt test for Heteroskedasticity
p-valuesAlternative Hypothesis
breakpoint indexgreater2-sidedless
80.9031650.193670.0968349
90.8337590.3324810.166241
100.7498660.5002680.250134
110.6963010.6073980.303699
120.7579960.4840090.242004
130.6764430.6471150.323557
140.8436560.3126880.156344
150.7780630.4438730.221937
160.8251050.3497910.174895
170.8811160.2377690.118884
180.8551060.2897890.144894
190.8020410.3959180.197959
200.7971470.4057050.202853
210.747370.505260.25263
220.7560370.4879260.243963
230.817470.3650610.18253
240.7784060.4431890.221594
250.7234950.5530110.276505
260.68280.63440.3172
270.7096970.5806060.290303
280.6336390.7327220.366361
290.7088520.5822970.291148
300.6614210.6771580.338579
310.7067620.5864760.293238
320.6814580.6370840.318542
330.6248740.7502530.375126
340.54250.9150010.4575
350.7761760.4476480.223824
360.7080930.5838140.291907
370.6804460.6391080.319554
380.5904320.8191360.409568
390.4793250.958650.520675
400.3692610.7385220.630739
410.4338650.8677310.566135
420.4100370.8200740.589963
430.5683360.8633280.431664
440.5252280.9495440.474772

\begin{tabular}{lllllllll}
\hline
Goldfeld-Quandt test for Heteroskedasticity \tabularnewline
p-values & Alternative Hypothesis \tabularnewline
breakpoint index & greater & 2-sided & less \tabularnewline
8 & 0.903165 & 0.19367 & 0.0968349 \tabularnewline
9 & 0.833759 & 0.332481 & 0.166241 \tabularnewline
10 & 0.749866 & 0.500268 & 0.250134 \tabularnewline
11 & 0.696301 & 0.607398 & 0.303699 \tabularnewline
12 & 0.757996 & 0.484009 & 0.242004 \tabularnewline
13 & 0.676443 & 0.647115 & 0.323557 \tabularnewline
14 & 0.843656 & 0.312688 & 0.156344 \tabularnewline
15 & 0.778063 & 0.443873 & 0.221937 \tabularnewline
16 & 0.825105 & 0.349791 & 0.174895 \tabularnewline
17 & 0.881116 & 0.237769 & 0.118884 \tabularnewline
18 & 0.855106 & 0.289789 & 0.144894 \tabularnewline
19 & 0.802041 & 0.395918 & 0.197959 \tabularnewline
20 & 0.797147 & 0.405705 & 0.202853 \tabularnewline
21 & 0.74737 & 0.50526 & 0.25263 \tabularnewline
22 & 0.756037 & 0.487926 & 0.243963 \tabularnewline
23 & 0.81747 & 0.365061 & 0.18253 \tabularnewline
24 & 0.778406 & 0.443189 & 0.221594 \tabularnewline
25 & 0.723495 & 0.553011 & 0.276505 \tabularnewline
26 & 0.6828 & 0.6344 & 0.3172 \tabularnewline
27 & 0.709697 & 0.580606 & 0.290303 \tabularnewline
28 & 0.633639 & 0.732722 & 0.366361 \tabularnewline
29 & 0.708852 & 0.582297 & 0.291148 \tabularnewline
30 & 0.661421 & 0.677158 & 0.338579 \tabularnewline
31 & 0.706762 & 0.586476 & 0.293238 \tabularnewline
32 & 0.681458 & 0.637084 & 0.318542 \tabularnewline
33 & 0.624874 & 0.750253 & 0.375126 \tabularnewline
34 & 0.5425 & 0.915001 & 0.4575 \tabularnewline
35 & 0.776176 & 0.447648 & 0.223824 \tabularnewline
36 & 0.708093 & 0.583814 & 0.291907 \tabularnewline
37 & 0.680446 & 0.639108 & 0.319554 \tabularnewline
38 & 0.590432 & 0.819136 & 0.409568 \tabularnewline
39 & 0.479325 & 0.95865 & 0.520675 \tabularnewline
40 & 0.369261 & 0.738522 & 0.630739 \tabularnewline
41 & 0.433865 & 0.867731 & 0.566135 \tabularnewline
42 & 0.410037 & 0.820074 & 0.589963 \tabularnewline
43 & 0.568336 & 0.863328 & 0.431664 \tabularnewline
44 & 0.525228 & 0.949544 & 0.474772 \tabularnewline
\hline
\end{tabular}
%Source: https://freestatistics.org/blog/index.php?pk=280372&T=5

[TABLE]
[ROW][C]Goldfeld-Quandt test for Heteroskedasticity[/C][/ROW]
[ROW][C]p-values[/C][C]Alternative Hypothesis[/C][/ROW]
[ROW][C]breakpoint index[/C][C]greater[/C][C]2-sided[/C][C]less[/C][/ROW]
[ROW][C]8[/C][C]0.903165[/C][C]0.19367[/C][C]0.0968349[/C][/ROW]
[ROW][C]9[/C][C]0.833759[/C][C]0.332481[/C][C]0.166241[/C][/ROW]
[ROW][C]10[/C][C]0.749866[/C][C]0.500268[/C][C]0.250134[/C][/ROW]
[ROW][C]11[/C][C]0.696301[/C][C]0.607398[/C][C]0.303699[/C][/ROW]
[ROW][C]12[/C][C]0.757996[/C][C]0.484009[/C][C]0.242004[/C][/ROW]
[ROW][C]13[/C][C]0.676443[/C][C]0.647115[/C][C]0.323557[/C][/ROW]
[ROW][C]14[/C][C]0.843656[/C][C]0.312688[/C][C]0.156344[/C][/ROW]
[ROW][C]15[/C][C]0.778063[/C][C]0.443873[/C][C]0.221937[/C][/ROW]
[ROW][C]16[/C][C]0.825105[/C][C]0.349791[/C][C]0.174895[/C][/ROW]
[ROW][C]17[/C][C]0.881116[/C][C]0.237769[/C][C]0.118884[/C][/ROW]
[ROW][C]18[/C][C]0.855106[/C][C]0.289789[/C][C]0.144894[/C][/ROW]
[ROW][C]19[/C][C]0.802041[/C][C]0.395918[/C][C]0.197959[/C][/ROW]
[ROW][C]20[/C][C]0.797147[/C][C]0.405705[/C][C]0.202853[/C][/ROW]
[ROW][C]21[/C][C]0.74737[/C][C]0.50526[/C][C]0.25263[/C][/ROW]
[ROW][C]22[/C][C]0.756037[/C][C]0.487926[/C][C]0.243963[/C][/ROW]
[ROW][C]23[/C][C]0.81747[/C][C]0.365061[/C][C]0.18253[/C][/ROW]
[ROW][C]24[/C][C]0.778406[/C][C]0.443189[/C][C]0.221594[/C][/ROW]
[ROW][C]25[/C][C]0.723495[/C][C]0.553011[/C][C]0.276505[/C][/ROW]
[ROW][C]26[/C][C]0.6828[/C][C]0.6344[/C][C]0.3172[/C][/ROW]
[ROW][C]27[/C][C]0.709697[/C][C]0.580606[/C][C]0.290303[/C][/ROW]
[ROW][C]28[/C][C]0.633639[/C][C]0.732722[/C][C]0.366361[/C][/ROW]
[ROW][C]29[/C][C]0.708852[/C][C]0.582297[/C][C]0.291148[/C][/ROW]
[ROW][C]30[/C][C]0.661421[/C][C]0.677158[/C][C]0.338579[/C][/ROW]
[ROW][C]31[/C][C]0.706762[/C][C]0.586476[/C][C]0.293238[/C][/ROW]
[ROW][C]32[/C][C]0.681458[/C][C]0.637084[/C][C]0.318542[/C][/ROW]
[ROW][C]33[/C][C]0.624874[/C][C]0.750253[/C][C]0.375126[/C][/ROW]
[ROW][C]34[/C][C]0.5425[/C][C]0.915001[/C][C]0.4575[/C][/ROW]
[ROW][C]35[/C][C]0.776176[/C][C]0.447648[/C][C]0.223824[/C][/ROW]
[ROW][C]36[/C][C]0.708093[/C][C]0.583814[/C][C]0.291907[/C][/ROW]
[ROW][C]37[/C][C]0.680446[/C][C]0.639108[/C][C]0.319554[/C][/ROW]
[ROW][C]38[/C][C]0.590432[/C][C]0.819136[/C][C]0.409568[/C][/ROW]
[ROW][C]39[/C][C]0.479325[/C][C]0.95865[/C][C]0.520675[/C][/ROW]
[ROW][C]40[/C][C]0.369261[/C][C]0.738522[/C][C]0.630739[/C][/ROW]
[ROW][C]41[/C][C]0.433865[/C][C]0.867731[/C][C]0.566135[/C][/ROW]
[ROW][C]42[/C][C]0.410037[/C][C]0.820074[/C][C]0.589963[/C][/ROW]
[ROW][C]43[/C][C]0.568336[/C][C]0.863328[/C][C]0.431664[/C][/ROW]
[ROW][C]44[/C][C]0.525228[/C][C]0.949544[/C][C]0.474772[/C][/ROW]
[/TABLE]
Source: https://freestatistics.org/blog/index.php?pk=280372&T=5

Globally Unique Identifier (entire table): ba.freestatistics.org/blog/index.php?pk=280372&T=5

As an alternative you can also use a QR Code:  

The GUIDs for individual cells are displayed in the table below:

Goldfeld-Quandt test for Heteroskedasticity
p-valuesAlternative Hypothesis
breakpoint indexgreater2-sidedless
80.9031650.193670.0968349
90.8337590.3324810.166241
100.7498660.5002680.250134
110.6963010.6073980.303699
120.7579960.4840090.242004
130.6764430.6471150.323557
140.8436560.3126880.156344
150.7780630.4438730.221937
160.8251050.3497910.174895
170.8811160.2377690.118884
180.8551060.2897890.144894
190.8020410.3959180.197959
200.7971470.4057050.202853
210.747370.505260.25263
220.7560370.4879260.243963
230.817470.3650610.18253
240.7784060.4431890.221594
250.7234950.5530110.276505
260.68280.63440.3172
270.7096970.5806060.290303
280.6336390.7327220.366361
290.7088520.5822970.291148
300.6614210.6771580.338579
310.7067620.5864760.293238
320.6814580.6370840.318542
330.6248740.7502530.375126
340.54250.9150010.4575
350.7761760.4476480.223824
360.7080930.5838140.291907
370.6804460.6391080.319554
380.5904320.8191360.409568
390.4793250.958650.520675
400.3692610.7385220.630739
410.4338650.8677310.566135
420.4100370.8200740.589963
430.5683360.8633280.431664
440.5252280.9495440.474772


Meta Analysis of Goldfeld-Quandt test for Heteroskedasticity
Description# significant tests% significant testsOK/NOK
1% type I error level00OK
5% type I error level00OK
10% type I error level00OK

\begin{tabular}{lllllllll}
\hline
Meta Analysis of Goldfeld-Quandt test for Heteroskedasticity \tabularnewline
Description & # significant tests & % significant tests & OK/NOK \tabularnewline
1% type I error level & 0 & 0 & OK \tabularnewline
5% type I error level & 0 & 0 & OK \tabularnewline
10% type I error level & 0 & 0 & OK \tabularnewline
\hline
\end{tabular}
%Source: https://freestatistics.org/blog/index.php?pk=280372&T=6

[TABLE]
[ROW][C]Meta Analysis of Goldfeld-Quandt test for Heteroskedasticity[/C][/ROW]
[ROW][C]Description[/C][C]# significant tests[/C][C]% significant tests[/C][C]OK/NOK[/C][/ROW]
[ROW][C]1% type I error level[/C][C]0[/C][C]0[/C][C]OK[/C][/ROW]
[ROW][C]5% type I error level[/C][C]0[/C][C]0[/C][C]OK[/C][/ROW]
[ROW][C]10% type I error level[/C][C]0[/C][C]0[/C][C]OK[/C][/ROW]
[/TABLE]
Source: https://freestatistics.org/blog/index.php?pk=280372&T=6

Globally Unique Identifier (entire table): ba.freestatistics.org/blog/index.php?pk=280372&T=6

As an alternative you can also use a QR Code:  

The GUIDs for individual cells are displayed in the table below:

Meta Analysis of Goldfeld-Quandt test for Heteroskedasticity
Description# significant tests% significant testsOK/NOK
1% type I error level00OK
5% type I error level00OK
10% type I error level00OK


Parameters (Session):
par1 = 1 ; par2 = Do not include Seasonal Dummies ; par3 = No Linear Trend ;
Parameters (R input):
par1 = 1 ; par2 = Do not include Seasonal Dummies ; par3 = No Linear Trend ;
R code (references can be found in the software module):
library(lattice)
library(lmtest)
n25 <- 25 #minimum number of obs. for Goldfeld-Quandt test
par1 <- as.numeric(par1)
x <- t(y)
k <- length(x[1,])
n <- length(x[,1])
x1 <- cbind(x[,par1], x[,1:k!=par1])
mycolnames <- c(colnames(x)[par1], colnames(x)[1:k!=par1])
colnames(x1) <- mycolnames #colnames(x)[par1]
x <- x1
if (par3 == 'First Differences'){
x2 <- array(0, dim=c(n-1,k), dimnames=list(1:(n-1), paste('(1-B)',colnames(x),sep='')))
for (i in 1:n-1) {
for (j in 1:k) {
x2[i,j] <- x[i+1,j] - x[i,j]
}
}
x <- x2
}
if (par2 == 'Include Monthly Dummies'){
x2 <- array(0, dim=c(n,11), dimnames=list(1:n, paste('M', seq(1:11), sep ='')))
for (i in 1:11){
x2[seq(i,n,12),i] <- 1
}
x <- cbind(x, x2)
}
if (par2 == 'Include Quarterly Dummies'){
x2 <- array(0, dim=c(n,3), dimnames=list(1:n, paste('Q', seq(1:3), sep ='')))
for (i in 1:3){
x2[seq(i,n,4),i] <- 1
}
x <- cbind(x, x2)
}
k <- length(x[1,])
if (par3 == 'Linear Trend'){
x <- cbind(x, c(1:n))
colnames(x)[k+1] <- 't'
}
x
k <- length(x[1,])
df <- as.data.frame(x)
(mylm <- lm(df))
(mysum <- summary(mylm))
if (n > n25) {
kp3 <- k + 3
nmkm3 <- n - k - 3
gqarr <- array(NA, dim=c(nmkm3-kp3+1,3))
numgqtests <- 0
numsignificant1 <- 0
numsignificant5 <- 0
numsignificant10 <- 0
for (mypoint in kp3:nmkm3) {
j <- 0
numgqtests <- numgqtests + 1
for (myalt in c('greater', 'two.sided', 'less')) {
j <- j + 1
gqarr[mypoint-kp3+1,j] <- gqtest(mylm, point=mypoint, alternative=myalt)$p.value
}
if (gqarr[mypoint-kp3+1,2] < 0.01) numsignificant1 <- numsignificant1 + 1
if (gqarr[mypoint-kp3+1,2] < 0.05) numsignificant5 <- numsignificant5 + 1
if (gqarr[mypoint-kp3+1,2] < 0.10) numsignificant10 <- numsignificant10 + 1
}
gqarr
}
bitmap(file='test0.png')
plot(x[,1], type='l', main='Actuals and Interpolation', ylab='value of Actuals and Interpolation (dots)', xlab='time or index')
points(x[,1]-mysum$resid)
grid()
dev.off()
bitmap(file='test1.png')
plot(mysum$resid, type='b', pch=19, main='Residuals', ylab='value of Residuals', xlab='time or index')
grid()
dev.off()
bitmap(file='test2.png')
hist(mysum$resid, main='Residual Histogram', xlab='values of Residuals')
grid()
dev.off()
bitmap(file='test3.png')
densityplot(~mysum$resid,col='black',main='Residual Density Plot', xlab='values of Residuals')
dev.off()
bitmap(file='test4.png')
qqnorm(mysum$resid, main='Residual Normal Q-Q Plot')
qqline(mysum$resid)
grid()
dev.off()
(myerror <- as.ts(mysum$resid))
bitmap(file='test5.png')
dum <- cbind(lag(myerror,k=1),myerror)
dum
dum1 <- dum[2:length(myerror),]
dum1
z <- as.data.frame(dum1)
z
plot(z,main=paste('Residual Lag plot, lowess, and regression line'), ylab='values of Residuals', xlab='lagged values of Residuals')
lines(lowess(z))
abline(lm(z))
grid()
dev.off()
bitmap(file='test6.png')
acf(mysum$resid, lag.max=length(mysum$resid)/2, main='Residual Autocorrelation Function')
grid()
dev.off()
bitmap(file='test7.png')
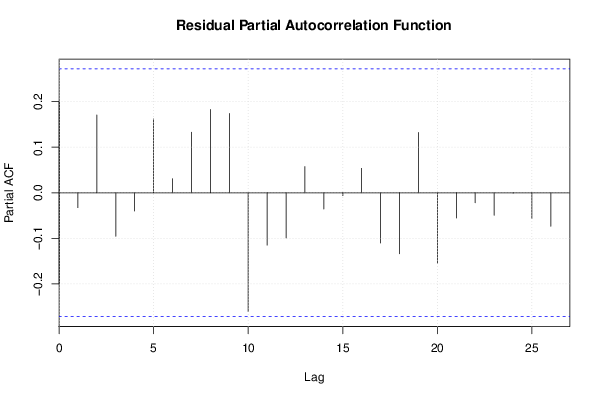
pacf(mysum$resid, lag.max=length(mysum$resid)/2, main='Residual Partial Autocorrelation Function')
grid()
dev.off()
bitmap(file='test8.png')
opar <- par(mfrow = c(2,2), oma = c(0, 0, 1.1, 0))
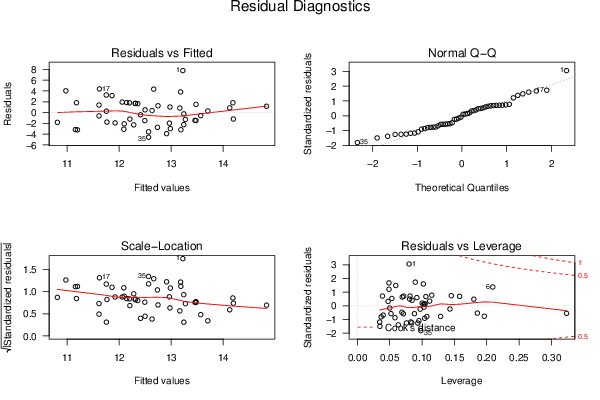
plot(mylm, las = 1, sub='Residual Diagnostics')
par(opar)
dev.off()
if (n > n25) {
bitmap(file='test9.png')
plot(kp3:nmkm3,gqarr[,2], main='Goldfeld-Quandt test',ylab='2-sided p-value',xlab='breakpoint')
grid()
dev.off()
}
load(file='createtable')
a<-table.start()
a<-table.row.start(a)
a<-table.element(a, 'Multiple Linear Regression - Estimated Regression Equation', 1, TRUE)
a<-table.row.end(a)
myeq <- colnames(x)[1]
myeq <- paste(myeq, '[t] = ', sep='')
for (i in 1:k){
if (mysum$coefficients[i,1] > 0) myeq <- paste(myeq, '+', '')
myeq <- paste(myeq, signif(mysum$coefficients[i,1],6), sep=' ')
if (rownames(mysum$coefficients)[i] != '(Intercept)') {
myeq <- paste(myeq, rownames(mysum$coefficients)[i], sep='')
if (rownames(mysum$coefficients)[i] != 't') myeq <- paste(myeq, '[t]', sep='')
}
}
myeq <- paste(myeq, ' + e[t]')
a<-table.row.start(a)
a<-table.element(a, myeq)
a<-table.row.end(a)
a<-table.end(a)
table.save(a,file='mytable1.tab')
a<-table.start()
a<-table.row.start(a)
a<-table.element(a,hyperlink('ols1.htm','Multiple Linear Regression - Ordinary Least Squares',''), 6, TRUE)
a<-table.row.end(a)
a<-table.row.start(a)
a<-table.element(a,'Variable',header=TRUE)
a<-table.element(a,'Parameter',header=TRUE)
a<-table.element(a,'S.D.',header=TRUE)
a<-table.element(a,'T-STAT
H0: parameter = 0',header=TRUE)
a<-table.element(a,'2-tail p-value',header=TRUE)
a<-table.element(a,'1-tail p-value',header=TRUE)
a<-table.row.end(a)
for (i in 1:k){
a<-table.row.start(a)
a<-table.element(a,rownames(mysum$coefficients)[i],header=TRUE)
a<-table.element(a,signif(mysum$coefficients[i,1],6))
a<-table.element(a, signif(mysum$coefficients[i,2],6))
a<-table.element(a, signif(mysum$coefficients[i,3],4))
a<-table.element(a, signif(mysum$coefficients[i,4],6))
a<-table.element(a, signif(mysum$coefficients[i,4]/2,6))
a<-table.row.end(a)
}
a<-table.end(a)
table.save(a,file='mytable2.tab')
a<-table.start()
a<-table.row.start(a)
a<-table.element(a, 'Multiple Linear Regression - Regression Statistics', 2, TRUE)
a<-table.row.end(a)
a<-table.row.start(a)
a<-table.element(a, 'Multiple R',1,TRUE)
a<-table.element(a, signif(sqrt(mysum$r.squared),6))
a<-table.row.end(a)
a<-table.row.start(a)
a<-table.element(a, 'R-squared',1,TRUE)
a<-table.element(a, signif(mysum$r.squared,6))
a<-table.row.end(a)
a<-table.row.start(a)
a<-table.element(a, 'Adjusted R-squared',1,TRUE)
a<-table.element(a, signif(mysum$adj.r.squared,6))
a<-table.row.end(a)
a<-table.row.start(a)
a<-table.element(a, 'F-TEST (value)',1,TRUE)
a<-table.element(a, signif(mysum$fstatistic[1],6))
a<-table.row.end(a)
a<-table.row.start(a)
a<-table.element(a, 'F-TEST (DF numerator)',1,TRUE)
a<-table.element(a, signif(mysum$fstatistic[2],6))
a<-table.row.end(a)
a<-table.row.start(a)
a<-table.element(a, 'F-TEST (DF denominator)',1,TRUE)
a<-table.element(a, signif(mysum$fstatistic[3],6))
a<-table.row.end(a)
a<-table.row.start(a)
a<-table.element(a, 'p-value',1,TRUE)
a<-table.element(a, signif(1-pf(mysum$fstatistic[1],mysum$fstatistic[2],mysum$fstatistic[3]),6))
a<-table.row.end(a)
a<-table.row.start(a)
a<-table.element(a, 'Multiple Linear Regression - Residual Statistics', 2, TRUE)
a<-table.row.end(a)
a<-table.row.start(a)
a<-table.element(a, 'Residual Standard Deviation',1,TRUE)
a<-table.element(a, signif(mysum$sigma,6))
a<-table.row.end(a)
a<-table.row.start(a)
a<-table.element(a, 'Sum Squared Residuals',1,TRUE)
a<-table.element(a, signif(sum(myerror*myerror),6))
a<-table.row.end(a)
a<-table.end(a)
table.save(a,file='mytable3.tab')
a<-table.start()
a<-table.row.start(a)
a<-table.element(a, 'Multiple Linear Regression - Actuals, Interpolation, and Residuals', 4, TRUE)
a<-table.row.end(a)
a<-table.row.start(a)
a<-table.element(a, 'Time or Index', 1, TRUE)
a<-table.element(a, 'Actuals', 1, TRUE)
a<-table.element(a, 'Interpolation
Forecast', 1, TRUE)
a<-table.element(a, 'Residuals
Prediction Error', 1, TRUE)
a<-table.row.end(a)
for (i in 1:n) {
a<-table.row.start(a)
a<-table.element(a,i, 1, TRUE)
a<-table.element(a,signif(x[i],6))
a<-table.element(a,signif(x[i]-mysum$resid[i],6))
a<-table.element(a,signif(mysum$resid[i],6))
a<-table.row.end(a)
}
a<-table.end(a)
table.save(a,file='mytable4.tab')
if (n > n25) {
a<-table.start()
a<-table.row.start(a)
a<-table.element(a,'Goldfeld-Quandt test for Heteroskedasticity',4,TRUE)
a<-table.row.end(a)
a<-table.row.start(a)
a<-table.element(a,'p-values',header=TRUE)
a<-table.element(a,'Alternative Hypothesis',3,header=TRUE)
a<-table.row.end(a)
a<-table.row.start(a)
a<-table.element(a,'breakpoint index',header=TRUE)
a<-table.element(a,'greater',header=TRUE)
a<-table.element(a,'2-sided',header=TRUE)
a<-table.element(a,'less',header=TRUE)
a<-table.row.end(a)
for (mypoint in kp3:nmkm3) {
a<-table.row.start(a)
a<-table.element(a,mypoint,header=TRUE)
a<-table.element(a,signif(gqarr[mypoint-kp3+1,1],6))
a<-table.element(a,signif(gqarr[mypoint-kp3+1,2],6))
a<-table.element(a,signif(gqarr[mypoint-kp3+1,3],6))
a<-table.row.end(a)
}
a<-table.end(a)
table.save(a,file='mytable5.tab')
a<-table.start()
a<-table.row.start(a)
a<-table.element(a,'Meta Analysis of Goldfeld-Quandt test for Heteroskedasticity',4,TRUE)
a<-table.row.end(a)
a<-table.row.start(a)
a<-table.element(a,'Description',header=TRUE)
a<-table.element(a,'# significant tests',header=TRUE)
a<-table.element(a,'% significant tests',header=TRUE)
a<-table.element(a,'OK/NOK',header=TRUE)
a<-table.row.end(a)
a<-table.row.start(a)
a<-table.element(a,'1% type I error level',header=TRUE)
a<-table.element(a,signif(numsignificant1,6))
a<-table.element(a,signif(numsignificant1/numgqtests,6))
if (numsignificant1/numgqtests < 0.01) dum <- 'OK' else dum <- 'NOK'
a<-table.element(a,dum)
a<-table.row.end(a)
a<-table.row.start(a)
a<-table.element(a,'5% type I error level',header=TRUE)
a<-table.element(a,signif(numsignificant5,6))
a<-table.element(a,signif(numsignificant5/numgqtests,6))
if (numsignificant5/numgqtests < 0.05) dum <- 'OK' else dum <- 'NOK'
a<-table.element(a,dum)
a<-table.row.end(a)
a<-table.row.start(a)
a<-table.element(a,'10% type I error level',header=TRUE)
a<-table.element(a,signif(numsignificant10,6))
a<-table.element(a,signif(numsignificant10/numgqtests,6))
if (numsignificant10/numgqtests < 0.1) dum <- 'OK' else dum <- 'NOK'
a<-table.element(a,dum)
a<-table.row.end(a)
a<-table.end(a)
table.save(a,file='mytable6.tab')
}