Free Statistics

of Irreproducible Research!

Author's title

Author*The author of this computation has been verified*
R Software Modulerwasp_multipleregression.wasp
Title produced by softwareMultiple Regression
Date of computationTue, 24 Nov 2009 04:34:57 -0700
Cite this page as followsStatistical Computations at FreeStatistics.org, Office for Research Development and Education, URL https://freestatistics.org/blog/index.php?v=date/2009/Nov/24/t1259063254rbqmlg6qdwrghxm.htm/, Retrieved Thu, 31 Oct 2024 22:50:08 +0000
Statistical Computations at FreeStatistics.org, Office for Research Development and Education, URL https://freestatistics.org/blog/index.php?pk=59001, Retrieved Thu, 31 Oct 2024 22:50:08 +0000
QR Codes:

Original text written by user:
IsPrivate?No (this computation is public)
User-defined keywords
Estimated Impact267
Family? (F = Feedback message, R = changed R code, M = changed R Module, P = changed Parameters, D = changed Data)
-       [Multiple Regression] [] [2009-11-24 11:34:57] [4d89445a8ea4b299af2ee123046cffa6] [Current]
-   P     [Multiple Regression] [] [2009-11-24 11:57:53] [f57b281e621ed7dff28b90886f5aa97c]
-   PD    [Multiple Regression] [] [2009-11-24 12:09:41] [f57b281e621ed7dff28b90886f5aa97c]
-    D      [Multiple Regression] [] [2009-11-24 12:16:30] [f57b281e621ed7dff28b90886f5aa97c]
- R  D        [Multiple Regression] [Vertragingen] [2010-12-18 11:45:57] [0ed8ad64bdfc801eaa95d5097964fc04]
-    D        [Multiple Regression] [2 vertragingen] [2010-12-18 12:25:58] [0ed8ad64bdfc801eaa95d5097964fc04]
Feedback Forum

Post a new message
Dataseries X:
97.4	116.7
97	109
105.4	119.5
102.7	115.1
98.1	107.1
104.5	109.7
87.4	110.4
89.9	105
109.8	115.8
111.7	116.4
98.6	111.1
96.9	119.5
95.1	110.9
97	115.1
112.7	125.2
102.9	116
97.4	112.9
111.4	121.7
87.4	123.2
96.8	116.6
114.1	136.2
110.3	120.9
103.9	119.6
101.6	125.9
94.6	116.1
95.9	107.5
104.7	116.7
102.8	112.5
98.1	113
113.9	126.4
80.9	114.1
95.7	112.5
113.2	112.4
105.9	113.1
108.8	116.3
102.3	111.7
99	118.8
100.7	116.5
115.5	125.1
100.7	113.1
109.9	119.6
114.6	114.4
85.4	114
100.5	117.8
114.8	117
116.5	120.9
112.9	115
102	117.3
106	119.4
105.3	114.9
118.8	125.8
106.1	117.6
109.3	117.6
117.2	114.9
92.5	121.9
104.2	117
112.5	106.4
122.4	110.5
113.3	113.6
100	114.2


Summary of computational transaction
Raw Inputview raw input (R code)
Raw Outputview raw output of R engine
Computing time6 seconds
R Server'Gwilym Jenkins' @ 72.249.127.135

\begin{tabular}{lllllllll}
\hline
Summary of computational transaction \tabularnewline
Raw Input & view raw input (R code)  \tabularnewline
Raw Output & view raw output of R engine  \tabularnewline
Computing time & 6 seconds \tabularnewline
R Server & 'Gwilym Jenkins' @ 72.249.127.135 \tabularnewline
\hline
\end{tabular}
%Source: https://freestatistics.org/blog/index.php?pk=59001&T=0

[TABLE]
[ROW][C]Summary of computational transaction[/C][/ROW]
[ROW][C]Raw Input[/C][C]view raw input (R code) [/C][/ROW]
[ROW][C]Raw Output[/C][C]view raw output of R engine [/C][/ROW]
[ROW][C]Computing time[/C][C]6 seconds[/C][/ROW]
[ROW][C]R Server[/C][C]'Gwilym Jenkins' @ 72.249.127.135[/C][/ROW]
[/TABLE]
Source: https://freestatistics.org/blog/index.php?pk=59001&T=0

Globally Unique Identifier (entire table): ba.freestatistics.org/blog/index.php?pk=59001&T=0

As an alternative you can also use a QR Code:  

The GUIDs for individual cells are displayed in the table below:

Summary of computational transaction
Raw Inputview raw input (R code)
Raw Outputview raw output of R engine
Computing time6 seconds
R Server'Gwilym Jenkins' @ 72.249.127.135


Multiple Linear Regression - Estimated Regression Equation
ipchn[t] = + 72.0310065429256 + 0.454345599215138Tip[t] -0.367700417679697M1[t] -4.49300307308312M2[t] -0.194193207476405M3[t] -3.98677708605355M4[t] -4.58869119843028M5[t] -5.64310424677002M6[t] + 5.2881430931375M7[t] -2.51335481846447M8[t] -5.75753778233051M9[t] -7.17562366995377M10[t] -5.75315845855307M11[t] + e[t]

\begin{tabular}{lllllllll}
\hline
Multiple Linear Regression - Estimated Regression Equation \tabularnewline
ipchn[t] =  +  72.0310065429256 +  0.454345599215138Tip[t] -0.367700417679697M1[t] -4.49300307308312M2[t] -0.194193207476405M3[t] -3.98677708605355M4[t] -4.58869119843028M5[t] -5.64310424677002M6[t] +  5.2881430931375M7[t] -2.51335481846447M8[t] -5.75753778233051M9[t] -7.17562366995377M10[t] -5.75315845855307M11[t]  + e[t] \tabularnewline
\hline
\end{tabular}
%Source: https://freestatistics.org/blog/index.php?pk=59001&T=1

[TABLE]
[ROW][C]Multiple Linear Regression - Estimated Regression Equation[/C][/ROW]
[ROW][C]ipchn[t] =  +  72.0310065429256 +  0.454345599215138Tip[t] -0.367700417679697M1[t] -4.49300307308312M2[t] -0.194193207476405M3[t] -3.98677708605355M4[t] -4.58869119843028M5[t] -5.64310424677002M6[t] +  5.2881430931375M7[t] -2.51335481846447M8[t] -5.75753778233051M9[t] -7.17562366995377M10[t] -5.75315845855307M11[t]  + e[t][/C][/ROW]
[/TABLE]
Source: https://freestatistics.org/blog/index.php?pk=59001&T=1

Globally Unique Identifier (entire table): ba.freestatistics.org/blog/index.php?pk=59001&T=1

As an alternative you can also use a QR Code:  

The GUIDs for individual cells are displayed in the table below:

Multiple Linear Regression - Estimated Regression Equation
ipchn[t] = + 72.0310065429256 + 0.454345599215138Tip[t] -0.367700417679697M1[t] -4.49300307308312M2[t] -0.194193207476405M3[t] -3.98677708605355M4[t] -4.58869119843028M5[t] -5.64310424677002M6[t] + 5.2881430931375M7[t] -2.51335481846447M8[t] -5.75753778233051M9[t] -7.17562366995377M10[t] -5.75315845855307M11[t] + e[t]


Multiple Linear Regression - Ordinary Least Squares
VariableParameterS.D.T-STATH0: parameter = 02-tail p-value1-tail p-value
(Intercept)72.031006542925615.5433624.63422.9e-051.4e-05
Tip0.4543455992151380.15292.97150.0046590.00233
M1-0.3677004176796973.236915-0.11360.9100420.455021
M2-4.493003073083123.22724-1.39220.1704110.085205
M3-0.1941932074764053.623232-0.05360.9574840.478742
M4-3.986777086053553.242583-1.22950.2250020.112501
M5-4.588691198430283.234822-1.41850.1626330.081317
M6-5.643104246770023.688326-1.530.1327220.066361
M75.28814309313753.8533891.37230.1764730.088237
M8-2.513354818464473.255927-0.77190.4440190.222009
M9-5.757537782330513.730818-1.54320.129480.06474
M10-7.175623669953773.768407-1.90420.0630220.031511
M11-5.753158458553073.390656-1.69680.0963550.048177

\begin{tabular}{lllllllll}
\hline
Multiple Linear Regression - Ordinary Least Squares \tabularnewline
Variable & Parameter & S.D. & T-STATH0: parameter = 0 & 2-tail p-value & 1-tail p-value \tabularnewline
(Intercept) & 72.0310065429256 & 15.543362 & 4.6342 & 2.9e-05 & 1.4e-05 \tabularnewline
Tip & 0.454345599215138 & 0.1529 & 2.9715 & 0.004659 & 0.00233 \tabularnewline
M1 & -0.367700417679697 & 3.236915 & -0.1136 & 0.910042 & 0.455021 \tabularnewline
M2 & -4.49300307308312 & 3.22724 & -1.3922 & 0.170411 & 0.085205 \tabularnewline
M3 & -0.194193207476405 & 3.623232 & -0.0536 & 0.957484 & 0.478742 \tabularnewline
M4 & -3.98677708605355 & 3.242583 & -1.2295 & 0.225002 & 0.112501 \tabularnewline
M5 & -4.58869119843028 & 3.234822 & -1.4185 & 0.162633 & 0.081317 \tabularnewline
M6 & -5.64310424677002 & 3.688326 & -1.53 & 0.132722 & 0.066361 \tabularnewline
M7 & 5.2881430931375 & 3.853389 & 1.3723 & 0.176473 & 0.088237 \tabularnewline
M8 & -2.51335481846447 & 3.255927 & -0.7719 & 0.444019 & 0.222009 \tabularnewline
M9 & -5.75753778233051 & 3.730818 & -1.5432 & 0.12948 & 0.06474 \tabularnewline
M10 & -7.17562366995377 & 3.768407 & -1.9042 & 0.063022 & 0.031511 \tabularnewline
M11 & -5.75315845855307 & 3.390656 & -1.6968 & 0.096355 & 0.048177 \tabularnewline
\hline
\end{tabular}
%Source: https://freestatistics.org/blog/index.php?pk=59001&T=2

[TABLE]
[ROW][C]Multiple Linear Regression - Ordinary Least Squares[/C][/ROW]
[ROW][C]Variable[/C][C]Parameter[/C][C]S.D.[/C][C]T-STATH0: parameter = 0[/C][C]2-tail p-value[/C][C]1-tail p-value[/C][/ROW]
[ROW][C](Intercept)[/C][C]72.0310065429256[/C][C]15.543362[/C][C]4.6342[/C][C]2.9e-05[/C][C]1.4e-05[/C][/ROW]
[ROW][C]Tip[/C][C]0.454345599215138[/C][C]0.1529[/C][C]2.9715[/C][C]0.004659[/C][C]0.00233[/C][/ROW]
[ROW][C]M1[/C][C]-0.367700417679697[/C][C]3.236915[/C][C]-0.1136[/C][C]0.910042[/C][C]0.455021[/C][/ROW]
[ROW][C]M2[/C][C]-4.49300307308312[/C][C]3.22724[/C][C]-1.3922[/C][C]0.170411[/C][C]0.085205[/C][/ROW]
[ROW][C]M3[/C][C]-0.194193207476405[/C][C]3.623232[/C][C]-0.0536[/C][C]0.957484[/C][C]0.478742[/C][/ROW]
[ROW][C]M4[/C][C]-3.98677708605355[/C][C]3.242583[/C][C]-1.2295[/C][C]0.225002[/C][C]0.112501[/C][/ROW]
[ROW][C]M5[/C][C]-4.58869119843028[/C][C]3.234822[/C][C]-1.4185[/C][C]0.162633[/C][C]0.081317[/C][/ROW]
[ROW][C]M6[/C][C]-5.64310424677002[/C][C]3.688326[/C][C]-1.53[/C][C]0.132722[/C][C]0.066361[/C][/ROW]
[ROW][C]M7[/C][C]5.2881430931375[/C][C]3.853389[/C][C]1.3723[/C][C]0.176473[/C][C]0.088237[/C][/ROW]
[ROW][C]M8[/C][C]-2.51335481846447[/C][C]3.255927[/C][C]-0.7719[/C][C]0.444019[/C][C]0.222009[/C][/ROW]
[ROW][C]M9[/C][C]-5.75753778233051[/C][C]3.730818[/C][C]-1.5432[/C][C]0.12948[/C][C]0.06474[/C][/ROW]
[ROW][C]M10[/C][C]-7.17562366995377[/C][C]3.768407[/C][C]-1.9042[/C][C]0.063022[/C][C]0.031511[/C][/ROW]
[ROW][C]M11[/C][C]-5.75315845855307[/C][C]3.390656[/C][C]-1.6968[/C][C]0.096355[/C][C]0.048177[/C][/ROW]
[/TABLE]
Source: https://freestatistics.org/blog/index.php?pk=59001&T=2

Globally Unique Identifier (entire table): ba.freestatistics.org/blog/index.php?pk=59001&T=2

As an alternative you can also use a QR Code:  

The GUIDs for individual cells are displayed in the table below:

Multiple Linear Regression - Ordinary Least Squares
VariableParameterS.D.T-STATH0: parameter = 02-tail p-value1-tail p-value
(Intercept)72.031006542925615.5433624.63422.9e-051.4e-05
Tip0.4543455992151380.15292.97150.0046590.00233
M1-0.3677004176796973.236915-0.11360.9100420.455021
M2-4.493003073083123.22724-1.39220.1704110.085205
M3-0.1941932074764053.623232-0.05360.9574840.478742
M4-3.986777086053553.242583-1.22950.2250020.112501
M5-4.588691198430283.234822-1.41850.1626330.081317
M6-5.643104246770023.688326-1.530.1327220.066361
M75.28814309313753.8533891.37230.1764730.088237
M8-2.513354818464473.255927-0.77190.4440190.222009
M9-5.757537782330513.730818-1.54320.129480.06474
M10-7.175623669953773.768407-1.90420.0630220.031511
M11-5.753158458553073.390656-1.69680.0963550.048177


Multiple Linear Regression - Regression Statistics
Multiple R0.570122019367822
R-squared0.325039116968044
Adjusted R-squared0.152708678747119
F-TEST (value)1.88613874788242
F-TEST (DF numerator)12
F-TEST (DF denominator)47
p-value0.0610475160037202
Multiple Linear Regression - Residual Statistics
Residual Standard Deviation5.09179673527599
Sum Squared Residuals1218.54051768826

\begin{tabular}{lllllllll}
\hline
Multiple Linear Regression - Regression Statistics \tabularnewline
Multiple R & 0.570122019367822 \tabularnewline
R-squared & 0.325039116968044 \tabularnewline
Adjusted R-squared & 0.152708678747119 \tabularnewline
F-TEST (value) & 1.88613874788242 \tabularnewline
F-TEST (DF numerator) & 12 \tabularnewline
F-TEST (DF denominator) & 47 \tabularnewline
p-value & 0.0610475160037202 \tabularnewline
Multiple Linear Regression - Residual Statistics \tabularnewline
Residual Standard Deviation & 5.09179673527599 \tabularnewline
Sum Squared Residuals & 1218.54051768826 \tabularnewline
\hline
\end{tabular}
%Source: https://freestatistics.org/blog/index.php?pk=59001&T=3

[TABLE]
[ROW][C]Multiple Linear Regression - Regression Statistics[/C][/ROW]
[ROW][C]Multiple R[/C][C]0.570122019367822[/C][/ROW]
[ROW][C]R-squared[/C][C]0.325039116968044[/C][/ROW]
[ROW][C]Adjusted R-squared[/C][C]0.152708678747119[/C][/ROW]
[ROW][C]F-TEST (value)[/C][C]1.88613874788242[/C][/ROW]
[ROW][C]F-TEST (DF numerator)[/C][C]12[/C][/ROW]
[ROW][C]F-TEST (DF denominator)[/C][C]47[/C][/ROW]
[ROW][C]p-value[/C][C]0.0610475160037202[/C][/ROW]
[ROW][C]Multiple Linear Regression - Residual Statistics[/C][/ROW]
[ROW][C]Residual Standard Deviation[/C][C]5.09179673527599[/C][/ROW]
[ROW][C]Sum Squared Residuals[/C][C]1218.54051768826[/C][/ROW]
[/TABLE]
Source: https://freestatistics.org/blog/index.php?pk=59001&T=3

Globally Unique Identifier (entire table): ba.freestatistics.org/blog/index.php?pk=59001&T=3

As an alternative you can also use a QR Code:  

The GUIDs for individual cells are displayed in the table below:

Multiple Linear Regression - Regression Statistics
Multiple R0.570122019367822
R-squared0.325039116968044
Adjusted R-squared0.152708678747119
F-TEST (value)1.88613874788242
F-TEST (DF numerator)12
F-TEST (DF denominator)47
p-value0.0610475160037202
Multiple Linear Regression - Residual Statistics
Residual Standard Deviation5.09179673527599
Sum Squared Residuals1218.54051768826


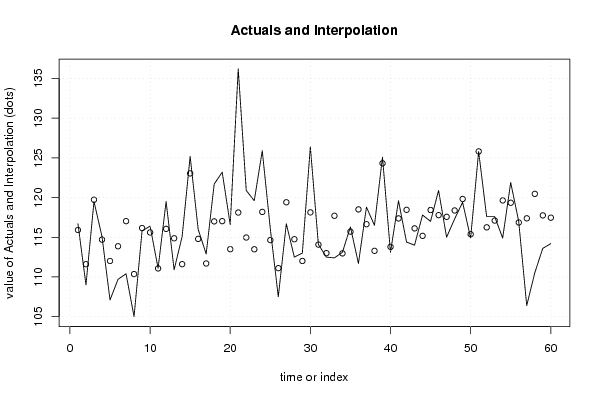
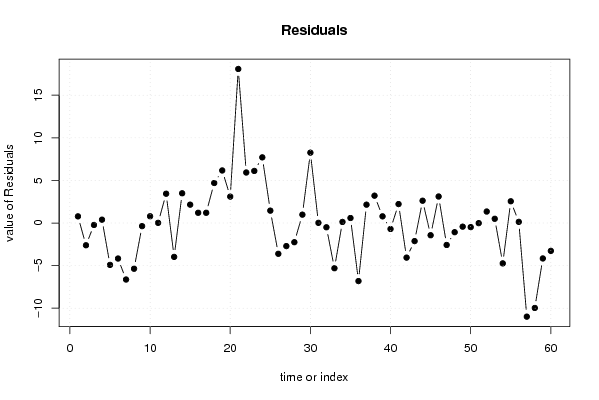
Multiple Linear Regression - Actuals, Interpolation, and Residuals
Time or IndexActualsInterpolationForecastResidualsPrediction Error
1116.7115.9165674888010.783432511199086
2109111.609526593711-2.60952659371103
3119.5119.724839492725-0.224839492724873
4115.1114.7055224962670.394477503733143
5107.1112.013618627500-4.91361862750048
6109.7113.867017414138-4.16701741413762
7110.4117.028955007466-6.62895500746629
8105110.363321093902-5.36332109390216
9115.8116.160615554417-0.36061555441738
10116.4115.6057863053030.794213694697134
11111.1111.0763241669850.0236758330147292
12119.5116.0570951068733.4429048931274
13110.9114.871572610606-3.97157261060565
14115.1111.6095265937113.49047340628900
15125.2123.0415623669952.15843763300463
16116114.7963916161101.20360838389012
17112.9111.695576708051.20442329195012
18121.7117.0020020487224.69799795127792
19123.2117.0289550074666.17104499253371
20116.6113.4983057284873.10169427151338
21136.2118.11430163104218.0856983689575
22120.9114.9697024664025.93029753359833
23119.6113.4843558428266.11564415717449
24125.9118.1925194231847.70748057681626
25116.1114.6443998109981.45560018900191
26107.5111.109746434574-3.60974643457434
27116.7119.406797573274-2.70679757327427
28112.5114.750957056188-2.25095705618836
29113112.0136186275000.98638137249952
30126.4118.137866046768.26213395324008
31114.1114.0757086125680.0242913874320967
32112.5112.99852556935-0.498525569349962
33112.4117.705390591749-5.30539059174884
34113.1112.9705818298550.129418170144920
35116.3115.7106492789800.589350721020324
36111.7118.510561342634-6.81056134263434
37118.8116.6435204475452.15647955245531
38116.5113.2906053108073.20939468919300
39125.1124.3137300447980.786269955202232
40113.1113.796831297837-0.696831297836579
41119.6117.3748966982392.22510330176088
42114.4118.455907966211-4.05590796621051
43114116.120263809036-2.12026380903602
44117.8115.1793844455832.62061555441737
45117118.432343550493-1.43234355049306
46120.9117.7866451815363.11335481846447
47115117.573466235762-2.57346623576174
48117.3118.374257662870-1.07425766286981
49119.4119.823939642051-0.423939642050653
50114.9115.380595067197-0.480595067196628
51125.8125.813070522208-0.0130705222077194
52117.6116.2502975335981.34970246640168
53117.6117.102289338710.497710661289967
54114.9119.63720652417-4.73720652416987
55121.9119.3461175634632.55388243653651
56117116.8604631626790.139536837321364
57106.4117.387348672298-10.9873486722982
58110.5120.467284216905-9.96728421690485
59113.6117.755204475448-4.1552044754478
60114.2117.465566464440-3.26556646443952

\begin{tabular}{lllllllll}
\hline
Multiple Linear Regression - Actuals, Interpolation, and Residuals \tabularnewline
Time or Index & Actuals & InterpolationForecast & ResidualsPrediction Error \tabularnewline
1 & 116.7 & 115.916567488801 & 0.783432511199086 \tabularnewline
2 & 109 & 111.609526593711 & -2.60952659371103 \tabularnewline
3 & 119.5 & 119.724839492725 & -0.224839492724873 \tabularnewline
4 & 115.1 & 114.705522496267 & 0.394477503733143 \tabularnewline
5 & 107.1 & 112.013618627500 & -4.91361862750048 \tabularnewline
6 & 109.7 & 113.867017414138 & -4.16701741413762 \tabularnewline
7 & 110.4 & 117.028955007466 & -6.62895500746629 \tabularnewline
8 & 105 & 110.363321093902 & -5.36332109390216 \tabularnewline
9 & 115.8 & 116.160615554417 & -0.36061555441738 \tabularnewline
10 & 116.4 & 115.605786305303 & 0.794213694697134 \tabularnewline
11 & 111.1 & 111.076324166985 & 0.0236758330147292 \tabularnewline
12 & 119.5 & 116.057095106873 & 3.4429048931274 \tabularnewline
13 & 110.9 & 114.871572610606 & -3.97157261060565 \tabularnewline
14 & 115.1 & 111.609526593711 & 3.49047340628900 \tabularnewline
15 & 125.2 & 123.041562366995 & 2.15843763300463 \tabularnewline
16 & 116 & 114.796391616110 & 1.20360838389012 \tabularnewline
17 & 112.9 & 111.69557670805 & 1.20442329195012 \tabularnewline
18 & 121.7 & 117.002002048722 & 4.69799795127792 \tabularnewline
19 & 123.2 & 117.028955007466 & 6.17104499253371 \tabularnewline
20 & 116.6 & 113.498305728487 & 3.10169427151338 \tabularnewline
21 & 136.2 & 118.114301631042 & 18.0856983689575 \tabularnewline
22 & 120.9 & 114.969702466402 & 5.93029753359833 \tabularnewline
23 & 119.6 & 113.484355842826 & 6.11564415717449 \tabularnewline
24 & 125.9 & 118.192519423184 & 7.70748057681626 \tabularnewline
25 & 116.1 & 114.644399810998 & 1.45560018900191 \tabularnewline
26 & 107.5 & 111.109746434574 & -3.60974643457434 \tabularnewline
27 & 116.7 & 119.406797573274 & -2.70679757327427 \tabularnewline
28 & 112.5 & 114.750957056188 & -2.25095705618836 \tabularnewline
29 & 113 & 112.013618627500 & 0.98638137249952 \tabularnewline
30 & 126.4 & 118.13786604676 & 8.26213395324008 \tabularnewline
31 & 114.1 & 114.075708612568 & 0.0242913874320967 \tabularnewline
32 & 112.5 & 112.99852556935 & -0.498525569349962 \tabularnewline
33 & 112.4 & 117.705390591749 & -5.30539059174884 \tabularnewline
34 & 113.1 & 112.970581829855 & 0.129418170144920 \tabularnewline
35 & 116.3 & 115.710649278980 & 0.589350721020324 \tabularnewline
36 & 111.7 & 118.510561342634 & -6.81056134263434 \tabularnewline
37 & 118.8 & 116.643520447545 & 2.15647955245531 \tabularnewline
38 & 116.5 & 113.290605310807 & 3.20939468919300 \tabularnewline
39 & 125.1 & 124.313730044798 & 0.786269955202232 \tabularnewline
40 & 113.1 & 113.796831297837 & -0.696831297836579 \tabularnewline
41 & 119.6 & 117.374896698239 & 2.22510330176088 \tabularnewline
42 & 114.4 & 118.455907966211 & -4.05590796621051 \tabularnewline
43 & 114 & 116.120263809036 & -2.12026380903602 \tabularnewline
44 & 117.8 & 115.179384445583 & 2.62061555441737 \tabularnewline
45 & 117 & 118.432343550493 & -1.43234355049306 \tabularnewline
46 & 120.9 & 117.786645181536 & 3.11335481846447 \tabularnewline
47 & 115 & 117.573466235762 & -2.57346623576174 \tabularnewline
48 & 117.3 & 118.374257662870 & -1.07425766286981 \tabularnewline
49 & 119.4 & 119.823939642051 & -0.423939642050653 \tabularnewline
50 & 114.9 & 115.380595067197 & -0.480595067196628 \tabularnewline
51 & 125.8 & 125.813070522208 & -0.0130705222077194 \tabularnewline
52 & 117.6 & 116.250297533598 & 1.34970246640168 \tabularnewline
53 & 117.6 & 117.10228933871 & 0.497710661289967 \tabularnewline
54 & 114.9 & 119.63720652417 & -4.73720652416987 \tabularnewline
55 & 121.9 & 119.346117563463 & 2.55388243653651 \tabularnewline
56 & 117 & 116.860463162679 & 0.139536837321364 \tabularnewline
57 & 106.4 & 117.387348672298 & -10.9873486722982 \tabularnewline
58 & 110.5 & 120.467284216905 & -9.96728421690485 \tabularnewline
59 & 113.6 & 117.755204475448 & -4.1552044754478 \tabularnewline
60 & 114.2 & 117.465566464440 & -3.26556646443952 \tabularnewline
\hline
\end{tabular}
%Source: https://freestatistics.org/blog/index.php?pk=59001&T=4

[TABLE]
[ROW][C]Multiple Linear Regression - Actuals, Interpolation, and Residuals[/C][/ROW]
[ROW][C]Time or Index[/C][C]Actuals[/C][C]InterpolationForecast[/C][C]ResidualsPrediction Error[/C][/ROW]
[ROW][C]1[/C][C]116.7[/C][C]115.916567488801[/C][C]0.783432511199086[/C][/ROW]
[ROW][C]2[/C][C]109[/C][C]111.609526593711[/C][C]-2.60952659371103[/C][/ROW]
[ROW][C]3[/C][C]119.5[/C][C]119.724839492725[/C][C]-0.224839492724873[/C][/ROW]
[ROW][C]4[/C][C]115.1[/C][C]114.705522496267[/C][C]0.394477503733143[/C][/ROW]
[ROW][C]5[/C][C]107.1[/C][C]112.013618627500[/C][C]-4.91361862750048[/C][/ROW]
[ROW][C]6[/C][C]109.7[/C][C]113.867017414138[/C][C]-4.16701741413762[/C][/ROW]
[ROW][C]7[/C][C]110.4[/C][C]117.028955007466[/C][C]-6.62895500746629[/C][/ROW]
[ROW][C]8[/C][C]105[/C][C]110.363321093902[/C][C]-5.36332109390216[/C][/ROW]
[ROW][C]9[/C][C]115.8[/C][C]116.160615554417[/C][C]-0.36061555441738[/C][/ROW]
[ROW][C]10[/C][C]116.4[/C][C]115.605786305303[/C][C]0.794213694697134[/C][/ROW]
[ROW][C]11[/C][C]111.1[/C][C]111.076324166985[/C][C]0.0236758330147292[/C][/ROW]
[ROW][C]12[/C][C]119.5[/C][C]116.057095106873[/C][C]3.4429048931274[/C][/ROW]
[ROW][C]13[/C][C]110.9[/C][C]114.871572610606[/C][C]-3.97157261060565[/C][/ROW]
[ROW][C]14[/C][C]115.1[/C][C]111.609526593711[/C][C]3.49047340628900[/C][/ROW]
[ROW][C]15[/C][C]125.2[/C][C]123.041562366995[/C][C]2.15843763300463[/C][/ROW]
[ROW][C]16[/C][C]116[/C][C]114.796391616110[/C][C]1.20360838389012[/C][/ROW]
[ROW][C]17[/C][C]112.9[/C][C]111.69557670805[/C][C]1.20442329195012[/C][/ROW]
[ROW][C]18[/C][C]121.7[/C][C]117.002002048722[/C][C]4.69799795127792[/C][/ROW]
[ROW][C]19[/C][C]123.2[/C][C]117.028955007466[/C][C]6.17104499253371[/C][/ROW]
[ROW][C]20[/C][C]116.6[/C][C]113.498305728487[/C][C]3.10169427151338[/C][/ROW]
[ROW][C]21[/C][C]136.2[/C][C]118.114301631042[/C][C]18.0856983689575[/C][/ROW]
[ROW][C]22[/C][C]120.9[/C][C]114.969702466402[/C][C]5.93029753359833[/C][/ROW]
[ROW][C]23[/C][C]119.6[/C][C]113.484355842826[/C][C]6.11564415717449[/C][/ROW]
[ROW][C]24[/C][C]125.9[/C][C]118.192519423184[/C][C]7.70748057681626[/C][/ROW]
[ROW][C]25[/C][C]116.1[/C][C]114.644399810998[/C][C]1.45560018900191[/C][/ROW]
[ROW][C]26[/C][C]107.5[/C][C]111.109746434574[/C][C]-3.60974643457434[/C][/ROW]
[ROW][C]27[/C][C]116.7[/C][C]119.406797573274[/C][C]-2.70679757327427[/C][/ROW]
[ROW][C]28[/C][C]112.5[/C][C]114.750957056188[/C][C]-2.25095705618836[/C][/ROW]
[ROW][C]29[/C][C]113[/C][C]112.013618627500[/C][C]0.98638137249952[/C][/ROW]
[ROW][C]30[/C][C]126.4[/C][C]118.13786604676[/C][C]8.26213395324008[/C][/ROW]
[ROW][C]31[/C][C]114.1[/C][C]114.075708612568[/C][C]0.0242913874320967[/C][/ROW]
[ROW][C]32[/C][C]112.5[/C][C]112.99852556935[/C][C]-0.498525569349962[/C][/ROW]
[ROW][C]33[/C][C]112.4[/C][C]117.705390591749[/C][C]-5.30539059174884[/C][/ROW]
[ROW][C]34[/C][C]113.1[/C][C]112.970581829855[/C][C]0.129418170144920[/C][/ROW]
[ROW][C]35[/C][C]116.3[/C][C]115.710649278980[/C][C]0.589350721020324[/C][/ROW]
[ROW][C]36[/C][C]111.7[/C][C]118.510561342634[/C][C]-6.81056134263434[/C][/ROW]
[ROW][C]37[/C][C]118.8[/C][C]116.643520447545[/C][C]2.15647955245531[/C][/ROW]
[ROW][C]38[/C][C]116.5[/C][C]113.290605310807[/C][C]3.20939468919300[/C][/ROW]
[ROW][C]39[/C][C]125.1[/C][C]124.313730044798[/C][C]0.786269955202232[/C][/ROW]
[ROW][C]40[/C][C]113.1[/C][C]113.796831297837[/C][C]-0.696831297836579[/C][/ROW]
[ROW][C]41[/C][C]119.6[/C][C]117.374896698239[/C][C]2.22510330176088[/C][/ROW]
[ROW][C]42[/C][C]114.4[/C][C]118.455907966211[/C][C]-4.05590796621051[/C][/ROW]
[ROW][C]43[/C][C]114[/C][C]116.120263809036[/C][C]-2.12026380903602[/C][/ROW]
[ROW][C]44[/C][C]117.8[/C][C]115.179384445583[/C][C]2.62061555441737[/C][/ROW]
[ROW][C]45[/C][C]117[/C][C]118.432343550493[/C][C]-1.43234355049306[/C][/ROW]
[ROW][C]46[/C][C]120.9[/C][C]117.786645181536[/C][C]3.11335481846447[/C][/ROW]
[ROW][C]47[/C][C]115[/C][C]117.573466235762[/C][C]-2.57346623576174[/C][/ROW]
[ROW][C]48[/C][C]117.3[/C][C]118.374257662870[/C][C]-1.07425766286981[/C][/ROW]
[ROW][C]49[/C][C]119.4[/C][C]119.823939642051[/C][C]-0.423939642050653[/C][/ROW]
[ROW][C]50[/C][C]114.9[/C][C]115.380595067197[/C][C]-0.480595067196628[/C][/ROW]
[ROW][C]51[/C][C]125.8[/C][C]125.813070522208[/C][C]-0.0130705222077194[/C][/ROW]
[ROW][C]52[/C][C]117.6[/C][C]116.250297533598[/C][C]1.34970246640168[/C][/ROW]
[ROW][C]53[/C][C]117.6[/C][C]117.10228933871[/C][C]0.497710661289967[/C][/ROW]
[ROW][C]54[/C][C]114.9[/C][C]119.63720652417[/C][C]-4.73720652416987[/C][/ROW]
[ROW][C]55[/C][C]121.9[/C][C]119.346117563463[/C][C]2.55388243653651[/C][/ROW]
[ROW][C]56[/C][C]117[/C][C]116.860463162679[/C][C]0.139536837321364[/C][/ROW]
[ROW][C]57[/C][C]106.4[/C][C]117.387348672298[/C][C]-10.9873486722982[/C][/ROW]
[ROW][C]58[/C][C]110.5[/C][C]120.467284216905[/C][C]-9.96728421690485[/C][/ROW]
[ROW][C]59[/C][C]113.6[/C][C]117.755204475448[/C][C]-4.1552044754478[/C][/ROW]
[ROW][C]60[/C][C]114.2[/C][C]117.465566464440[/C][C]-3.26556646443952[/C][/ROW]
[/TABLE]
Source: https://freestatistics.org/blog/index.php?pk=59001&T=4

Globally Unique Identifier (entire table): ba.freestatistics.org/blog/index.php?pk=59001&T=4

As an alternative you can also use a QR Code:  

The GUIDs for individual cells are displayed in the table below:

Multiple Linear Regression - Actuals, Interpolation, and Residuals
Time or IndexActualsInterpolationForecastResidualsPrediction Error
1116.7115.9165674888010.783432511199086
2109111.609526593711-2.60952659371103
3119.5119.724839492725-0.224839492724873
4115.1114.7055224962670.394477503733143
5107.1112.013618627500-4.91361862750048
6109.7113.867017414138-4.16701741413762
7110.4117.028955007466-6.62895500746629
8105110.363321093902-5.36332109390216
9115.8116.160615554417-0.36061555441738
10116.4115.6057863053030.794213694697134
11111.1111.0763241669850.0236758330147292
12119.5116.0570951068733.4429048931274
13110.9114.871572610606-3.97157261060565
14115.1111.6095265937113.49047340628900
15125.2123.0415623669952.15843763300463
16116114.7963916161101.20360838389012
17112.9111.695576708051.20442329195012
18121.7117.0020020487224.69799795127792
19123.2117.0289550074666.17104499253371
20116.6113.4983057284873.10169427151338
21136.2118.11430163104218.0856983689575
22120.9114.9697024664025.93029753359833
23119.6113.4843558428266.11564415717449
24125.9118.1925194231847.70748057681626
25116.1114.6443998109981.45560018900191
26107.5111.109746434574-3.60974643457434
27116.7119.406797573274-2.70679757327427
28112.5114.750957056188-2.25095705618836
29113112.0136186275000.98638137249952
30126.4118.137866046768.26213395324008
31114.1114.0757086125680.0242913874320967
32112.5112.99852556935-0.498525569349962
33112.4117.705390591749-5.30539059174884
34113.1112.9705818298550.129418170144920
35116.3115.7106492789800.589350721020324
36111.7118.510561342634-6.81056134263434
37118.8116.6435204475452.15647955245531
38116.5113.2906053108073.20939468919300
39125.1124.3137300447980.786269955202232
40113.1113.796831297837-0.696831297836579
41119.6117.3748966982392.22510330176088
42114.4118.455907966211-4.05590796621051
43114116.120263809036-2.12026380903602
44117.8115.1793844455832.62061555441737
45117118.432343550493-1.43234355049306
46120.9117.7866451815363.11335481846447
47115117.573466235762-2.57346623576174
48117.3118.374257662870-1.07425766286981
49119.4119.823939642051-0.423939642050653
50114.9115.380595067197-0.480595067196628
51125.8125.813070522208-0.0130705222077194
52117.6116.2502975335981.34970246640168
53117.6117.102289338710.497710661289967
54114.9119.63720652417-4.73720652416987
55121.9119.3461175634632.55388243653651
56117116.8604631626790.139536837321364
57106.4117.387348672298-10.9873486722982
58110.5120.467284216905-9.96728421690485
59113.6117.755204475448-4.1552044754478
60114.2117.465566464440-3.26556646443952


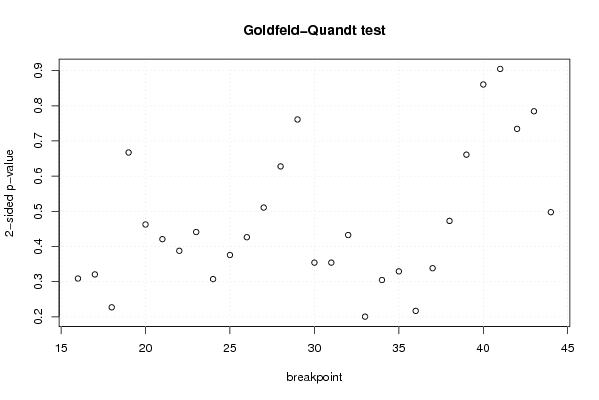
Goldfeld-Quandt test for Heteroskedasticity
p-valuesAlternative Hypothesis
breakpoint indexgreater2-sidedless
160.1544878781173450.308975756234690.845512121882655
170.1603379503409420.3206759006818830.839662049659058
180.1135572246999520.2271144493999040.886442775300048
190.3336434360250010.6672868720500010.666356563975
200.2313054076969330.4626108153938660.768694592303067
210.7895518660671930.4208962678656140.210448133932807
220.8060947752272410.3878104495455170.193905224772759
230.7794020463225150.441195907354970.220597953677485
240.8463348474925960.3073303050148080.153665152507404
250.8120650110540540.3758699778918920.187934988945946
260.7867734359920380.4264531280159250.213226564007963
270.744628104224640.510743791550720.25537189577536
280.6861134622409250.627773075518150.313886537759075
290.6194258216498490.7611483567003020.380574178350151
300.822922347274260.3541553054514810.177077652725740
310.8228815507734450.3542368984531100.177118449226555
320.7836817293482160.4326365413035690.216318270651784
330.8997094480430130.2005811039139750.100290551956987
340.8476192870190.3047614259619980.152380712980999
350.8353334699497160.3293330601005680.164666530050284
360.8914747721538520.2170504556922970.108525227846148
370.8308378994752730.3383242010494530.169162100524727
380.7635883570145290.4728232859709420.236411642985471
390.6694388008834020.6611223982331960.330561199116598
400.5696317143277340.8607365713445310.430368285672266
410.4524142360401790.9048284720803580.547585763959821
420.3672292409075050.734458481815010.632770759092495
430.3922696386173720.7845392772347440.607730361382628
440.2487960861460820.4975921722921630.751203913853918

\begin{tabular}{lllllllll}
\hline
Goldfeld-Quandt test for Heteroskedasticity \tabularnewline
p-values & Alternative Hypothesis \tabularnewline
breakpoint index & greater & 2-sided & less \tabularnewline
16 & 0.154487878117345 & 0.30897575623469 & 0.845512121882655 \tabularnewline
17 & 0.160337950340942 & 0.320675900681883 & 0.839662049659058 \tabularnewline
18 & 0.113557224699952 & 0.227114449399904 & 0.886442775300048 \tabularnewline
19 & 0.333643436025001 & 0.667286872050001 & 0.666356563975 \tabularnewline
20 & 0.231305407696933 & 0.462610815393866 & 0.768694592303067 \tabularnewline
21 & 0.789551866067193 & 0.420896267865614 & 0.210448133932807 \tabularnewline
22 & 0.806094775227241 & 0.387810449545517 & 0.193905224772759 \tabularnewline
23 & 0.779402046322515 & 0.44119590735497 & 0.220597953677485 \tabularnewline
24 & 0.846334847492596 & 0.307330305014808 & 0.153665152507404 \tabularnewline
25 & 0.812065011054054 & 0.375869977891892 & 0.187934988945946 \tabularnewline
26 & 0.786773435992038 & 0.426453128015925 & 0.213226564007963 \tabularnewline
27 & 0.74462810422464 & 0.51074379155072 & 0.25537189577536 \tabularnewline
28 & 0.686113462240925 & 0.62777307551815 & 0.313886537759075 \tabularnewline
29 & 0.619425821649849 & 0.761148356700302 & 0.380574178350151 \tabularnewline
30 & 0.82292234727426 & 0.354155305451481 & 0.177077652725740 \tabularnewline
31 & 0.822881550773445 & 0.354236898453110 & 0.177118449226555 \tabularnewline
32 & 0.783681729348216 & 0.432636541303569 & 0.216318270651784 \tabularnewline
33 & 0.899709448043013 & 0.200581103913975 & 0.100290551956987 \tabularnewline
34 & 0.847619287019 & 0.304761425961998 & 0.152380712980999 \tabularnewline
35 & 0.835333469949716 & 0.329333060100568 & 0.164666530050284 \tabularnewline
36 & 0.891474772153852 & 0.217050455692297 & 0.108525227846148 \tabularnewline
37 & 0.830837899475273 & 0.338324201049453 & 0.169162100524727 \tabularnewline
38 & 0.763588357014529 & 0.472823285970942 & 0.236411642985471 \tabularnewline
39 & 0.669438800883402 & 0.661122398233196 & 0.330561199116598 \tabularnewline
40 & 0.569631714327734 & 0.860736571344531 & 0.430368285672266 \tabularnewline
41 & 0.452414236040179 & 0.904828472080358 & 0.547585763959821 \tabularnewline
42 & 0.367229240907505 & 0.73445848181501 & 0.632770759092495 \tabularnewline
43 & 0.392269638617372 & 0.784539277234744 & 0.607730361382628 \tabularnewline
44 & 0.248796086146082 & 0.497592172292163 & 0.751203913853918 \tabularnewline
\hline
\end{tabular}
%Source: https://freestatistics.org/blog/index.php?pk=59001&T=5

[TABLE]
[ROW][C]Goldfeld-Quandt test for Heteroskedasticity[/C][/ROW]
[ROW][C]p-values[/C][C]Alternative Hypothesis[/C][/ROW]
[ROW][C]breakpoint index[/C][C]greater[/C][C]2-sided[/C][C]less[/C][/ROW]
[ROW][C]16[/C][C]0.154487878117345[/C][C]0.30897575623469[/C][C]0.845512121882655[/C][/ROW]
[ROW][C]17[/C][C]0.160337950340942[/C][C]0.320675900681883[/C][C]0.839662049659058[/C][/ROW]
[ROW][C]18[/C][C]0.113557224699952[/C][C]0.227114449399904[/C][C]0.886442775300048[/C][/ROW]
[ROW][C]19[/C][C]0.333643436025001[/C][C]0.667286872050001[/C][C]0.666356563975[/C][/ROW]
[ROW][C]20[/C][C]0.231305407696933[/C][C]0.462610815393866[/C][C]0.768694592303067[/C][/ROW]
[ROW][C]21[/C][C]0.789551866067193[/C][C]0.420896267865614[/C][C]0.210448133932807[/C][/ROW]
[ROW][C]22[/C][C]0.806094775227241[/C][C]0.387810449545517[/C][C]0.193905224772759[/C][/ROW]
[ROW][C]23[/C][C]0.779402046322515[/C][C]0.44119590735497[/C][C]0.220597953677485[/C][/ROW]
[ROW][C]24[/C][C]0.846334847492596[/C][C]0.307330305014808[/C][C]0.153665152507404[/C][/ROW]
[ROW][C]25[/C][C]0.812065011054054[/C][C]0.375869977891892[/C][C]0.187934988945946[/C][/ROW]
[ROW][C]26[/C][C]0.786773435992038[/C][C]0.426453128015925[/C][C]0.213226564007963[/C][/ROW]
[ROW][C]27[/C][C]0.74462810422464[/C][C]0.51074379155072[/C][C]0.25537189577536[/C][/ROW]
[ROW][C]28[/C][C]0.686113462240925[/C][C]0.62777307551815[/C][C]0.313886537759075[/C][/ROW]
[ROW][C]29[/C][C]0.619425821649849[/C][C]0.761148356700302[/C][C]0.380574178350151[/C][/ROW]
[ROW][C]30[/C][C]0.82292234727426[/C][C]0.354155305451481[/C][C]0.177077652725740[/C][/ROW]
[ROW][C]31[/C][C]0.822881550773445[/C][C]0.354236898453110[/C][C]0.177118449226555[/C][/ROW]
[ROW][C]32[/C][C]0.783681729348216[/C][C]0.432636541303569[/C][C]0.216318270651784[/C][/ROW]
[ROW][C]33[/C][C]0.899709448043013[/C][C]0.200581103913975[/C][C]0.100290551956987[/C][/ROW]
[ROW][C]34[/C][C]0.847619287019[/C][C]0.304761425961998[/C][C]0.152380712980999[/C][/ROW]
[ROW][C]35[/C][C]0.835333469949716[/C][C]0.329333060100568[/C][C]0.164666530050284[/C][/ROW]
[ROW][C]36[/C][C]0.891474772153852[/C][C]0.217050455692297[/C][C]0.108525227846148[/C][/ROW]
[ROW][C]37[/C][C]0.830837899475273[/C][C]0.338324201049453[/C][C]0.169162100524727[/C][/ROW]
[ROW][C]38[/C][C]0.763588357014529[/C][C]0.472823285970942[/C][C]0.236411642985471[/C][/ROW]
[ROW][C]39[/C][C]0.669438800883402[/C][C]0.661122398233196[/C][C]0.330561199116598[/C][/ROW]
[ROW][C]40[/C][C]0.569631714327734[/C][C]0.860736571344531[/C][C]0.430368285672266[/C][/ROW]
[ROW][C]41[/C][C]0.452414236040179[/C][C]0.904828472080358[/C][C]0.547585763959821[/C][/ROW]
[ROW][C]42[/C][C]0.367229240907505[/C][C]0.73445848181501[/C][C]0.632770759092495[/C][/ROW]
[ROW][C]43[/C][C]0.392269638617372[/C][C]0.784539277234744[/C][C]0.607730361382628[/C][/ROW]
[ROW][C]44[/C][C]0.248796086146082[/C][C]0.497592172292163[/C][C]0.751203913853918[/C][/ROW]
[/TABLE]
Source: https://freestatistics.org/blog/index.php?pk=59001&T=5

Globally Unique Identifier (entire table): ba.freestatistics.org/blog/index.php?pk=59001&T=5

As an alternative you can also use a QR Code:  

The GUIDs for individual cells are displayed in the table below:

Goldfeld-Quandt test for Heteroskedasticity
p-valuesAlternative Hypothesis
breakpoint indexgreater2-sidedless
160.1544878781173450.308975756234690.845512121882655
170.1603379503409420.3206759006818830.839662049659058
180.1135572246999520.2271144493999040.886442775300048
190.3336434360250010.6672868720500010.666356563975
200.2313054076969330.4626108153938660.768694592303067
210.7895518660671930.4208962678656140.210448133932807
220.8060947752272410.3878104495455170.193905224772759
230.7794020463225150.441195907354970.220597953677485
240.8463348474925960.3073303050148080.153665152507404
250.8120650110540540.3758699778918920.187934988945946
260.7867734359920380.4264531280159250.213226564007963
270.744628104224640.510743791550720.25537189577536
280.6861134622409250.627773075518150.313886537759075
290.6194258216498490.7611483567003020.380574178350151
300.822922347274260.3541553054514810.177077652725740
310.8228815507734450.3542368984531100.177118449226555
320.7836817293482160.4326365413035690.216318270651784
330.8997094480430130.2005811039139750.100290551956987
340.8476192870190.3047614259619980.152380712980999
350.8353334699497160.3293330601005680.164666530050284
360.8914747721538520.2170504556922970.108525227846148
370.8308378994752730.3383242010494530.169162100524727
380.7635883570145290.4728232859709420.236411642985471
390.6694388008834020.6611223982331960.330561199116598
400.5696317143277340.8607365713445310.430368285672266
410.4524142360401790.9048284720803580.547585763959821
420.3672292409075050.734458481815010.632770759092495
430.3922696386173720.7845392772347440.607730361382628
440.2487960861460820.4975921722921630.751203913853918


Meta Analysis of Goldfeld-Quandt test for Heteroskedasticity
Description# significant tests% significant testsOK/NOK
1% type I error level00OK
5% type I error level00OK
10% type I error level00OK

\begin{tabular}{lllllllll}
\hline
Meta Analysis of Goldfeld-Quandt test for Heteroskedasticity \tabularnewline
Description & # significant tests & % significant tests & OK/NOK \tabularnewline
1% type I error level & 0 & 0 & OK \tabularnewline
5% type I error level & 0 & 0 & OK \tabularnewline
10% type I error level & 0 & 0 & OK \tabularnewline
\hline
\end{tabular}
%Source: https://freestatistics.org/blog/index.php?pk=59001&T=6

[TABLE]
[ROW][C]Meta Analysis of Goldfeld-Quandt test for Heteroskedasticity[/C][/ROW]
[ROW][C]Description[/C][C]# significant tests[/C][C]% significant tests[/C][C]OK/NOK[/C][/ROW]
[ROW][C]1% type I error level[/C][C]0[/C][C]0[/C][C]OK[/C][/ROW]
[ROW][C]5% type I error level[/C][C]0[/C][C]0[/C][C]OK[/C][/ROW]
[ROW][C]10% type I error level[/C][C]0[/C][C]0[/C][C]OK[/C][/ROW]
[/TABLE]
Source: https://freestatistics.org/blog/index.php?pk=59001&T=6

Globally Unique Identifier (entire table): ba.freestatistics.org/blog/index.php?pk=59001&T=6

As an alternative you can also use a QR Code:  

The GUIDs for individual cells are displayed in the table below:

Meta Analysis of Goldfeld-Quandt test for Heteroskedasticity
Description# significant tests% significant testsOK/NOK
1% type I error level00OK
5% type I error level00OK
10% type I error level00OK


Parameters (Session):
par1 = 2 ; par2 = Include Monthly Dummies ; par3 = No Linear Trend ;
Parameters (R input):
par1 = 2 ; par2 = Include Monthly Dummies ; par3 = No Linear Trend ;
R code (references can be found in the software module):
library(lattice)
library(lmtest)
n25 <- 25 #minimum number of obs. for Goldfeld-Quandt test
par1 <- as.numeric(par1)
x <- t(y)
k <- length(x[1,])
n <- length(x[,1])
x1 <- cbind(x[,par1], x[,1:k!=par1])
mycolnames <- c(colnames(x)[par1], colnames(x)[1:k!=par1])
colnames(x1) <- mycolnames #colnames(x)[par1]
x <- x1
if (par3 == 'First Differences'){
x2 <- array(0, dim=c(n-1,k), dimnames=list(1:(n-1), paste('(1-B)',colnames(x),sep='')))
for (i in 1:n-1) {
for (j in 1:k) {
x2[i,j] <- x[i+1,j] - x[i,j]
}
}
x <- x2
}
if (par2 == 'Include Monthly Dummies'){
x2 <- array(0, dim=c(n,11), dimnames=list(1:n, paste('M', seq(1:11), sep ='')))
for (i in 1:11){
x2[seq(i,n,12),i] <- 1
}
x <- cbind(x, x2)
}
if (par2 == 'Include Quarterly Dummies'){
x2 <- array(0, dim=c(n,3), dimnames=list(1:n, paste('Q', seq(1:3), sep ='')))
for (i in 1:3){
x2[seq(i,n,4),i] <- 1
}
x <- cbind(x, x2)
}
k <- length(x[1,])
if (par3 == 'Linear Trend'){
x <- cbind(x, c(1:n))
colnames(x)[k+1] <- 't'
}
x
k <- length(x[1,])
df <- as.data.frame(x)
(mylm <- lm(df))
(mysum <- summary(mylm))
if (n > n25) {
kp3 <- k + 3
nmkm3 <- n - k - 3
gqarr <- array(NA, dim=c(nmkm3-kp3+1,3))
numgqtests <- 0
numsignificant1 <- 0
numsignificant5 <- 0
numsignificant10 <- 0
for (mypoint in kp3:nmkm3) {
j <- 0
numgqtests <- numgqtests + 1
for (myalt in c('greater', 'two.sided', 'less')) {
j <- j + 1
gqarr[mypoint-kp3+1,j] <- gqtest(mylm, point=mypoint, alternative=myalt)$p.value
}
if (gqarr[mypoint-kp3+1,2] < 0.01) numsignificant1 <- numsignificant1 + 1
if (gqarr[mypoint-kp3+1,2] < 0.05) numsignificant5 <- numsignificant5 + 1
if (gqarr[mypoint-kp3+1,2] < 0.10) numsignificant10 <- numsignificant10 + 1
}
gqarr
}
bitmap(file='test0.png')
plot(x[,1], type='l', main='Actuals and Interpolation', ylab='value of Actuals and Interpolation (dots)', xlab='time or index')
points(x[,1]-mysum$resid)
grid()
dev.off()
bitmap(file='test1.png')
plot(mysum$resid, type='b', pch=19, main='Residuals', ylab='value of Residuals', xlab='time or index')
grid()
dev.off()
bitmap(file='test2.png')
hist(mysum$resid, main='Residual Histogram', xlab='values of Residuals')
grid()
dev.off()
bitmap(file='test3.png')
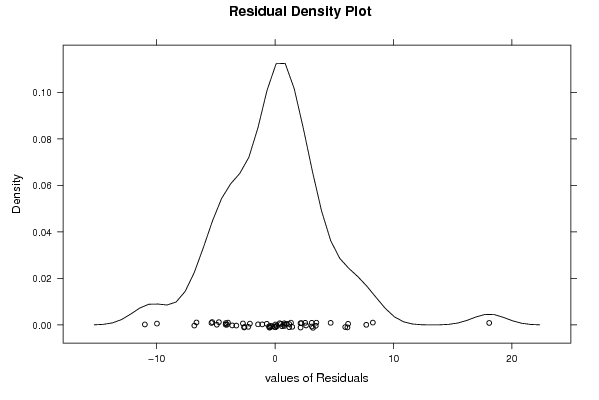
densityplot(~mysum$resid,col='black',main='Residual Density Plot', xlab='values of Residuals')
dev.off()
bitmap(file='test4.png')
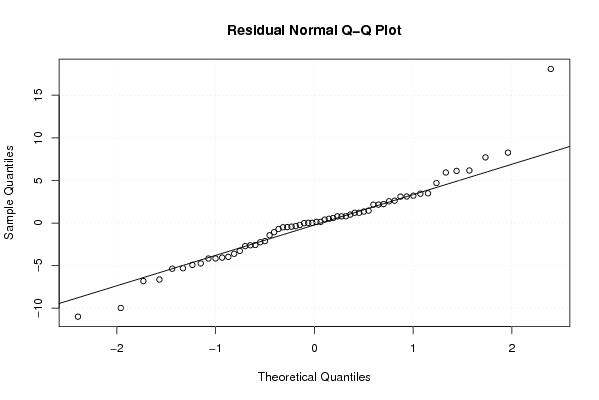
qqnorm(mysum$resid, main='Residual Normal Q-Q Plot')
qqline(mysum$resid)
grid()
dev.off()
(myerror <- as.ts(mysum$resid))
bitmap(file='test5.png')
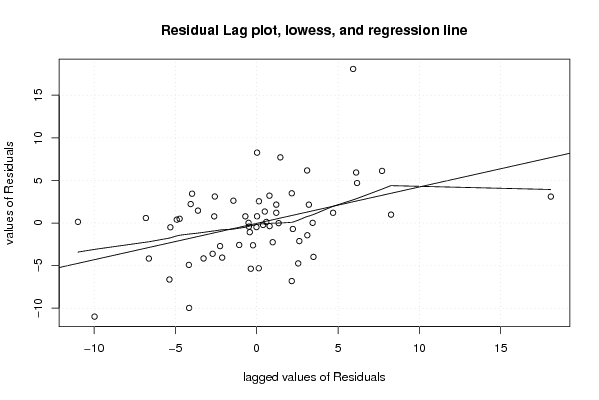
dum <- cbind(lag(myerror,k=1),myerror)
dum
dum1 <- dum[2:length(myerror),]
dum1
z <- as.data.frame(dum1)
z
plot(z,main=paste('Residual Lag plot, lowess, and regression line'), ylab='values of Residuals', xlab='lagged values of Residuals')
lines(lowess(z))
abline(lm(z))
grid()
dev.off()
bitmap(file='test6.png')
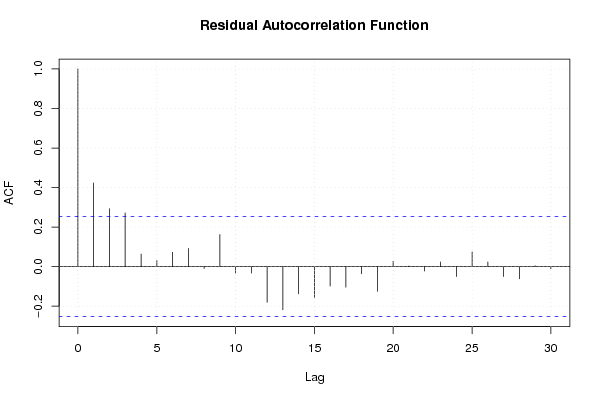
acf(mysum$resid, lag.max=length(mysum$resid)/2, main='Residual Autocorrelation Function')
grid()
dev.off()
bitmap(file='test7.png')
pacf(mysum$resid, lag.max=length(mysum$resid)/2, main='Residual Partial Autocorrelation Function')
grid()
dev.off()
bitmap(file='test8.png')
opar <- par(mfrow = c(2,2), oma = c(0, 0, 1.1, 0))
plot(mylm, las = 1, sub='Residual Diagnostics')
par(opar)
dev.off()
if (n > n25) {
bitmap(file='test9.png')
plot(kp3:nmkm3,gqarr[,2], main='Goldfeld-Quandt test',ylab='2-sided p-value',xlab='breakpoint')
grid()
dev.off()
}
load(file='createtable')
a<-table.start()
a<-table.row.start(a)
a<-table.element(a, 'Multiple Linear Regression - Estimated Regression Equation', 1, TRUE)
a<-table.row.end(a)
myeq <- colnames(x)[1]
myeq <- paste(myeq, '[t] = ', sep='')
for (i in 1:k){
if (mysum$coefficients[i,1] > 0) myeq <- paste(myeq, '+', '')
myeq <- paste(myeq, mysum$coefficients[i,1], sep=' ')
if (rownames(mysum$coefficients)[i] != '(Intercept)') {
myeq <- paste(myeq, rownames(mysum$coefficients)[i], sep='')
if (rownames(mysum$coefficients)[i] != 't') myeq <- paste(myeq, '[t]', sep='')
}
}
myeq <- paste(myeq, ' + e[t]')
a<-table.row.start(a)
a<-table.element(a, myeq)
a<-table.row.end(a)
a<-table.end(a)
table.save(a,file='mytable1.tab')
a<-table.start()
a<-table.row.start(a)
a<-table.element(a,hyperlink('ols1.htm','Multiple Linear Regression - Ordinary Least Squares',''), 6, TRUE)
a<-table.row.end(a)
a<-table.row.start(a)
a<-table.element(a,'Variable',header=TRUE)
a<-table.element(a,'Parameter',header=TRUE)
a<-table.element(a,'S.D.',header=TRUE)
a<-table.element(a,'T-STAT
H0: parameter = 0',header=TRUE)
a<-table.element(a,'2-tail p-value',header=TRUE)
a<-table.element(a,'1-tail p-value',header=TRUE)
a<-table.row.end(a)
for (i in 1:k){
a<-table.row.start(a)
a<-table.element(a,rownames(mysum$coefficients)[i],header=TRUE)
a<-table.element(a,mysum$coefficients[i,1])
a<-table.element(a, round(mysum$coefficients[i,2],6))
a<-table.element(a, round(mysum$coefficients[i,3],4))
a<-table.element(a, round(mysum$coefficients[i,4],6))
a<-table.element(a, round(mysum$coefficients[i,4]/2,6))
a<-table.row.end(a)
}
a<-table.end(a)
table.save(a,file='mytable2.tab')
a<-table.start()
a<-table.row.start(a)
a<-table.element(a, 'Multiple Linear Regression - Regression Statistics', 2, TRUE)
a<-table.row.end(a)
a<-table.row.start(a)
a<-table.element(a, 'Multiple R',1,TRUE)
a<-table.element(a, sqrt(mysum$r.squared))
a<-table.row.end(a)
a<-table.row.start(a)
a<-table.element(a, 'R-squared',1,TRUE)
a<-table.element(a, mysum$r.squared)
a<-table.row.end(a)
a<-table.row.start(a)
a<-table.element(a, 'Adjusted R-squared',1,TRUE)
a<-table.element(a, mysum$adj.r.squared)
a<-table.row.end(a)
a<-table.row.start(a)
a<-table.element(a, 'F-TEST (value)',1,TRUE)
a<-table.element(a, mysum$fstatistic[1])
a<-table.row.end(a)
a<-table.row.start(a)
a<-table.element(a, 'F-TEST (DF numerator)',1,TRUE)
a<-table.element(a, mysum$fstatistic[2])
a<-table.row.end(a)
a<-table.row.start(a)
a<-table.element(a, 'F-TEST (DF denominator)',1,TRUE)
a<-table.element(a, mysum$fstatistic[3])
a<-table.row.end(a)
a<-table.row.start(a)
a<-table.element(a, 'p-value',1,TRUE)
a<-table.element(a, 1-pf(mysum$fstatistic[1],mysum$fstatistic[2],mysum$fstatistic[3]))
a<-table.row.end(a)
a<-table.row.start(a)
a<-table.element(a, 'Multiple Linear Regression - Residual Statistics', 2, TRUE)
a<-table.row.end(a)
a<-table.row.start(a)
a<-table.element(a, 'Residual Standard Deviation',1,TRUE)
a<-table.element(a, mysum$sigma)
a<-table.row.end(a)
a<-table.row.start(a)
a<-table.element(a, 'Sum Squared Residuals',1,TRUE)
a<-table.element(a, sum(myerror*myerror))
a<-table.row.end(a)
a<-table.end(a)
table.save(a,file='mytable3.tab')
a<-table.start()
a<-table.row.start(a)
a<-table.element(a, 'Multiple Linear Regression - Actuals, Interpolation, and Residuals', 4, TRUE)
a<-table.row.end(a)
a<-table.row.start(a)
a<-table.element(a, 'Time or Index', 1, TRUE)
a<-table.element(a, 'Actuals', 1, TRUE)
a<-table.element(a, 'Interpolation
Forecast', 1, TRUE)
a<-table.element(a, 'Residuals
Prediction Error', 1, TRUE)
a<-table.row.end(a)
for (i in 1:n) {
a<-table.row.start(a)
a<-table.element(a,i, 1, TRUE)
a<-table.element(a,x[i])
a<-table.element(a,x[i]-mysum$resid[i])
a<-table.element(a,mysum$resid[i])
a<-table.row.end(a)
}
a<-table.end(a)
table.save(a,file='mytable4.tab')
if (n > n25) {
a<-table.start()
a<-table.row.start(a)
a<-table.element(a,'Goldfeld-Quandt test for Heteroskedasticity',4,TRUE)
a<-table.row.end(a)
a<-table.row.start(a)
a<-table.element(a,'p-values',header=TRUE)
a<-table.element(a,'Alternative Hypothesis',3,header=TRUE)
a<-table.row.end(a)
a<-table.row.start(a)
a<-table.element(a,'breakpoint index',header=TRUE)
a<-table.element(a,'greater',header=TRUE)
a<-table.element(a,'2-sided',header=TRUE)
a<-table.element(a,'less',header=TRUE)
a<-table.row.end(a)
for (mypoint in kp3:nmkm3) {
a<-table.row.start(a)
a<-table.element(a,mypoint,header=TRUE)
a<-table.element(a,gqarr[mypoint-kp3+1,1])
a<-table.element(a,gqarr[mypoint-kp3+1,2])
a<-table.element(a,gqarr[mypoint-kp3+1,3])
a<-table.row.end(a)
}
a<-table.end(a)
table.save(a,file='mytable5.tab')
a<-table.start()
a<-table.row.start(a)
a<-table.element(a,'Meta Analysis of Goldfeld-Quandt test for Heteroskedasticity',4,TRUE)
a<-table.row.end(a)
a<-table.row.start(a)
a<-table.element(a,'Description',header=TRUE)
a<-table.element(a,'# significant tests',header=TRUE)
a<-table.element(a,'% significant tests',header=TRUE)
a<-table.element(a,'OK/NOK',header=TRUE)
a<-table.row.end(a)
a<-table.row.start(a)
a<-table.element(a,'1% type I error level',header=TRUE)
a<-table.element(a,numsignificant1)
a<-table.element(a,numsignificant1/numgqtests)
if (numsignificant1/numgqtests < 0.01) dum <- 'OK' else dum <- 'NOK'
a<-table.element(a,dum)
a<-table.row.end(a)
a<-table.row.start(a)
a<-table.element(a,'5% type I error level',header=TRUE)
a<-table.element(a,numsignificant5)
a<-table.element(a,numsignificant5/numgqtests)
if (numsignificant5/numgqtests < 0.05) dum <- 'OK' else dum <- 'NOK'
a<-table.element(a,dum)
a<-table.row.end(a)
a<-table.row.start(a)
a<-table.element(a,'10% type I error level',header=TRUE)
a<-table.element(a,numsignificant10)
a<-table.element(a,numsignificant10/numgqtests)
if (numsignificant10/numgqtests < 0.1) dum <- 'OK' else dum <- 'NOK'
a<-table.element(a,dum)
a<-table.row.end(a)
a<-table.end(a)
table.save(a,file='mytable6.tab')
}