Free Statistics

of Irreproducible Research!

Author's title

Author*The author of this computation has been verified*
R Software Modulerwasp_multipleregression.wasp
Title produced by softwareMultiple Regression
Date of computationSat, 03 Nov 2012 06:21:15 -0400
Cite this page as followsStatistical Computations at FreeStatistics.org, Office for Research Development and Education, URL https://freestatistics.org/blog/index.php?v=date/2012/Nov/03/t1351938137lbqewde5u76rp6o.htm/, Retrieved Fri, 19 Apr 2024 03:30:28 +0000
Statistical Computations at FreeStatistics.org, Office for Research Development and Education, URL https://freestatistics.org/blog/index.php?pk=185705, Retrieved Fri, 19 Apr 2024 03:30:28 +0000
QR Codes:

Original text written by user:
IsPrivate?No (this computation is public)
User-defined keywords
Estimated Impact133
Family? (F = Feedback message, R = changed R code, M = changed R Module, P = changed Parameters, D = changed Data)
-       [Multiple Regression] [Multiple regressi...] [2012-11-03 10:21:15] [a641906195a0eb35087b0121beaccdc9] [Current]
Feedback Forum

Post a new message
Dataseries X:
2000	45.123	27.002	5.144	220
2001	42.110	29.314	21.427	1.585
2002	40.434	30.628	8.958	3.922
2003	41.777	31.355	11.263	4.196
2004	43.296	31.405	18.729	4.763
2005	43.141	30.840	30.961	6.388
2006	44.813	29.189	34.605	9.449
2007	45.561	30.081	49.515	12.040
2008	45.613	35.366	64.021	16.370
2009	43.303	32.606	67.561	20.308
2010	42.159	28.903	72.191	25.660


Summary of computational transaction
Raw Inputview raw input (R code)
Raw Outputview raw output of R engine
Computing time6 seconds
R Server'Gertrude Mary Cox' @ cox.wessa.net

\begin{tabular}{lllllllll}
\hline
Summary of computational transaction \tabularnewline
Raw Input & view raw input (R code)  \tabularnewline
Raw Output & view raw output of R engine  \tabularnewline
Computing time & 6 seconds \tabularnewline
R Server & 'Gertrude Mary Cox' @ cox.wessa.net \tabularnewline
\hline
\end{tabular}
%Source: https://freestatistics.org/blog/index.php?pk=185705&T=0

[TABLE]
[ROW][C]Summary of computational transaction[/C][/ROW]
[ROW][C]Raw Input[/C][C]view raw input (R code) [/C][/ROW]
[ROW][C]Raw Output[/C][C]view raw output of R engine [/C][/ROW]
[ROW][C]Computing time[/C][C]6 seconds[/C][/ROW]
[ROW][C]R Server[/C][C]'Gertrude Mary Cox' @ cox.wessa.net[/C][/ROW]
[/TABLE]
Source: https://freestatistics.org/blog/index.php?pk=185705&T=0

Globally Unique Identifier (entire table): ba.freestatistics.org/blog/index.php?pk=185705&T=0

As an alternative you can also use a QR Code:  

The GUIDs for individual cells are displayed in the table below:

Summary of computational transaction
Raw Inputview raw input (R code)
Raw Outputview raw output of R engine
Computing time6 seconds
R Server'Gertrude Mary Cox' @ cox.wessa.net


Multiple Linear Regression - Estimated Regression Equation
Jaar[t] = + 1998.6091295581 + 0.0769468887630163Huwelijk[t] -0.0301797258171767Echtscheiding[t] + 0.120756614770616Verklaring_samenwonend[t] -0.00826696249292465Stopzetting_samenwonend[t] + e[t]

\begin{tabular}{lllllllll}
\hline
Multiple Linear Regression - Estimated Regression Equation \tabularnewline
Jaar[t] =  +  1998.6091295581 +  0.0769468887630163Huwelijk[t] -0.0301797258171767Echtscheiding[t] +  0.120756614770616Verklaring_samenwonend[t] -0.00826696249292465Stopzetting_samenwonend[t]  + e[t] \tabularnewline
\hline
\end{tabular}
%Source: https://freestatistics.org/blog/index.php?pk=185705&T=1

[TABLE]
[ROW][C]Multiple Linear Regression - Estimated Regression Equation[/C][/ROW]
[ROW][C]Jaar[t] =  +  1998.6091295581 +  0.0769468887630163Huwelijk[t] -0.0301797258171767Echtscheiding[t] +  0.120756614770616Verklaring_samenwonend[t] -0.00826696249292465Stopzetting_samenwonend[t]  + e[t][/C][/ROW]
[/TABLE]
Source: https://freestatistics.org/blog/index.php?pk=185705&T=1

Globally Unique Identifier (entire table): ba.freestatistics.org/blog/index.php?pk=185705&T=1

As an alternative you can also use a QR Code:  

The GUIDs for individual cells are displayed in the table below:

Multiple Linear Regression - Estimated Regression Equation
Jaar[t] = + 1998.6091295581 + 0.0769468887630163Huwelijk[t] -0.0301797258171767Echtscheiding[t] + 0.120756614770616Verklaring_samenwonend[t] -0.00826696249292465Stopzetting_samenwonend[t] + e[t]


Multiple Linear Regression - Ordinary Least Squares
VariableParameterS.D.T-STATH0: parameter = 02-tail p-value1-tail p-value
(Intercept)1998.609129558112.246536163.197900
Huwelijk0.07694688876301630.2851080.26990.796290.398145
Echtscheiding-0.03017972581717670.227935-0.13240.8989930.449496
Verklaring_samenwonend0.1207566147706160.0189686.36640.0007050.000353
Stopzetting_samenwonend-0.008266962492924650.008604-0.96080.3737430.186871

\begin{tabular}{lllllllll}
\hline
Multiple Linear Regression - Ordinary Least Squares \tabularnewline
Variable & Parameter & S.D. & T-STATH0: parameter = 0 & 2-tail p-value & 1-tail p-value \tabularnewline
(Intercept) & 1998.6091295581 & 12.246536 & 163.1979 & 0 & 0 \tabularnewline
Huwelijk & 0.0769468887630163 & 0.285108 & 0.2699 & 0.79629 & 0.398145 \tabularnewline
Echtscheiding & -0.0301797258171767 & 0.227935 & -0.1324 & 0.898993 & 0.449496 \tabularnewline
Verklaring_samenwonend & 0.120756614770616 & 0.018968 & 6.3664 & 0.000705 & 0.000353 \tabularnewline
Stopzetting_samenwonend & -0.00826696249292465 & 0.008604 & -0.9608 & 0.373743 & 0.186871 \tabularnewline
\hline
\end{tabular}
%Source: https://freestatistics.org/blog/index.php?pk=185705&T=2

[TABLE]
[ROW][C]Multiple Linear Regression - Ordinary Least Squares[/C][/ROW]
[ROW][C]Variable[/C][C]Parameter[/C][C]S.D.[/C][C]T-STATH0: parameter = 0[/C][C]2-tail p-value[/C][C]1-tail p-value[/C][/ROW]
[ROW][C](Intercept)[/C][C]1998.6091295581[/C][C]12.246536[/C][C]163.1979[/C][C]0[/C][C]0[/C][/ROW]
[ROW][C]Huwelijk[/C][C]0.0769468887630163[/C][C]0.285108[/C][C]0.2699[/C][C]0.79629[/C][C]0.398145[/C][/ROW]
[ROW][C]Echtscheiding[/C][C]-0.0301797258171767[/C][C]0.227935[/C][C]-0.1324[/C][C]0.898993[/C][C]0.449496[/C][/ROW]
[ROW][C]Verklaring_samenwonend[/C][C]0.120756614770616[/C][C]0.018968[/C][C]6.3664[/C][C]0.000705[/C][C]0.000353[/C][/ROW]
[ROW][C]Stopzetting_samenwonend[/C][C]-0.00826696249292465[/C][C]0.008604[/C][C]-0.9608[/C][C]0.373743[/C][C]0.186871[/C][/ROW]
[/TABLE]
Source: https://freestatistics.org/blog/index.php?pk=185705&T=2

Globally Unique Identifier (entire table): ba.freestatistics.org/blog/index.php?pk=185705&T=2

As an alternative you can also use a QR Code:  

The GUIDs for individual cells are displayed in the table below:

Multiple Linear Regression - Ordinary Least Squares
VariableParameterS.D.T-STATH0: parameter = 02-tail p-value1-tail p-value
(Intercept)1998.609129558112.246536163.197900
Huwelijk0.07694688876301630.2851080.26990.796290.398145
Echtscheiding-0.03017972581717670.227935-0.13240.8989930.449496
Verklaring_samenwonend0.1207566147706160.0189686.36640.0007050.000353
Stopzetting_samenwonend-0.008266962492924650.008604-0.96080.3737430.186871


Multiple Linear Regression - Regression Statistics
Multiple R0.958017048189479
R-squared0.917796664621682
Adjusted R-squared0.862994441036136
F-TEST (value)16.7474347676607
F-TEST (DF numerator)4
F-TEST (DF denominator)6
p-value0.00208493255055575
Multiple Linear Regression - Residual Statistics
Residual Standard Deviation1.2276241886679
Sum Squared Residuals9.04236689161511

\begin{tabular}{lllllllll}
\hline
Multiple Linear Regression - Regression Statistics \tabularnewline
Multiple R & 0.958017048189479 \tabularnewline
R-squared & 0.917796664621682 \tabularnewline
Adjusted R-squared & 0.862994441036136 \tabularnewline
F-TEST (value) & 16.7474347676607 \tabularnewline
F-TEST (DF numerator) & 4 \tabularnewline
F-TEST (DF denominator) & 6 \tabularnewline
p-value & 0.00208493255055575 \tabularnewline
Multiple Linear Regression - Residual Statistics \tabularnewline
Residual Standard Deviation & 1.2276241886679 \tabularnewline
Sum Squared Residuals & 9.04236689161511 \tabularnewline
\hline
\end{tabular}
%Source: https://freestatistics.org/blog/index.php?pk=185705&T=3

[TABLE]
[ROW][C]Multiple Linear Regression - Regression Statistics[/C][/ROW]
[ROW][C]Multiple R[/C][C]0.958017048189479[/C][/ROW]
[ROW][C]R-squared[/C][C]0.917796664621682[/C][/ROW]
[ROW][C]Adjusted R-squared[/C][C]0.862994441036136[/C][/ROW]
[ROW][C]F-TEST (value)[/C][C]16.7474347676607[/C][/ROW]
[ROW][C]F-TEST (DF numerator)[/C][C]4[/C][/ROW]
[ROW][C]F-TEST (DF denominator)[/C][C]6[/C][/ROW]
[ROW][C]p-value[/C][C]0.00208493255055575[/C][/ROW]
[ROW][C]Multiple Linear Regression - Residual Statistics[/C][/ROW]
[ROW][C]Residual Standard Deviation[/C][C]1.2276241886679[/C][/ROW]
[ROW][C]Sum Squared Residuals[/C][C]9.04236689161511[/C][/ROW]
[/TABLE]
Source: https://freestatistics.org/blog/index.php?pk=185705&T=3

Globally Unique Identifier (entire table): ba.freestatistics.org/blog/index.php?pk=185705&T=3

As an alternative you can also use a QR Code:  

The GUIDs for individual cells are displayed in the table below:

Multiple Linear Regression - Regression Statistics
Multiple R0.958017048189479
R-squared0.917796664621682
Adjusted R-squared0.862994441036136
F-TEST (value)16.7474347676607
F-TEST (DF numerator)4
F-TEST (DF denominator)6
p-value0.00208493255055575
Multiple Linear Regression - Residual Statistics
Residual Standard Deviation1.2276241886679
Sum Squared Residuals9.04236689161511


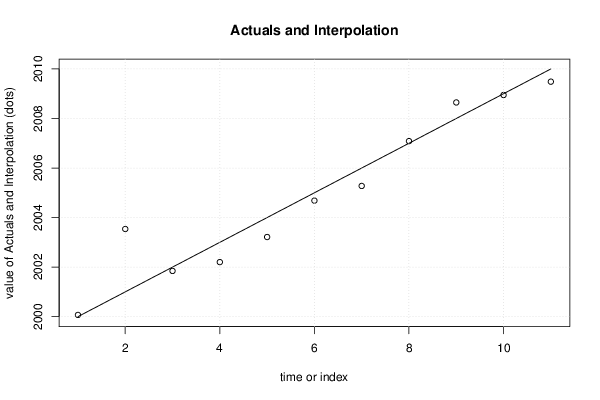
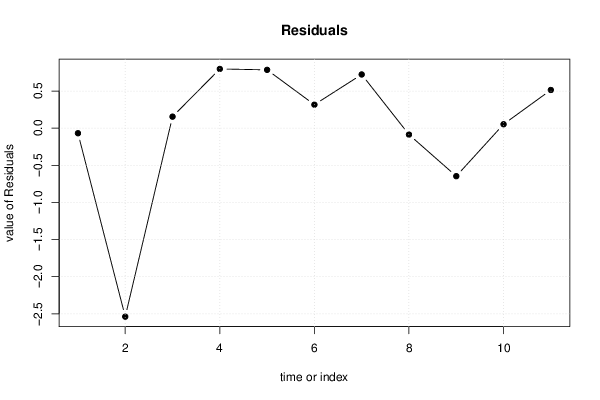
Multiple Linear Regression - Actuals, Interpolation, and Residuals
Time or IndexActualsInterpolationForecastResidualsPrediction Error
120002000.06873134118-0.0687313411766344
220012003.53902341045-2.53902341044628
320022001.845370144230.154629855765078
420032002.20284800450.797151995502225
520042003.215102860380.784897139618134
620052004.683888735530.316111264466528
720062005.27710259290.722897407097324
820072007.08679997668-0.0867999766792036
920082008.64720087022-0.647200870219291
1020092008.947672718420.0523272815770262
1120102009.486259345510.513740654495094

\begin{tabular}{lllllllll}
\hline
Multiple Linear Regression - Actuals, Interpolation, and Residuals \tabularnewline
Time or Index & Actuals & InterpolationForecast & ResidualsPrediction Error \tabularnewline
1 & 2000 & 2000.06873134118 & -0.0687313411766344 \tabularnewline
2 & 2001 & 2003.53902341045 & -2.53902341044628 \tabularnewline
3 & 2002 & 2001.84537014423 & 0.154629855765078 \tabularnewline
4 & 2003 & 2002.2028480045 & 0.797151995502225 \tabularnewline
5 & 2004 & 2003.21510286038 & 0.784897139618134 \tabularnewline
6 & 2005 & 2004.68388873553 & 0.316111264466528 \tabularnewline
7 & 2006 & 2005.2771025929 & 0.722897407097324 \tabularnewline
8 & 2007 & 2007.08679997668 & -0.0867999766792036 \tabularnewline
9 & 2008 & 2008.64720087022 & -0.647200870219291 \tabularnewline
10 & 2009 & 2008.94767271842 & 0.0523272815770262 \tabularnewline
11 & 2010 & 2009.48625934551 & 0.513740654495094 \tabularnewline
\hline
\end{tabular}
%Source: https://freestatistics.org/blog/index.php?pk=185705&T=4

[TABLE]
[ROW][C]Multiple Linear Regression - Actuals, Interpolation, and Residuals[/C][/ROW]
[ROW][C]Time or Index[/C][C]Actuals[/C][C]InterpolationForecast[/C][C]ResidualsPrediction Error[/C][/ROW]
[ROW][C]1[/C][C]2000[/C][C]2000.06873134118[/C][C]-0.0687313411766344[/C][/ROW]
[ROW][C]2[/C][C]2001[/C][C]2003.53902341045[/C][C]-2.53902341044628[/C][/ROW]
[ROW][C]3[/C][C]2002[/C][C]2001.84537014423[/C][C]0.154629855765078[/C][/ROW]
[ROW][C]4[/C][C]2003[/C][C]2002.2028480045[/C][C]0.797151995502225[/C][/ROW]
[ROW][C]5[/C][C]2004[/C][C]2003.21510286038[/C][C]0.784897139618134[/C][/ROW]
[ROW][C]6[/C][C]2005[/C][C]2004.68388873553[/C][C]0.316111264466528[/C][/ROW]
[ROW][C]7[/C][C]2006[/C][C]2005.2771025929[/C][C]0.722897407097324[/C][/ROW]
[ROW][C]8[/C][C]2007[/C][C]2007.08679997668[/C][C]-0.0867999766792036[/C][/ROW]
[ROW][C]9[/C][C]2008[/C][C]2008.64720087022[/C][C]-0.647200870219291[/C][/ROW]
[ROW][C]10[/C][C]2009[/C][C]2008.94767271842[/C][C]0.0523272815770262[/C][/ROW]
[ROW][C]11[/C][C]2010[/C][C]2009.48625934551[/C][C]0.513740654495094[/C][/ROW]
[/TABLE]
Source: https://freestatistics.org/blog/index.php?pk=185705&T=4

Globally Unique Identifier (entire table): ba.freestatistics.org/blog/index.php?pk=185705&T=4

As an alternative you can also use a QR Code:  

The GUIDs for individual cells are displayed in the table below:

Multiple Linear Regression - Actuals, Interpolation, and Residuals
Time or IndexActualsInterpolationForecastResidualsPrediction Error
120002000.06873134118-0.0687313411766344
220012003.53902341045-2.53902341044628
320022001.845370144230.154629855765078
420032002.20284800450.797151995502225
520042003.215102860380.784897139618134
620052004.683888735530.316111264466528
720062005.27710259290.722897407097324
820072007.08679997668-0.0867999766792036
920082008.64720087022-0.647200870219291
1020092008.947672718420.0523272815770262
1120102009.486259345510.513740654495094


Parameters (Session):
par1 = 1 ; par2 = Do not include Seasonal Dummies ; par3 = No Linear Trend ;
Parameters (R input):
par1 = 1 ; par2 = Do not include Seasonal Dummies ; par3 = No Linear Trend ;
R code (references can be found in the software module):
library(lattice)
library(lmtest)
n25 <- 25 #minimum number of obs. for Goldfeld-Quandt test
par1 <- as.numeric(par1)
x <- t(y)
k <- length(x[1,])
n <- length(x[,1])
x1 <- cbind(x[,par1], x[,1:k!=par1])
mycolnames <- c(colnames(x)[par1], colnames(x)[1:k!=par1])
colnames(x1) <- mycolnames #colnames(x)[par1]
x <- x1
if (par3 == 'First Differences'){
x2 <- array(0, dim=c(n-1,k), dimnames=list(1:(n-1), paste('(1-B)',colnames(x),sep='')))
for (i in 1:n-1) {
for (j in 1:k) {
x2[i,j] <- x[i+1,j] - x[i,j]
}
}
x <- x2
}
if (par2 == 'Include Monthly Dummies'){
x2 <- array(0, dim=c(n,11), dimnames=list(1:n, paste('M', seq(1:11), sep ='')))
for (i in 1:11){
x2[seq(i,n,12),i] <- 1
}
x <- cbind(x, x2)
}
if (par2 == 'Include Quarterly Dummies'){
x2 <- array(0, dim=c(n,3), dimnames=list(1:n, paste('Q', seq(1:3), sep ='')))
for (i in 1:3){
x2[seq(i,n,4),i] <- 1
}
x <- cbind(x, x2)
}
k <- length(x[1,])
if (par3 == 'Linear Trend'){
x <- cbind(x, c(1:n))
colnames(x)[k+1] <- 't'
}
x
k <- length(x[1,])
df <- as.data.frame(x)
(mylm <- lm(df))
(mysum <- summary(mylm))
if (n > n25) {
kp3 <- k + 3
nmkm3 <- n - k - 3
gqarr <- array(NA, dim=c(nmkm3-kp3+1,3))
numgqtests <- 0
numsignificant1 <- 0
numsignificant5 <- 0
numsignificant10 <- 0
for (mypoint in kp3:nmkm3) {
j <- 0
numgqtests <- numgqtests + 1
for (myalt in c('greater', 'two.sided', 'less')) {
j <- j + 1
gqarr[mypoint-kp3+1,j] <- gqtest(mylm, point=mypoint, alternative=myalt)$p.value
}
if (gqarr[mypoint-kp3+1,2] < 0.01) numsignificant1 <- numsignificant1 + 1
if (gqarr[mypoint-kp3+1,2] < 0.05) numsignificant5 <- numsignificant5 + 1
if (gqarr[mypoint-kp3+1,2] < 0.10) numsignificant10 <- numsignificant10 + 1
}
gqarr
}
bitmap(file='test0.png')
plot(x[,1], type='l', main='Actuals and Interpolation', ylab='value of Actuals and Interpolation (dots)', xlab='time or index')
points(x[,1]-mysum$resid)
grid()
dev.off()
bitmap(file='test1.png')
plot(mysum$resid, type='b', pch=19, main='Residuals', ylab='value of Residuals', xlab='time or index')
grid()
dev.off()
bitmap(file='test2.png')
hist(mysum$resid, main='Residual Histogram', xlab='values of Residuals')
grid()
dev.off()
bitmap(file='test3.png')
densityplot(~mysum$resid,col='black',main='Residual Density Plot', xlab='values of Residuals')
dev.off()
bitmap(file='test4.png')
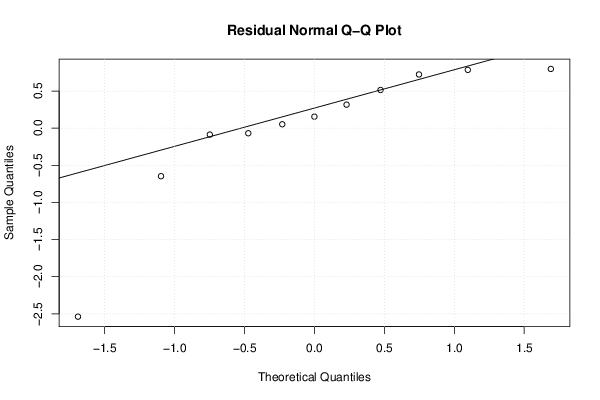
qqnorm(mysum$resid, main='Residual Normal Q-Q Plot')
qqline(mysum$resid)
grid()
dev.off()
(myerror <- as.ts(mysum$resid))
bitmap(file='test5.png')
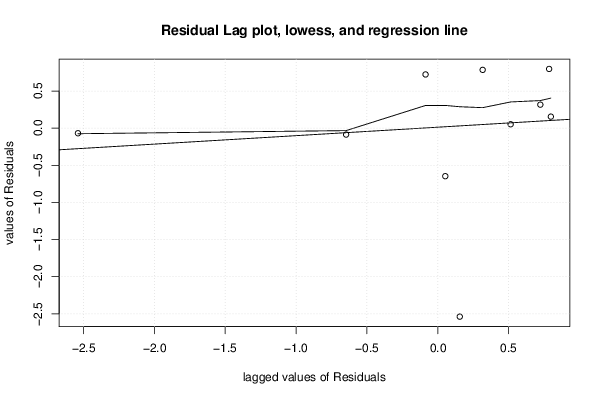
dum <- cbind(lag(myerror,k=1),myerror)
dum
dum1 <- dum[2:length(myerror),]
dum1
z <- as.data.frame(dum1)
z
plot(z,main=paste('Residual Lag plot, lowess, and regression line'), ylab='values of Residuals', xlab='lagged values of Residuals')
lines(lowess(z))
abline(lm(z))
grid()
dev.off()
bitmap(file='test6.png')
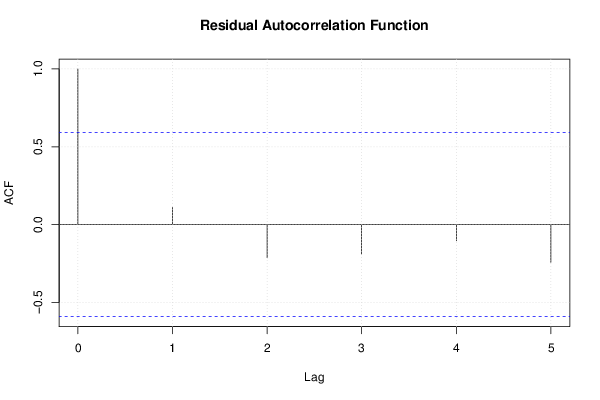
acf(mysum$resid, lag.max=length(mysum$resid)/2, main='Residual Autocorrelation Function')
grid()
dev.off()
bitmap(file='test7.png')
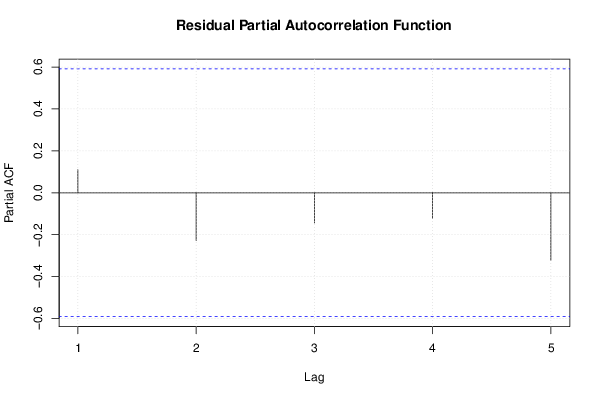
pacf(mysum$resid, lag.max=length(mysum$resid)/2, main='Residual Partial Autocorrelation Function')
grid()
dev.off()
bitmap(file='test8.png')
opar <- par(mfrow = c(2,2), oma = c(0, 0, 1.1, 0))
plot(mylm, las = 1, sub='Residual Diagnostics')
par(opar)
dev.off()
if (n > n25) {
bitmap(file='test9.png')
plot(kp3:nmkm3,gqarr[,2], main='Goldfeld-Quandt test',ylab='2-sided p-value',xlab='breakpoint')
grid()
dev.off()
}
load(file='createtable')
a<-table.start()
a<-table.row.start(a)
a<-table.element(a, 'Multiple Linear Regression - Estimated Regression Equation', 1, TRUE)
a<-table.row.end(a)
myeq <- colnames(x)[1]
myeq <- paste(myeq, '[t] = ', sep='')
for (i in 1:k){
if (mysum$coefficients[i,1] > 0) myeq <- paste(myeq, '+', '')
myeq <- paste(myeq, mysum$coefficients[i,1], sep=' ')
if (rownames(mysum$coefficients)[i] != '(Intercept)') {
myeq <- paste(myeq, rownames(mysum$coefficients)[i], sep='')
if (rownames(mysum$coefficients)[i] != 't') myeq <- paste(myeq, '[t]', sep='')
}
}
myeq <- paste(myeq, ' + e[t]')
a<-table.row.start(a)
a<-table.element(a, myeq)
a<-table.row.end(a)
a<-table.end(a)
table.save(a,file='mytable1.tab')
a<-table.start()
a<-table.row.start(a)
a<-table.element(a,hyperlink('ols1.htm','Multiple Linear Regression - Ordinary Least Squares',''), 6, TRUE)
a<-table.row.end(a)
a<-table.row.start(a)
a<-table.element(a,'Variable',header=TRUE)
a<-table.element(a,'Parameter',header=TRUE)
a<-table.element(a,'S.D.',header=TRUE)
a<-table.element(a,'T-STAT
H0: parameter = 0',header=TRUE)
a<-table.element(a,'2-tail p-value',header=TRUE)
a<-table.element(a,'1-tail p-value',header=TRUE)
a<-table.row.end(a)
for (i in 1:k){
a<-table.row.start(a)
a<-table.element(a,rownames(mysum$coefficients)[i],header=TRUE)
a<-table.element(a,mysum$coefficients[i,1])
a<-table.element(a, round(mysum$coefficients[i,2],6))
a<-table.element(a, round(mysum$coefficients[i,3],4))
a<-table.element(a, round(mysum$coefficients[i,4],6))
a<-table.element(a, round(mysum$coefficients[i,4]/2,6))
a<-table.row.end(a)
}
a<-table.end(a)
table.save(a,file='mytable2.tab')
a<-table.start()
a<-table.row.start(a)
a<-table.element(a, 'Multiple Linear Regression - Regression Statistics', 2, TRUE)
a<-table.row.end(a)
a<-table.row.start(a)
a<-table.element(a, 'Multiple R',1,TRUE)
a<-table.element(a, sqrt(mysum$r.squared))
a<-table.row.end(a)
a<-table.row.start(a)
a<-table.element(a, 'R-squared',1,TRUE)
a<-table.element(a, mysum$r.squared)
a<-table.row.end(a)
a<-table.row.start(a)
a<-table.element(a, 'Adjusted R-squared',1,TRUE)
a<-table.element(a, mysum$adj.r.squared)
a<-table.row.end(a)
a<-table.row.start(a)
a<-table.element(a, 'F-TEST (value)',1,TRUE)
a<-table.element(a, mysum$fstatistic[1])
a<-table.row.end(a)
a<-table.row.start(a)
a<-table.element(a, 'F-TEST (DF numerator)',1,TRUE)
a<-table.element(a, mysum$fstatistic[2])
a<-table.row.end(a)
a<-table.row.start(a)
a<-table.element(a, 'F-TEST (DF denominator)',1,TRUE)
a<-table.element(a, mysum$fstatistic[3])
a<-table.row.end(a)
a<-table.row.start(a)
a<-table.element(a, 'p-value',1,TRUE)
a<-table.element(a, 1-pf(mysum$fstatistic[1],mysum$fstatistic[2],mysum$fstatistic[3]))
a<-table.row.end(a)
a<-table.row.start(a)
a<-table.element(a, 'Multiple Linear Regression - Residual Statistics', 2, TRUE)
a<-table.row.end(a)
a<-table.row.start(a)
a<-table.element(a, 'Residual Standard Deviation',1,TRUE)
a<-table.element(a, mysum$sigma)
a<-table.row.end(a)
a<-table.row.start(a)
a<-table.element(a, 'Sum Squared Residuals',1,TRUE)
a<-table.element(a, sum(myerror*myerror))
a<-table.row.end(a)
a<-table.end(a)
table.save(a,file='mytable3.tab')
a<-table.start()
a<-table.row.start(a)
a<-table.element(a, 'Multiple Linear Regression - Actuals, Interpolation, and Residuals', 4, TRUE)
a<-table.row.end(a)
a<-table.row.start(a)
a<-table.element(a, 'Time or Index', 1, TRUE)
a<-table.element(a, 'Actuals', 1, TRUE)
a<-table.element(a, 'Interpolation
Forecast', 1, TRUE)
a<-table.element(a, 'Residuals
Prediction Error', 1, TRUE)
a<-table.row.end(a)
for (i in 1:n) {
a<-table.row.start(a)
a<-table.element(a,i, 1, TRUE)
a<-table.element(a,x[i])
a<-table.element(a,x[i]-mysum$resid[i])
a<-table.element(a,mysum$resid[i])
a<-table.row.end(a)
}
a<-table.end(a)
table.save(a,file='mytable4.tab')
if (n > n25) {
a<-table.start()
a<-table.row.start(a)
a<-table.element(a,'Goldfeld-Quandt test for Heteroskedasticity',4,TRUE)
a<-table.row.end(a)
a<-table.row.start(a)
a<-table.element(a,'p-values',header=TRUE)
a<-table.element(a,'Alternative Hypothesis',3,header=TRUE)
a<-table.row.end(a)
a<-table.row.start(a)
a<-table.element(a,'breakpoint index',header=TRUE)
a<-table.element(a,'greater',header=TRUE)
a<-table.element(a,'2-sided',header=TRUE)
a<-table.element(a,'less',header=TRUE)
a<-table.row.end(a)
for (mypoint in kp3:nmkm3) {
a<-table.row.start(a)
a<-table.element(a,mypoint,header=TRUE)
a<-table.element(a,gqarr[mypoint-kp3+1,1])
a<-table.element(a,gqarr[mypoint-kp3+1,2])
a<-table.element(a,gqarr[mypoint-kp3+1,3])
a<-table.row.end(a)
}
a<-table.end(a)
table.save(a,file='mytable5.tab')
a<-table.start()
a<-table.row.start(a)
a<-table.element(a,'Meta Analysis of Goldfeld-Quandt test for Heteroskedasticity',4,TRUE)
a<-table.row.end(a)
a<-table.row.start(a)
a<-table.element(a,'Description',header=TRUE)
a<-table.element(a,'# significant tests',header=TRUE)
a<-table.element(a,'% significant tests',header=TRUE)
a<-table.element(a,'OK/NOK',header=TRUE)
a<-table.row.end(a)
a<-table.row.start(a)
a<-table.element(a,'1% type I error level',header=TRUE)
a<-table.element(a,numsignificant1)
a<-table.element(a,numsignificant1/numgqtests)
if (numsignificant1/numgqtests < 0.01) dum <- 'OK' else dum <- 'NOK'
a<-table.element(a,dum)
a<-table.row.end(a)
a<-table.row.start(a)
a<-table.element(a,'5% type I error level',header=TRUE)
a<-table.element(a,numsignificant5)
a<-table.element(a,numsignificant5/numgqtests)
if (numsignificant5/numgqtests < 0.05) dum <- 'OK' else dum <- 'NOK'
a<-table.element(a,dum)
a<-table.row.end(a)
a<-table.row.start(a)
a<-table.element(a,'10% type I error level',header=TRUE)
a<-table.element(a,numsignificant10)
a<-table.element(a,numsignificant10/numgqtests)
if (numsignificant10/numgqtests < 0.1) dum <- 'OK' else dum <- 'NOK'
a<-table.element(a,dum)
a<-table.row.end(a)
a<-table.end(a)
table.save(a,file='mytable6.tab')
}