\begin{tabular}{lllllllll}
\hline
Summary of computational transaction \tabularnewline
Raw Input & view raw input (R code)  \tabularnewline
Raw Output & view raw output of R engine  \tabularnewline
Computing time & 8 seconds \tabularnewline
R Server & 'Gwilym Jenkins' @ jenkins.wessa.net \tabularnewline
\hline
\end{tabular}
%Source: https://freestatistics.org/blog/index.php?pk=232509&T=0
[TABLE]
[ROW][C]Summary of computational transaction[/C][/ROW]
[ROW][C]Raw Input[/C][C]view raw input (R code) [/C][/ROW]
[ROW][C]Raw Output[/C][C]view raw output of R engine [/C][/ROW]
[ROW][C]Computing time[/C][C]8 seconds[/C][/ROW]
[ROW][C]R Server[/C][C]'Gwilym Jenkins' @ jenkins.wessa.net[/C][/ROW]
[/TABLE]
Source: https://freestatistics.org/blog/index.php?pk=232509&T=0
If you paste this QR Code into your document, anyone with a smartphone or tablet will be able to scan it and view this table in a browser.
If you paste this QR Code into your document, anyone with a smartphone or tablet will be able to scan it and view this table in a browser.
If you paste this QR Code into your document, anyone with a smartphone or tablet will be able to scan it and view this table in a browser.
If you paste this QR Code into your document, anyone with a smartphone or tablet will be able to scan it and view this table in a browser.
If you paste this QR Code into your document, anyone with a smartphone or tablet will be able to scan it and view this table in a browser.
| Properties of Density Trace | | Bandwidth | 30 | | #Observations | 153 |
\begin{tabular}{lllllllll}
\hline
Properties of Density Trace \tabularnewline
Bandwidth & 30 \tabularnewline
#Observations & 153 \tabularnewline
\hline
\end{tabular}
%Source: https://freestatistics.org/blog/index.php?pk=232509&T=1
[TABLE]
[ROW][C]Properties of Density Trace[/C][/ROW]
[ROW][C]Bandwidth[/C][C]30[/C][/ROW]
[ROW][C]#Observations[/C][C]153[/C][/ROW]
[/TABLE]
Source: https://freestatistics.org/blog/index.php?pk=232509&T=1
Globally Unique Identifier (entire table): ba.freestatistics.org/blog/index.php?pk=232509&T=1
As an alternative you can also use a QR Code:
The GUIDs for individual cells are displayed in the table below:
| Properties of Density Trace | | Bandwidth | 30 | | #Observations | 153 |
If you paste this QR Code into your document, anyone with a smartphone or tablet will be able to scan it and view this table in a browser.
If you paste this QR Code into your document, anyone with a smartphone or tablet will be able to scan it and view this table in a browser.
If you paste this QR Code into your document, anyone with a smartphone or tablet will be able to scan it and view this table in a browser.
If you paste this QR Code into your document, anyone with a smartphone or tablet will be able to scan it and view this table in a browser.
If you paste this QR Code into your document, anyone with a smartphone or tablet will be able to scan it and view this table in a browser.
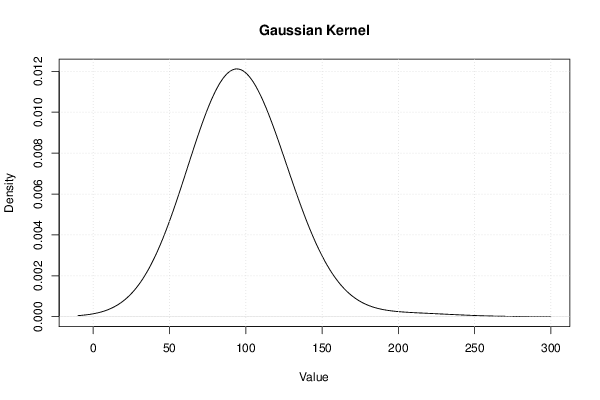
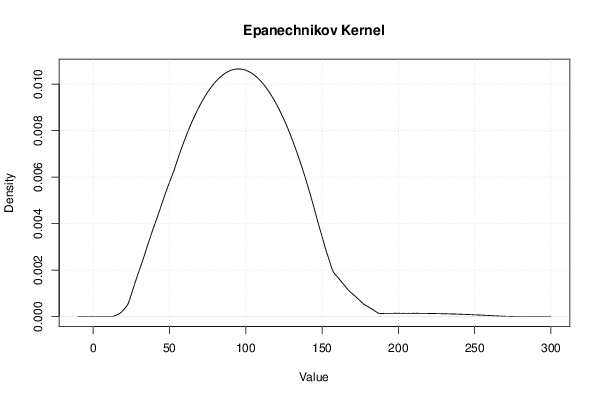
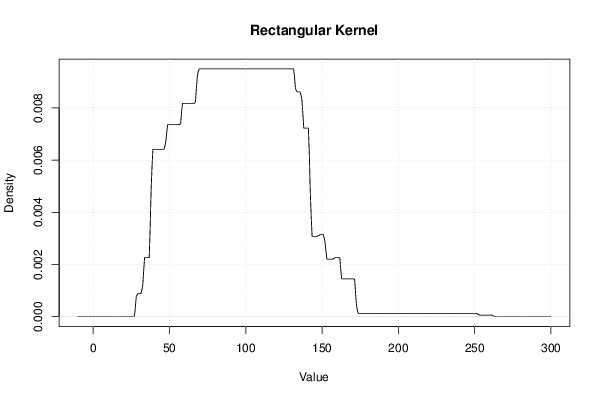
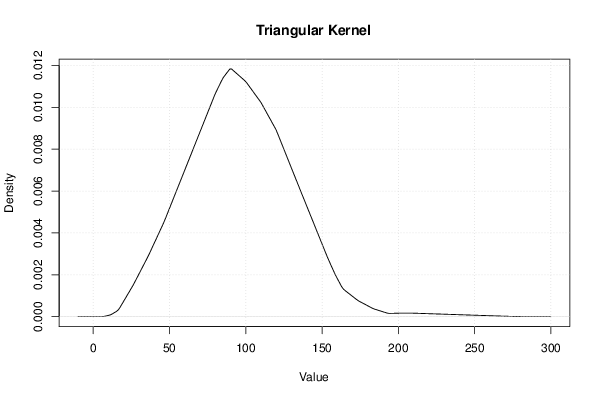
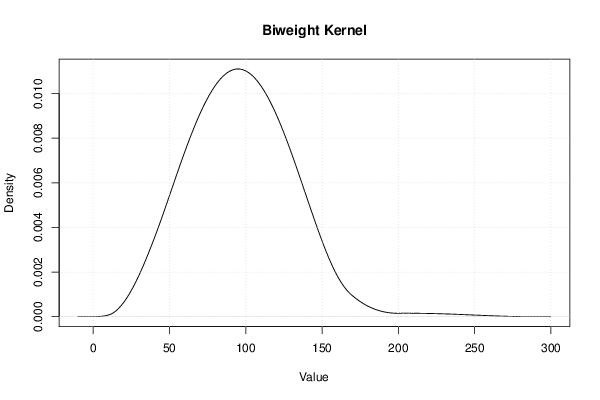
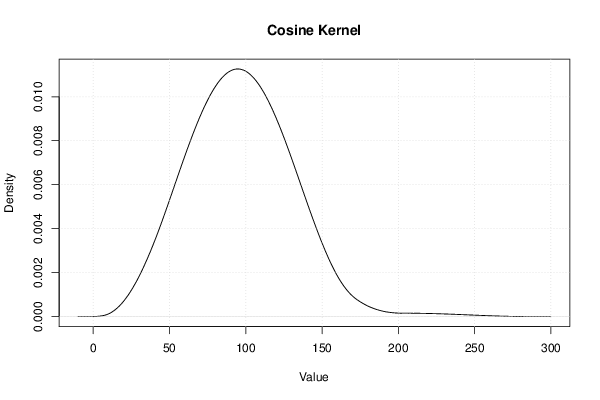
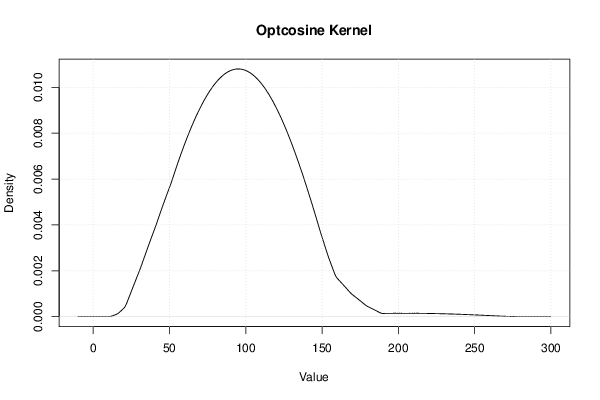
| Maximum Density Values | | Kernel | x-value | max. density | | Gaussian | 93.7377690802348 | 0.0121157807477659 | | Epanechnikov | 94.9510763209393 | 0.0106539400813084 | | Rectangular | 69.4716242661448 | 0.0094967201141213 | | Triangular | 90.0978473581213 | 0.0118292973437474 | | Biweight | 94.9510763209393 | 0.0111023460714745 | | Cosine | 94.9510763209393 | 0.0112645241879143 | | Optcosine | 94.9510763209393 | 0.0108008702437607 |
\begin{tabular}{lllllllll}
\hline
Maximum Density Values \tabularnewline
Kernel & x-value & max. density \tabularnewline
Gaussian & 93.7377690802348 & 0.0121157807477659 \tabularnewline
Epanechnikov & 94.9510763209393 & 0.0106539400813084 \tabularnewline
Rectangular & 69.4716242661448 & 0.0094967201141213 \tabularnewline
Triangular & 90.0978473581213 & 0.0118292973437474 \tabularnewline
Biweight & 94.9510763209393 & 0.0111023460714745 \tabularnewline
Cosine & 94.9510763209393 & 0.0112645241879143 \tabularnewline
Optcosine & 94.9510763209393 & 0.0108008702437607 \tabularnewline
 \hline
\end{tabular}
%Source: https://freestatistics.org/blog/index.php?pk=232509&T=2
[TABLE]
[ROW][C]Maximum Density Values[/C][/ROW]
[ROW][C]Kernel[/C][C]x-value[/C][C]max. density[/C][/ROW]
[ROW][C]Gaussian[/C][C]93.7377690802348[/C][C]0.0121157807477659[/C][/ROW]
[ROW][C]Epanechnikov[/C][C]94.9510763209393[/C][C]0.0106539400813084[/C][/ROW]
[ROW][C]Rectangular[/C][C]69.4716242661448[/C][C]0.0094967201141213[/C][/ROW]
[ROW][C]Triangular[/C][C]90.0978473581213[/C][C]0.0118292973437474[/C][/ROW]
[ROW][C]Biweight[/C][C]94.9510763209393[/C][C]0.0111023460714745[/C][/ROW]
[ROW][C]Cosine[/C][C]94.9510763209393[/C][C]0.0112645241879143[/C][/ROW]
[ROW][C]Optcosine[/C][C]94.9510763209393[/C][C]0.0108008702437607[/C][/ROW]
 [/TABLE]
Source: https://freestatistics.org/blog/index.php?pk=232509&T=2
Globally Unique Identifier (entire table): ba.freestatistics.org/blog/index.php?pk=232509&T=2
As an alternative you can also use a QR Code:
The GUIDs for individual cells are displayed in the table below:
| Maximum Density Values | | Kernel | x-value | max. density | | Gaussian | 93.7377690802348 | 0.0121157807477659 | | Epanechnikov | 94.9510763209393 | 0.0106539400813084 | | Rectangular | 69.4716242661448 | 0.0094967201141213 | | Triangular | 90.0978473581213 | 0.0118292973437474 | | Biweight | 94.9510763209393 | 0.0111023460714745 | | Cosine | 94.9510763209393 | 0.0112645241879143 | | Optcosine | 94.9510763209393 | 0.0108008702437607 |
If you paste this QR Code into your document, anyone with a smartphone or tablet will be able to scan it and view this table in a browser.
If you paste this QR Code into your document, anyone with a smartphone or tablet will be able to scan it and view this table in a browser.
If you paste this QR Code into your document, anyone with a smartphone or tablet will be able to scan it and view this table in a browser.
If you paste this QR Code into your document, anyone with a smartphone or tablet will be able to scan it and view this table in a browser.
If you paste this QR Code into your document, anyone with a smartphone or tablet will be able to scan it and view this table in a browser.
| Maximum Density Values | | Kernel | x-value | max. density | | Gaussian | 93.7377690802348 | 0.0121157807477659 | | Epanechnikov | 94.9510763209393 | 0.0106539400813084 | | Rectangular | 73.1115459882583 | 0.0094967201141213 | | Triangular | 90.0978473581213 | 0.0118292973437474 | | Biweight | 94.9510763209393 | 0.0111023460714745 | | Cosine | 94.9510763209393 | 0.0112645241879143 | | Optcosine | 94.9510763209393 | 0.0108008702437607 |
\begin{tabular}{lllllllll}
\hline
Maximum Density Values \tabularnewline
Kernel & x-value & max. density \tabularnewline
Gaussian & 93.7377690802348 & 0.0121157807477659 \tabularnewline
Epanechnikov & 94.9510763209393 & 0.0106539400813084 \tabularnewline
Rectangular & 73.1115459882583 & 0.0094967201141213 \tabularnewline
Triangular & 90.0978473581213 & 0.0118292973437474 \tabularnewline
Biweight & 94.9510763209393 & 0.0111023460714745 \tabularnewline
Cosine & 94.9510763209393 & 0.0112645241879143 \tabularnewline
Optcosine & 94.9510763209393 & 0.0108008702437607 \tabularnewline
 \hline
\end{tabular}
%Source: https://freestatistics.org/blog/index.php?pk=232509&T=3
[TABLE]
[ROW][C]Maximum Density Values[/C][/ROW]
[ROW][C]Kernel[/C][C]x-value[/C][C]max. density[/C][/ROW]
[ROW][C]Gaussian[/C][C]93.7377690802348[/C][C]0.0121157807477659[/C][/ROW]
[ROW][C]Epanechnikov[/C][C]94.9510763209393[/C][C]0.0106539400813084[/C][/ROW]
[ROW][C]Rectangular[/C][C]73.1115459882583[/C][C]0.0094967201141213[/C][/ROW]
[ROW][C]Triangular[/C][C]90.0978473581213[/C][C]0.0118292973437474[/C][/ROW]
[ROW][C]Biweight[/C][C]94.9510763209393[/C][C]0.0111023460714745[/C][/ROW]
[ROW][C]Cosine[/C][C]94.9510763209393[/C][C]0.0112645241879143[/C][/ROW]
[ROW][C]Optcosine[/C][C]94.9510763209393[/C][C]0.0108008702437607[/C][/ROW]
 [/TABLE]
Source: https://freestatistics.org/blog/index.php?pk=232509&T=3
Globally Unique Identifier (entire table): ba.freestatistics.org/blog/index.php?pk=232509&T=3
As an alternative you can also use a QR Code:
The GUIDs for individual cells are displayed in the table below:
| Maximum Density Values | | Kernel | x-value | max. density | | Gaussian | 93.7377690802348 | 0.0121157807477659 | | Epanechnikov | 94.9510763209393 | 0.0106539400813084 | | Rectangular | 73.1115459882583 | 0.0094967201141213 | | Triangular | 90.0978473581213 | 0.0118292973437474 | | Biweight | 94.9510763209393 | 0.0111023460714745 | | Cosine | 94.9510763209393 | 0.0112645241879143 | | Optcosine | 94.9510763209393 | 0.0108008702437607 |
If you paste this QR Code into your document, anyone with a smartphone or tablet will be able to scan it and view this table in a browser.
If you paste this QR Code into your document, anyone with a smartphone or tablet will be able to scan it and view this table in a browser.
If you paste this QR Code into your document, anyone with a smartphone or tablet will be able to scan it and view this table in a browser.
If you paste this QR Code into your document, anyone with a smartphone or tablet will be able to scan it and view this table in a browser.
If you paste this QR Code into your document, anyone with a smartphone or tablet will be able to scan it and view this table in a browser.
| Maximum Density Values | | Kernel | x-value | max. density | | Gaussian | 93.7377690802348 | 0.0121157807477659 | | Epanechnikov | 94.9510763209393 | 0.0106539400813084 | | Rectangular | 73.7181996086106 | 0.0094967201141213 | | Triangular | 90.0978473581213 | 0.0118292973437474 | | Biweight | 94.9510763209393 | 0.0111023460714745 | | Cosine | 94.9510763209393 | 0.0112645241879143 | | Optcosine | 94.9510763209393 | 0.0108008702437607 |
\begin{tabular}{lllllllll}
\hline
Maximum Density Values \tabularnewline
Kernel & x-value & max. density \tabularnewline
Gaussian & 93.7377690802348 & 0.0121157807477659 \tabularnewline
Epanechnikov & 94.9510763209393 & 0.0106539400813084 \tabularnewline
Rectangular & 73.7181996086106 & 0.0094967201141213 \tabularnewline
Triangular & 90.0978473581213 & 0.0118292973437474 \tabularnewline
Biweight & 94.9510763209393 & 0.0111023460714745 \tabularnewline
Cosine & 94.9510763209393 & 0.0112645241879143 \tabularnewline
Optcosine & 94.9510763209393 & 0.0108008702437607 \tabularnewline
 \hline
\end{tabular}
%Source: https://freestatistics.org/blog/index.php?pk=232509&T=4
[TABLE]
[ROW][C]Maximum Density Values[/C][/ROW]
[ROW][C]Kernel[/C][C]x-value[/C][C]max. density[/C][/ROW]
[ROW][C]Gaussian[/C][C]93.7377690802348[/C][C]0.0121157807477659[/C][/ROW]
[ROW][C]Epanechnikov[/C][C]94.9510763209393[/C][C]0.0106539400813084[/C][/ROW]
[ROW][C]Rectangular[/C][C]73.7181996086106[/C][C]0.0094967201141213[/C][/ROW]
[ROW][C]Triangular[/C][C]90.0978473581213[/C][C]0.0118292973437474[/C][/ROW]
[ROW][C]Biweight[/C][C]94.9510763209393[/C][C]0.0111023460714745[/C][/ROW]
[ROW][C]Cosine[/C][C]94.9510763209393[/C][C]0.0112645241879143[/C][/ROW]
[ROW][C]Optcosine[/C][C]94.9510763209393[/C][C]0.0108008702437607[/C][/ROW]
 [/TABLE]
Source: https://freestatistics.org/blog/index.php?pk=232509&T=4
Globally Unique Identifier (entire table): ba.freestatistics.org/blog/index.php?pk=232509&T=4
As an alternative you can also use a QR Code:
The GUIDs for individual cells are displayed in the table below:
| Maximum Density Values | | Kernel | x-value | max. density | | Gaussian | 93.7377690802348 | 0.0121157807477659 | | Epanechnikov | 94.9510763209393 | 0.0106539400813084 | | Rectangular | 73.7181996086106 | 0.0094967201141213 | | Triangular | 90.0978473581213 | 0.0118292973437474 | | Biweight | 94.9510763209393 | 0.0111023460714745 | | Cosine | 94.9510763209393 | 0.0112645241879143 | | Optcosine | 94.9510763209393 | 0.0108008702437607 |
If you paste this QR Code into your document, anyone with a smartphone or tablet will be able to scan it and view this table in a browser.
If you paste this QR Code into your document, anyone with a smartphone or tablet will be able to scan it and view this table in a browser.
If you paste this QR Code into your document, anyone with a smartphone or tablet will be able to scan it and view this table in a browser.
If you paste this QR Code into your document, anyone with a smartphone or tablet will be able to scan it and view this table in a browser.
If you paste this QR Code into your document, anyone with a smartphone or tablet will be able to scan it and view this table in a browser.
| Maximum Density Values | | Kernel | x-value | max. density | | Gaussian | 93.7377690802348 | 0.0121157807477659 | | Epanechnikov | 94.9510763209393 | 0.0106539400813084 | | Rectangular | 74.3248532289628 | 0.0094967201141213 | | Triangular | 90.0978473581213 | 0.0118292973437474 | | Biweight | 94.9510763209393 | 0.0111023460714745 | | Cosine | 94.9510763209393 | 0.0112645241879143 | | Optcosine | 94.9510763209393 | 0.0108008702437607 |
\begin{tabular}{lllllllll}
\hline
Maximum Density Values \tabularnewline
Kernel & x-value & max. density \tabularnewline
Gaussian & 93.7377690802348 & 0.0121157807477659 \tabularnewline
Epanechnikov & 94.9510763209393 & 0.0106539400813084 \tabularnewline
Rectangular & 74.3248532289628 & 0.0094967201141213 \tabularnewline
Triangular & 90.0978473581213 & 0.0118292973437474 \tabularnewline
Biweight & 94.9510763209393 & 0.0111023460714745 \tabularnewline
Cosine & 94.9510763209393 & 0.0112645241879143 \tabularnewline
Optcosine & 94.9510763209393 & 0.0108008702437607 \tabularnewline
 \hline
\end{tabular}
%Source: https://freestatistics.org/blog/index.php?pk=232509&T=5
[TABLE]
[ROW][C]Maximum Density Values[/C][/ROW]
[ROW][C]Kernel[/C][C]x-value[/C][C]max. density[/C][/ROW]
[ROW][C]Gaussian[/C][C]93.7377690802348[/C][C]0.0121157807477659[/C][/ROW]
[ROW][C]Epanechnikov[/C][C]94.9510763209393[/C][C]0.0106539400813084[/C][/ROW]
[ROW][C]Rectangular[/C][C]74.3248532289628[/C][C]0.0094967201141213[/C][/ROW]
[ROW][C]Triangular[/C][C]90.0978473581213[/C][C]0.0118292973437474[/C][/ROW]
[ROW][C]Biweight[/C][C]94.9510763209393[/C][C]0.0111023460714745[/C][/ROW]
[ROW][C]Cosine[/C][C]94.9510763209393[/C][C]0.0112645241879143[/C][/ROW]
[ROW][C]Optcosine[/C][C]94.9510763209393[/C][C]0.0108008702437607[/C][/ROW]
 [/TABLE]
Source: https://freestatistics.org/blog/index.php?pk=232509&T=5
Globally Unique Identifier (entire table): ba.freestatistics.org/blog/index.php?pk=232509&T=5
As an alternative you can also use a QR Code:
The GUIDs for individual cells are displayed in the table below:
| Maximum Density Values | | Kernel | x-value | max. density | | Gaussian | 93.7377690802348 | 0.0121157807477659 | | Epanechnikov | 94.9510763209393 | 0.0106539400813084 | | Rectangular | 74.3248532289628 | 0.0094967201141213 | | Triangular | 90.0978473581213 | 0.0118292973437474 | | Biweight | 94.9510763209393 | 0.0111023460714745 | | Cosine | 94.9510763209393 | 0.0112645241879143 | | Optcosine | 94.9510763209393 | 0.0108008702437607 |
If you paste this QR Code into your document, anyone with a smartphone or tablet will be able to scan it and view this table in a browser.
If you paste this QR Code into your document, anyone with a smartphone or tablet will be able to scan it and view this table in a browser.
If you paste this QR Code into your document, anyone with a smartphone or tablet will be able to scan it and view this table in a browser.
If you paste this QR Code into your document, anyone with a smartphone or tablet will be able to scan it and view this table in a browser.
If you paste this QR Code into your document, anyone with a smartphone or tablet will be able to scan it and view this table in a browser.
| Maximum Density Values | | Kernel | x-value | max. density | | Gaussian | 93.7377690802348 | 0.0121157807477659 | | Epanechnikov | 94.9510763209393 | 0.0106539400813084 | | Rectangular | 74.9315068493151 | 0.0094967201141213 | | Triangular | 90.0978473581213 | 0.0118292973437474 | | Biweight | 94.9510763209393 | 0.0111023460714745 | | Cosine | 94.9510763209393 | 0.0112645241879143 | | Optcosine | 94.9510763209393 | 0.0108008702437607 |
\begin{tabular}{lllllllll}
\hline
Maximum Density Values \tabularnewline
Kernel & x-value & max. density \tabularnewline
Gaussian & 93.7377690802348 & 0.0121157807477659 \tabularnewline
Epanechnikov & 94.9510763209393 & 0.0106539400813084 \tabularnewline
Rectangular & 74.9315068493151 & 0.0094967201141213 \tabularnewline
Triangular & 90.0978473581213 & 0.0118292973437474 \tabularnewline
Biweight & 94.9510763209393 & 0.0111023460714745 \tabularnewline
Cosine & 94.9510763209393 & 0.0112645241879143 \tabularnewline
Optcosine & 94.9510763209393 & 0.0108008702437607 \tabularnewline
 \hline
\end{tabular}
%Source: https://freestatistics.org/blog/index.php?pk=232509&T=6
[TABLE]
[ROW][C]Maximum Density Values[/C][/ROW]
[ROW][C]Kernel[/C][C]x-value[/C][C]max. density[/C][/ROW]
[ROW][C]Gaussian[/C][C]93.7377690802348[/C][C]0.0121157807477659[/C][/ROW]
[ROW][C]Epanechnikov[/C][C]94.9510763209393[/C][C]0.0106539400813084[/C][/ROW]
[ROW][C]Rectangular[/C][C]74.9315068493151[/C][C]0.0094967201141213[/C][/ROW]
[ROW][C]Triangular[/C][C]90.0978473581213[/C][C]0.0118292973437474[/C][/ROW]
[ROW][C]Biweight[/C][C]94.9510763209393[/C][C]0.0111023460714745[/C][/ROW]
[ROW][C]Cosine[/C][C]94.9510763209393[/C][C]0.0112645241879143[/C][/ROW]
[ROW][C]Optcosine[/C][C]94.9510763209393[/C][C]0.0108008702437607[/C][/ROW]
 [/TABLE]
Source: https://freestatistics.org/blog/index.php?pk=232509&T=6
Globally Unique Identifier (entire table): ba.freestatistics.org/blog/index.php?pk=232509&T=6
As an alternative you can also use a QR Code:
The GUIDs for individual cells are displayed in the table below:
| Maximum Density Values | | Kernel | x-value | max. density | | Gaussian | 93.7377690802348 | 0.0121157807477659 | | Epanechnikov | 94.9510763209393 | 0.0106539400813084 | | Rectangular | 74.9315068493151 | 0.0094967201141213 | | Triangular | 90.0978473581213 | 0.0118292973437474 | | Biweight | 94.9510763209393 | 0.0111023460714745 | | Cosine | 94.9510763209393 | 0.0112645241879143 | | Optcosine | 94.9510763209393 | 0.0108008702437607 |
If you paste this QR Code into your document, anyone with a smartphone or tablet will be able to scan it and view this table in a browser.
If you paste this QR Code into your document, anyone with a smartphone or tablet will be able to scan it and view this table in a browser.
If you paste this QR Code into your document, anyone with a smartphone or tablet will be able to scan it and view this table in a browser.
If you paste this QR Code into your document, anyone with a smartphone or tablet will be able to scan it and view this table in a browser.
If you paste this QR Code into your document, anyone with a smartphone or tablet will be able to scan it and view this table in a browser.
| Maximum Density Values | | Kernel | x-value | max. density | | Gaussian | 93.7377690802348 | 0.0121157807477659 | | Epanechnikov | 94.9510763209393 | 0.0106539400813084 | | Rectangular | 75.5381604696673 | 0.0094967201141213 | | Triangular | 90.0978473581213 | 0.0118292973437474 | | Biweight | 94.9510763209393 | 0.0111023460714745 | | Cosine | 94.9510763209393 | 0.0112645241879143 | | Optcosine | 94.9510763209393 | 0.0108008702437607 |
\begin{tabular}{lllllllll}
\hline
Maximum Density Values \tabularnewline
Kernel & x-value & max. density \tabularnewline
Gaussian & 93.7377690802348 & 0.0121157807477659 \tabularnewline
Epanechnikov & 94.9510763209393 & 0.0106539400813084 \tabularnewline
Rectangular & 75.5381604696673 & 0.0094967201141213 \tabularnewline
Triangular & 90.0978473581213 & 0.0118292973437474 \tabularnewline
Biweight & 94.9510763209393 & 0.0111023460714745 \tabularnewline
Cosine & 94.9510763209393 & 0.0112645241879143 \tabularnewline
Optcosine & 94.9510763209393 & 0.0108008702437607 \tabularnewline
 \hline
\end{tabular}
%Source: https://freestatistics.org/blog/index.php?pk=232509&T=7
[TABLE]
[ROW][C]Maximum Density Values[/C][/ROW]
[ROW][C]Kernel[/C][C]x-value[/C][C]max. density[/C][/ROW]
[ROW][C]Gaussian[/C][C]93.7377690802348[/C][C]0.0121157807477659[/C][/ROW]
[ROW][C]Epanechnikov[/C][C]94.9510763209393[/C][C]0.0106539400813084[/C][/ROW]
[ROW][C]Rectangular[/C][C]75.5381604696673[/C][C]0.0094967201141213[/C][/ROW]
[ROW][C]Triangular[/C][C]90.0978473581213[/C][C]0.0118292973437474[/C][/ROW]
[ROW][C]Biweight[/C][C]94.9510763209393[/C][C]0.0111023460714745[/C][/ROW]
[ROW][C]Cosine[/C][C]94.9510763209393[/C][C]0.0112645241879143[/C][/ROW]
[ROW][C]Optcosine[/C][C]94.9510763209393[/C][C]0.0108008702437607[/C][/ROW]
 [/TABLE]
Source: https://freestatistics.org/blog/index.php?pk=232509&T=7
Globally Unique Identifier (entire table): ba.freestatistics.org/blog/index.php?pk=232509&T=7
As an alternative you can also use a QR Code:
The GUIDs for individual cells are displayed in the table below:
| Maximum Density Values | | Kernel | x-value | max. density | | Gaussian | 93.7377690802348 | 0.0121157807477659 | | Epanechnikov | 94.9510763209393 | 0.0106539400813084 | | Rectangular | 75.5381604696673 | 0.0094967201141213 | | Triangular | 90.0978473581213 | 0.0118292973437474 | | Biweight | 94.9510763209393 | 0.0111023460714745 | | Cosine | 94.9510763209393 | 0.0112645241879143 | | Optcosine | 94.9510763209393 | 0.0108008702437607 |
If you paste this QR Code into your document, anyone with a smartphone or tablet will be able to scan it and view this table in a browser.
If you paste this QR Code into your document, anyone with a smartphone or tablet will be able to scan it and view this table in a browser.
If you paste this QR Code into your document, anyone with a smartphone or tablet will be able to scan it and view this table in a browser.
If you paste this QR Code into your document, anyone with a smartphone or tablet will be able to scan it and view this table in a browser.
If you paste this QR Code into your document, anyone with a smartphone or tablet will be able to scan it and view this table in a browser.
| Maximum Density Values | | Kernel | x-value | max. density | | Gaussian | 93.7377690802348 | 0.0121157807477659 | | Epanechnikov | 94.9510763209393 | 0.0106539400813084 | | Rectangular | 76.1448140900196 | 0.0094967201141213 | | Triangular | 90.0978473581213 | 0.0118292973437474 | | Biweight | 94.9510763209393 | 0.0111023460714745 | | Cosine | 94.9510763209393 | 0.0112645241879143 | | Optcosine | 94.9510763209393 | 0.0108008702437607 |
\begin{tabular}{lllllllll}
\hline
Maximum Density Values \tabularnewline
Kernel & x-value & max. density \tabularnewline
Gaussian & 93.7377690802348 & 0.0121157807477659 \tabularnewline
Epanechnikov & 94.9510763209393 & 0.0106539400813084 \tabularnewline
Rectangular & 76.1448140900196 & 0.0094967201141213 \tabularnewline
Triangular & 90.0978473581213 & 0.0118292973437474 \tabularnewline
Biweight & 94.9510763209393 & 0.0111023460714745 \tabularnewline
Cosine & 94.9510763209393 & 0.0112645241879143 \tabularnewline
Optcosine & 94.9510763209393 & 0.0108008702437607 \tabularnewline
 \hline
\end{tabular}
%Source: https://freestatistics.org/blog/index.php?pk=232509&T=8
[TABLE]
[ROW][C]Maximum Density Values[/C][/ROW]
[ROW][C]Kernel[/C][C]x-value[/C][C]max. density[/C][/ROW]
[ROW][C]Gaussian[/C][C]93.7377690802348[/C][C]0.0121157807477659[/C][/ROW]
[ROW][C]Epanechnikov[/C][C]94.9510763209393[/C][C]0.0106539400813084[/C][/ROW]
[ROW][C]Rectangular[/C][C]76.1448140900196[/C][C]0.0094967201141213[/C][/ROW]
[ROW][C]Triangular[/C][C]90.0978473581213[/C][C]0.0118292973437474[/C][/ROW]
[ROW][C]Biweight[/C][C]94.9510763209393[/C][C]0.0111023460714745[/C][/ROW]
[ROW][C]Cosine[/C][C]94.9510763209393[/C][C]0.0112645241879143[/C][/ROW]
[ROW][C]Optcosine[/C][C]94.9510763209393[/C][C]0.0108008702437607[/C][/ROW]
 [/TABLE]
Source: https://freestatistics.org/blog/index.php?pk=232509&T=8
Globally Unique Identifier (entire table): ba.freestatistics.org/blog/index.php?pk=232509&T=8
As an alternative you can also use a QR Code:
The GUIDs for individual cells are displayed in the table below:
| Maximum Density Values | | Kernel | x-value | max. density | | Gaussian | 93.7377690802348 | 0.0121157807477659 | | Epanechnikov | 94.9510763209393 | 0.0106539400813084 | | Rectangular | 76.1448140900196 | 0.0094967201141213 | | Triangular | 90.0978473581213 | 0.0118292973437474 | | Biweight | 94.9510763209393 | 0.0111023460714745 | | Cosine | 94.9510763209393 | 0.0112645241879143 | | Optcosine | 94.9510763209393 | 0.0108008702437607 |
If you paste this QR Code into your document, anyone with a smartphone or tablet will be able to scan it and view this table in a browser.
If you paste this QR Code into your document, anyone with a smartphone or tablet will be able to scan it and view this table in a browser.
If you paste this QR Code into your document, anyone with a smartphone or tablet will be able to scan it and view this table in a browser.
If you paste this QR Code into your document, anyone with a smartphone or tablet will be able to scan it and view this table in a browser.
If you paste this QR Code into your document, anyone with a smartphone or tablet will be able to scan it and view this table in a browser.
| Maximum Density Values | | Kernel | x-value | max. density | | Gaussian | 93.7377690802348 | 0.0121157807477659 | | Epanechnikov | 94.9510763209393 | 0.0106539400813084 | | Rectangular | 76.7514677103718 | 0.0094967201141213 | | Triangular | 90.0978473581213 | 0.0118292973437474 | | Biweight | 94.9510763209393 | 0.0111023460714745 | | Cosine | 94.9510763209393 | 0.0112645241879143 | | Optcosine | 94.9510763209393 | 0.0108008702437607 |
\begin{tabular}{lllllllll}
\hline
Maximum Density Values \tabularnewline
Kernel & x-value & max. density \tabularnewline
Gaussian & 93.7377690802348 & 0.0121157807477659 \tabularnewline
Epanechnikov & 94.9510763209393 & 0.0106539400813084 \tabularnewline
Rectangular & 76.7514677103718 & 0.0094967201141213 \tabularnewline
Triangular & 90.0978473581213 & 0.0118292973437474 \tabularnewline
Biweight & 94.9510763209393 & 0.0111023460714745 \tabularnewline
Cosine & 94.9510763209393 & 0.0112645241879143 \tabularnewline
Optcosine & 94.9510763209393 & 0.0108008702437607 \tabularnewline
 \hline
\end{tabular}
%Source: https://freestatistics.org/blog/index.php?pk=232509&T=9
[TABLE]
[ROW][C]Maximum Density Values[/C][/ROW]
[ROW][C]Kernel[/C][C]x-value[/C][C]max. density[/C][/ROW]
[ROW][C]Gaussian[/C][C]93.7377690802348[/C][C]0.0121157807477659[/C][/ROW]
[ROW][C]Epanechnikov[/C][C]94.9510763209393[/C][C]0.0106539400813084[/C][/ROW]
[ROW][C]Rectangular[/C][C]76.7514677103718[/C][C]0.0094967201141213[/C][/ROW]
[ROW][C]Triangular[/C][C]90.0978473581213[/C][C]0.0118292973437474[/C][/ROW]
[ROW][C]Biweight[/C][C]94.9510763209393[/C][C]0.0111023460714745[/C][/ROW]
[ROW][C]Cosine[/C][C]94.9510763209393[/C][C]0.0112645241879143[/C][/ROW]
[ROW][C]Optcosine[/C][C]94.9510763209393[/C][C]0.0108008702437607[/C][/ROW]
 [/TABLE]
Source: https://freestatistics.org/blog/index.php?pk=232509&T=9
Globally Unique Identifier (entire table): ba.freestatistics.org/blog/index.php?pk=232509&T=9
As an alternative you can also use a QR Code:
The GUIDs for individual cells are displayed in the table below:
| Maximum Density Values | | Kernel | x-value | max. density | | Gaussian | 93.7377690802348 | 0.0121157807477659 | | Epanechnikov | 94.9510763209393 | 0.0106539400813084 | | Rectangular | 76.7514677103718 | 0.0094967201141213 | | Triangular | 90.0978473581213 | 0.0118292973437474 | | Biweight | 94.9510763209393 | 0.0111023460714745 | | Cosine | 94.9510763209393 | 0.0112645241879143 | | Optcosine | 94.9510763209393 | 0.0108008702437607 |
If you paste this QR Code into your document, anyone with a smartphone or tablet will be able to scan it and view this table in a browser.
If you paste this QR Code into your document, anyone with a smartphone or tablet will be able to scan it and view this table in a browser.
If you paste this QR Code into your document, anyone with a smartphone or tablet will be able to scan it and view this table in a browser.
If you paste this QR Code into your document, anyone with a smartphone or tablet will be able to scan it and view this table in a browser.
If you paste this QR Code into your document, anyone with a smartphone or tablet will be able to scan it and view this table in a browser.
| Maximum Density Values | | Kernel | x-value | max. density | | Gaussian | 93.7377690802348 | 0.0121157807477659 | | Epanechnikov | 94.9510763209393 | 0.0106539400813084 | | Rectangular | 77.3581213307241 | 0.0094967201141213 | | Triangular | 90.0978473581213 | 0.0118292973437474 | | Biweight | 94.9510763209393 | 0.0111023460714745 | | Cosine | 94.9510763209393 | 0.0112645241879143 | | Optcosine | 94.9510763209393 | 0.0108008702437607 |
\begin{tabular}{lllllllll}
\hline
Maximum Density Values \tabularnewline
Kernel & x-value & max. density \tabularnewline
Gaussian & 93.7377690802348 & 0.0121157807477659 \tabularnewline
Epanechnikov & 94.9510763209393 & 0.0106539400813084 \tabularnewline
Rectangular & 77.3581213307241 & 0.0094967201141213 \tabularnewline
Triangular & 90.0978473581213 & 0.0118292973437474 \tabularnewline
Biweight & 94.9510763209393 & 0.0111023460714745 \tabularnewline
Cosine & 94.9510763209393 & 0.0112645241879143 \tabularnewline
Optcosine & 94.9510763209393 & 0.0108008702437607 \tabularnewline
 \hline
\end{tabular}
%Source: https://freestatistics.org/blog/index.php?pk=232509&T=10
[TABLE]
[ROW][C]Maximum Density Values[/C][/ROW]
[ROW][C]Kernel[/C][C]x-value[/C][C]max. density[/C][/ROW]
[ROW][C]Gaussian[/C][C]93.7377690802348[/C][C]0.0121157807477659[/C][/ROW]
[ROW][C]Epanechnikov[/C][C]94.9510763209393[/C][C]0.0106539400813084[/C][/ROW]
[ROW][C]Rectangular[/C][C]77.3581213307241[/C][C]0.0094967201141213[/C][/ROW]
[ROW][C]Triangular[/C][C]90.0978473581213[/C][C]0.0118292973437474[/C][/ROW]
[ROW][C]Biweight[/C][C]94.9510763209393[/C][C]0.0111023460714745[/C][/ROW]
[ROW][C]Cosine[/C][C]94.9510763209393[/C][C]0.0112645241879143[/C][/ROW]
[ROW][C]Optcosine[/C][C]94.9510763209393[/C][C]0.0108008702437607[/C][/ROW]
 [/TABLE]
Source: https://freestatistics.org/blog/index.php?pk=232509&T=10
Globally Unique Identifier (entire table): ba.freestatistics.org/blog/index.php?pk=232509&T=10
As an alternative you can also use a QR Code:
The GUIDs for individual cells are displayed in the table below:
| Maximum Density Values | | Kernel | x-value | max. density | | Gaussian | 93.7377690802348 | 0.0121157807477659 | | Epanechnikov | 94.9510763209393 | 0.0106539400813084 | | Rectangular | 77.3581213307241 | 0.0094967201141213 | | Triangular | 90.0978473581213 | 0.0118292973437474 | | Biweight | 94.9510763209393 | 0.0111023460714745 | | Cosine | 94.9510763209393 | 0.0112645241879143 | | Optcosine | 94.9510763209393 | 0.0108008702437607 |
If you paste this QR Code into your document, anyone with a smartphone or tablet will be able to scan it and view this table in a browser.
If you paste this QR Code into your document, anyone with a smartphone or tablet will be able to scan it and view this table in a browser.
If you paste this QR Code into your document, anyone with a smartphone or tablet will be able to scan it and view this table in a browser.
If you paste this QR Code into your document, anyone with a smartphone or tablet will be able to scan it and view this table in a browser.
If you paste this QR Code into your document, anyone with a smartphone or tablet will be able to scan it and view this table in a browser.
| Maximum Density Values | | Kernel | x-value | max. density | | Gaussian | 93.7377690802348 | 0.0121157807477659 | | Epanechnikov | 94.9510763209393 | 0.0106539400813084 | | Rectangular | 77.9647749510763 | 0.0094967201141213 | | Triangular | 90.0978473581213 | 0.0118292973437474 | | Biweight | 94.9510763209393 | 0.0111023460714745 | | Cosine | 94.9510763209393 | 0.0112645241879143 | | Optcosine | 94.9510763209393 | 0.0108008702437607 |
\begin{tabular}{lllllllll}
\hline
Maximum Density Values \tabularnewline
Kernel & x-value & max. density \tabularnewline
Gaussian & 93.7377690802348 & 0.0121157807477659 \tabularnewline
Epanechnikov & 94.9510763209393 & 0.0106539400813084 \tabularnewline
Rectangular & 77.9647749510763 & 0.0094967201141213 \tabularnewline
Triangular & 90.0978473581213 & 0.0118292973437474 \tabularnewline
Biweight & 94.9510763209393 & 0.0111023460714745 \tabularnewline
Cosine & 94.9510763209393 & 0.0112645241879143 \tabularnewline
Optcosine & 94.9510763209393 & 0.0108008702437607 \tabularnewline
 \hline
\end{tabular}
%Source: https://freestatistics.org/blog/index.php?pk=232509&T=11
[TABLE]
[ROW][C]Maximum Density Values[/C][/ROW]
[ROW][C]Kernel[/C][C]x-value[/C][C]max. density[/C][/ROW]
[ROW][C]Gaussian[/C][C]93.7377690802348[/C][C]0.0121157807477659[/C][/ROW]
[ROW][C]Epanechnikov[/C][C]94.9510763209393[/C][C]0.0106539400813084[/C][/ROW]
[ROW][C]Rectangular[/C][C]77.9647749510763[/C][C]0.0094967201141213[/C][/ROW]
[ROW][C]Triangular[/C][C]90.0978473581213[/C][C]0.0118292973437474[/C][/ROW]
[ROW][C]Biweight[/C][C]94.9510763209393[/C][C]0.0111023460714745[/C][/ROW]
[ROW][C]Cosine[/C][C]94.9510763209393[/C][C]0.0112645241879143[/C][/ROW]
[ROW][C]Optcosine[/C][C]94.9510763209393[/C][C]0.0108008702437607[/C][/ROW]
 [/TABLE]
Source: https://freestatistics.org/blog/index.php?pk=232509&T=11
Globally Unique Identifier (entire table): ba.freestatistics.org/blog/index.php?pk=232509&T=11
As an alternative you can also use a QR Code:
The GUIDs for individual cells are displayed in the table below:
| Maximum Density Values | | Kernel | x-value | max. density | | Gaussian | 93.7377690802348 | 0.0121157807477659 | | Epanechnikov | 94.9510763209393 | 0.0106539400813084 | | Rectangular | 77.9647749510763 | 0.0094967201141213 | | Triangular | 90.0978473581213 | 0.0118292973437474 | | Biweight | 94.9510763209393 | 0.0111023460714745 | | Cosine | 94.9510763209393 | 0.0112645241879143 | | Optcosine | 94.9510763209393 | 0.0108008702437607 |
If you paste this QR Code into your document, anyone with a smartphone or tablet will be able to scan it and view this table in a browser.
If you paste this QR Code into your document, anyone with a smartphone or tablet will be able to scan it and view this table in a browser.
If you paste this QR Code into your document, anyone with a smartphone or tablet will be able to scan it and view this table in a browser.
If you paste this QR Code into your document, anyone with a smartphone or tablet will be able to scan it and view this table in a browser.
If you paste this QR Code into your document, anyone with a smartphone or tablet will be able to scan it and view this table in a browser.
| Maximum Density Values | | Kernel | x-value | max. density | | Gaussian | 93.7377690802348 | 0.0121157807477659 | | Epanechnikov | 94.9510763209393 | 0.0106539400813084 | | Rectangular | 78.5714285714286 | 0.0094967201141213 | | Triangular | 90.0978473581213 | 0.0118292973437474 | | Biweight | 94.9510763209393 | 0.0111023460714745 | | Cosine | 94.9510763209393 | 0.0112645241879143 | | Optcosine | 94.9510763209393 | 0.0108008702437607 |
\begin{tabular}{lllllllll}
\hline
Maximum Density Values \tabularnewline
Kernel & x-value & max. density \tabularnewline
Gaussian & 93.7377690802348 & 0.0121157807477659 \tabularnewline
Epanechnikov & 94.9510763209393 & 0.0106539400813084 \tabularnewline
Rectangular & 78.5714285714286 & 0.0094967201141213 \tabularnewline
Triangular & 90.0978473581213 & 0.0118292973437474 \tabularnewline
Biweight & 94.9510763209393 & 0.0111023460714745 \tabularnewline
Cosine & 94.9510763209393 & 0.0112645241879143 \tabularnewline
Optcosine & 94.9510763209393 & 0.0108008702437607 \tabularnewline
 \hline
\end{tabular}
%Source: https://freestatistics.org/blog/index.php?pk=232509&T=12
[TABLE]
[ROW][C]Maximum Density Values[/C][/ROW]
[ROW][C]Kernel[/C][C]x-value[/C][C]max. density[/C][/ROW]
[ROW][C]Gaussian[/C][C]93.7377690802348[/C][C]0.0121157807477659[/C][/ROW]
[ROW][C]Epanechnikov[/C][C]94.9510763209393[/C][C]0.0106539400813084[/C][/ROW]
[ROW][C]Rectangular[/C][C]78.5714285714286[/C][C]0.0094967201141213[/C][/ROW]
[ROW][C]Triangular[/C][C]90.0978473581213[/C][C]0.0118292973437474[/C][/ROW]
[ROW][C]Biweight[/C][C]94.9510763209393[/C][C]0.0111023460714745[/C][/ROW]
[ROW][C]Cosine[/C][C]94.9510763209393[/C][C]0.0112645241879143[/C][/ROW]
[ROW][C]Optcosine[/C][C]94.9510763209393[/C][C]0.0108008702437607[/C][/ROW]
 [/TABLE]
Source: https://freestatistics.org/blog/index.php?pk=232509&T=12
Globally Unique Identifier (entire table): ba.freestatistics.org/blog/index.php?pk=232509&T=12
As an alternative you can also use a QR Code:
The GUIDs for individual cells are displayed in the table below:
| Maximum Density Values | | Kernel | x-value | max. density | | Gaussian | 93.7377690802348 | 0.0121157807477659 | | Epanechnikov | 94.9510763209393 | 0.0106539400813084 | | Rectangular | 78.5714285714286 | 0.0094967201141213 | | Triangular | 90.0978473581213 | 0.0118292973437474 | | Biweight | 94.9510763209393 | 0.0111023460714745 | | Cosine | 94.9510763209393 | 0.0112645241879143 | | Optcosine | 94.9510763209393 | 0.0108008702437607 |
If you paste this QR Code into your document, anyone with a smartphone or tablet will be able to scan it and view this table in a browser.
If you paste this QR Code into your document, anyone with a smartphone or tablet will be able to scan it and view this table in a browser.
If you paste this QR Code into your document, anyone with a smartphone or tablet will be able to scan it and view this table in a browser.
If you paste this QR Code into your document, anyone with a smartphone or tablet will be able to scan it and view this table in a browser.
If you paste this QR Code into your document, anyone with a smartphone or tablet will be able to scan it and view this table in a browser.
| Maximum Density Values | | Kernel | x-value | max. density | | Gaussian | 93.7377690802348 | 0.0121157807477659 | | Epanechnikov | 94.9510763209393 | 0.0106539400813084 | | Rectangular | 79.1780821917808 | 0.0094967201141213 | | Triangular | 90.0978473581213 | 0.0118292973437474 | | Biweight | 94.9510763209393 | 0.0111023460714745 | | Cosine | 94.9510763209393 | 0.0112645241879143 | | Optcosine | 94.9510763209393 | 0.0108008702437607 |
\begin{tabular}{lllllllll}
\hline
Maximum Density Values \tabularnewline
Kernel & x-value & max. density \tabularnewline
Gaussian & 93.7377690802348 & 0.0121157807477659 \tabularnewline
Epanechnikov & 94.9510763209393 & 0.0106539400813084 \tabularnewline
Rectangular & 79.1780821917808 & 0.0094967201141213 \tabularnewline
Triangular & 90.0978473581213 & 0.0118292973437474 \tabularnewline
Biweight & 94.9510763209393 & 0.0111023460714745 \tabularnewline
Cosine & 94.9510763209393 & 0.0112645241879143 \tabularnewline
Optcosine & 94.9510763209393 & 0.0108008702437607 \tabularnewline
 \hline
\end{tabular}
%Source: https://freestatistics.org/blog/index.php?pk=232509&T=13
[TABLE]
[ROW][C]Maximum Density Values[/C][/ROW]
[ROW][C]Kernel[/C][C]x-value[/C][C]max. density[/C][/ROW]
[ROW][C]Gaussian[/C][C]93.7377690802348[/C][C]0.0121157807477659[/C][/ROW]
[ROW][C]Epanechnikov[/C][C]94.9510763209393[/C][C]0.0106539400813084[/C][/ROW]
[ROW][C]Rectangular[/C][C]79.1780821917808[/C][C]0.0094967201141213[/C][/ROW]
[ROW][C]Triangular[/C][C]90.0978473581213[/C][C]0.0118292973437474[/C][/ROW]
[ROW][C]Biweight[/C][C]94.9510763209393[/C][C]0.0111023460714745[/C][/ROW]
[ROW][C]Cosine[/C][C]94.9510763209393[/C][C]0.0112645241879143[/C][/ROW]
[ROW][C]Optcosine[/C][C]94.9510763209393[/C][C]0.0108008702437607[/C][/ROW]
 [/TABLE]
Source: https://freestatistics.org/blog/index.php?pk=232509&T=13
Globally Unique Identifier (entire table): ba.freestatistics.org/blog/index.php?pk=232509&T=13
As an alternative you can also use a QR Code:
The GUIDs for individual cells are displayed in the table below:
| Maximum Density Values | | Kernel | x-value | max. density | | Gaussian | 93.7377690802348 | 0.0121157807477659 | | Epanechnikov | 94.9510763209393 | 0.0106539400813084 | | Rectangular | 79.1780821917808 | 0.0094967201141213 | | Triangular | 90.0978473581213 | 0.0118292973437474 | | Biweight | 94.9510763209393 | 0.0111023460714745 | | Cosine | 94.9510763209393 | 0.0112645241879143 | | Optcosine | 94.9510763209393 | 0.0108008702437607 |
If you paste this QR Code into your document, anyone with a smartphone or tablet will be able to scan it and view this table in a browser.
If you paste this QR Code into your document, anyone with a smartphone or tablet will be able to scan it and view this table in a browser.
If you paste this QR Code into your document, anyone with a smartphone or tablet will be able to scan it and view this table in a browser.
If you paste this QR Code into your document, anyone with a smartphone or tablet will be able to scan it and view this table in a browser.
If you paste this QR Code into your document, anyone with a smartphone or tablet will be able to scan it and view this table in a browser.
| Maximum Density Values | | Kernel | x-value | max. density | | Gaussian | 93.7377690802348 | 0.0121157807477659 | | Epanechnikov | 94.9510763209393 | 0.0106539400813084 | | Rectangular | 79.7847358121331 | 0.0094967201141213 | | Triangular | 90.0978473581213 | 0.0118292973437474 | | Biweight | 94.9510763209393 | 0.0111023460714745 | | Cosine | 94.9510763209393 | 0.0112645241879143 | | Optcosine | 94.9510763209393 | 0.0108008702437607 |
\begin{tabular}{lllllllll}
\hline
Maximum Density Values \tabularnewline
Kernel & x-value & max. density \tabularnewline
Gaussian & 93.7377690802348 & 0.0121157807477659 \tabularnewline
Epanechnikov & 94.9510763209393 & 0.0106539400813084 \tabularnewline
Rectangular & 79.7847358121331 & 0.0094967201141213 \tabularnewline
Triangular & 90.0978473581213 & 0.0118292973437474 \tabularnewline
Biweight & 94.9510763209393 & 0.0111023460714745 \tabularnewline
Cosine & 94.9510763209393 & 0.0112645241879143 \tabularnewline
Optcosine & 94.9510763209393 & 0.0108008702437607 \tabularnewline
 \hline
\end{tabular}
%Source: https://freestatistics.org/blog/index.php?pk=232509&T=14
[TABLE]
[ROW][C]Maximum Density Values[/C][/ROW]
[ROW][C]Kernel[/C][C]x-value[/C][C]max. density[/C][/ROW]
[ROW][C]Gaussian[/C][C]93.7377690802348[/C][C]0.0121157807477659[/C][/ROW]
[ROW][C]Epanechnikov[/C][C]94.9510763209393[/C][C]0.0106539400813084[/C][/ROW]
[ROW][C]Rectangular[/C][C]79.7847358121331[/C][C]0.0094967201141213[/C][/ROW]
[ROW][C]Triangular[/C][C]90.0978473581213[/C][C]0.0118292973437474[/C][/ROW]
[ROW][C]Biweight[/C][C]94.9510763209393[/C][C]0.0111023460714745[/C][/ROW]
[ROW][C]Cosine[/C][C]94.9510763209393[/C][C]0.0112645241879143[/C][/ROW]
[ROW][C]Optcosine[/C][C]94.9510763209393[/C][C]0.0108008702437607[/C][/ROW]
 [/TABLE]
Source: https://freestatistics.org/blog/index.php?pk=232509&T=14
Globally Unique Identifier (entire table): ba.freestatistics.org/blog/index.php?pk=232509&T=14
As an alternative you can also use a QR Code:
The GUIDs for individual cells are displayed in the table below:
| Maximum Density Values | | Kernel | x-value | max. density | | Gaussian | 93.7377690802348 | 0.0121157807477659 | | Epanechnikov | 94.9510763209393 | 0.0106539400813084 | | Rectangular | 79.7847358121331 | 0.0094967201141213 | | Triangular | 90.0978473581213 | 0.0118292973437474 | | Biweight | 94.9510763209393 | 0.0111023460714745 | | Cosine | 94.9510763209393 | 0.0112645241879143 | | Optcosine | 94.9510763209393 | 0.0108008702437607 |
If you paste this QR Code into your document, anyone with a smartphone or tablet will be able to scan it and view this table in a browser.
If you paste this QR Code into your document, anyone with a smartphone or tablet will be able to scan it and view this table in a browser.
If you paste this QR Code into your document, anyone with a smartphone or tablet will be able to scan it and view this table in a browser.
If you paste this QR Code into your document, anyone with a smartphone or tablet will be able to scan it and view this table in a browser.
If you paste this QR Code into your document, anyone with a smartphone or tablet will be able to scan it and view this table in a browser.
| Maximum Density Values | | Kernel | x-value | max. density | | Gaussian | 93.7377690802348 | 0.0121157807477659 | | Epanechnikov | 94.9510763209393 | 0.0106539400813084 | | Rectangular | 80.3913894324853 | 0.0094967201141213 | | Triangular | 90.0978473581213 | 0.0118292973437474 | | Biweight | 94.9510763209393 | 0.0111023460714745 | | Cosine | 94.9510763209393 | 0.0112645241879143 | | Optcosine | 94.9510763209393 | 0.0108008702437607 |
\begin{tabular}{lllllllll}
\hline
Maximum Density Values \tabularnewline
Kernel & x-value & max. density \tabularnewline
Gaussian & 93.7377690802348 & 0.0121157807477659 \tabularnewline
Epanechnikov & 94.9510763209393 & 0.0106539400813084 \tabularnewline
Rectangular & 80.3913894324853 & 0.0094967201141213 \tabularnewline
Triangular & 90.0978473581213 & 0.0118292973437474 \tabularnewline
Biweight & 94.9510763209393 & 0.0111023460714745 \tabularnewline
Cosine & 94.9510763209393 & 0.0112645241879143 \tabularnewline
Optcosine & 94.9510763209393 & 0.0108008702437607 \tabularnewline
 \hline
\end{tabular}
%Source: https://freestatistics.org/blog/index.php?pk=232509&T=15
[TABLE]
[ROW][C]Maximum Density Values[/C][/ROW]
[ROW][C]Kernel[/C][C]x-value[/C][C]max. density[/C][/ROW]
[ROW][C]Gaussian[/C][C]93.7377690802348[/C][C]0.0121157807477659[/C][/ROW]
[ROW][C]Epanechnikov[/C][C]94.9510763209393[/C][C]0.0106539400813084[/C][/ROW]
[ROW][C]Rectangular[/C][C]80.3913894324853[/C][C]0.0094967201141213[/C][/ROW]
[ROW][C]Triangular[/C][C]90.0978473581213[/C][C]0.0118292973437474[/C][/ROW]
[ROW][C]Biweight[/C][C]94.9510763209393[/C][C]0.0111023460714745[/C][/ROW]
[ROW][C]Cosine[/C][C]94.9510763209393[/C][C]0.0112645241879143[/C][/ROW]
[ROW][C]Optcosine[/C][C]94.9510763209393[/C][C]0.0108008702437607[/C][/ROW]
 [/TABLE]
Source: https://freestatistics.org/blog/index.php?pk=232509&T=15
Globally Unique Identifier (entire table): ba.freestatistics.org/blog/index.php?pk=232509&T=15
As an alternative you can also use a QR Code:
The GUIDs for individual cells are displayed in the table below:
| Maximum Density Values | | Kernel | x-value | max. density | | Gaussian | 93.7377690802348 | 0.0121157807477659 | | Epanechnikov | 94.9510763209393 | 0.0106539400813084 | | Rectangular | 80.3913894324853 | 0.0094967201141213 | | Triangular | 90.0978473581213 | 0.0118292973437474 | | Biweight | 94.9510763209393 | 0.0111023460714745 | | Cosine | 94.9510763209393 | 0.0112645241879143 | | Optcosine | 94.9510763209393 | 0.0108008702437607 |
If you paste this QR Code into your document, anyone with a smartphone or tablet will be able to scan it and view this table in a browser.
If you paste this QR Code into your document, anyone with a smartphone or tablet will be able to scan it and view this table in a browser.
If you paste this QR Code into your document, anyone with a smartphone or tablet will be able to scan it and view this table in a browser.
If you paste this QR Code into your document, anyone with a smartphone or tablet will be able to scan it and view this table in a browser.
If you paste this QR Code into your document, anyone with a smartphone or tablet will be able to scan it and view this table in a browser.
| Maximum Density Values | | Kernel | x-value | max. density | | Gaussian | 93.7377690802348 | 0.0121157807477659 | | Epanechnikov | 94.9510763209393 | 0.0106539400813084 | | Rectangular | 80.9980430528376 | 0.0094967201141213 | | Triangular | 90.0978473581213 | 0.0118292973437474 | | Biweight | 94.9510763209393 | 0.0111023460714745 | | Cosine | 94.9510763209393 | 0.0112645241879143 | | Optcosine | 94.9510763209393 | 0.0108008702437607 |
\begin{tabular}{lllllllll}
\hline
Maximum Density Values \tabularnewline
Kernel & x-value & max. density \tabularnewline
Gaussian & 93.7377690802348 & 0.0121157807477659 \tabularnewline
Epanechnikov & 94.9510763209393 & 0.0106539400813084 \tabularnewline
Rectangular & 80.9980430528376 & 0.0094967201141213 \tabularnewline
Triangular & 90.0978473581213 & 0.0118292973437474 \tabularnewline
Biweight & 94.9510763209393 & 0.0111023460714745 \tabularnewline
Cosine & 94.9510763209393 & 0.0112645241879143 \tabularnewline
Optcosine & 94.9510763209393 & 0.0108008702437607 \tabularnewline
 \hline
\end{tabular}
%Source: https://freestatistics.org/blog/index.php?pk=232509&T=16
[TABLE]
[ROW][C]Maximum Density Values[/C][/ROW]
[ROW][C]Kernel[/C][C]x-value[/C][C]max. density[/C][/ROW]
[ROW][C]Gaussian[/C][C]93.7377690802348[/C][C]0.0121157807477659[/C][/ROW]
[ROW][C]Epanechnikov[/C][C]94.9510763209393[/C][C]0.0106539400813084[/C][/ROW]
[ROW][C]Rectangular[/C][C]80.9980430528376[/C][C]0.0094967201141213[/C][/ROW]
[ROW][C]Triangular[/C][C]90.0978473581213[/C][C]0.0118292973437474[/C][/ROW]
[ROW][C]Biweight[/C][C]94.9510763209393[/C][C]0.0111023460714745[/C][/ROW]
[ROW][C]Cosine[/C][C]94.9510763209393[/C][C]0.0112645241879143[/C][/ROW]
[ROW][C]Optcosine[/C][C]94.9510763209393[/C][C]0.0108008702437607[/C][/ROW]
 [/TABLE]
Source: https://freestatistics.org/blog/index.php?pk=232509&T=16
Globally Unique Identifier (entire table): ba.freestatistics.org/blog/index.php?pk=232509&T=16
As an alternative you can also use a QR Code:
The GUIDs for individual cells are displayed in the table below:
| Maximum Density Values | | Kernel | x-value | max. density | | Gaussian | 93.7377690802348 | 0.0121157807477659 | | Epanechnikov | 94.9510763209393 | 0.0106539400813084 | | Rectangular | 80.9980430528376 | 0.0094967201141213 | | Triangular | 90.0978473581213 | 0.0118292973437474 | | Biweight | 94.9510763209393 | 0.0111023460714745 | | Cosine | 94.9510763209393 | 0.0112645241879143 | | Optcosine | 94.9510763209393 | 0.0108008702437607 |
If you paste this QR Code into your document, anyone with a smartphone or tablet will be able to scan it and view this table in a browser.
If you paste this QR Code into your document, anyone with a smartphone or tablet will be able to scan it and view this table in a browser.
If you paste this QR Code into your document, anyone with a smartphone or tablet will be able to scan it and view this table in a browser.
If you paste this QR Code into your document, anyone with a smartphone or tablet will be able to scan it and view this table in a browser.
If you paste this QR Code into your document, anyone with a smartphone or tablet will be able to scan it and view this table in a browser.
| Maximum Density Values | | Kernel | x-value | max. density | | Gaussian | 93.7377690802348 | 0.0121157807477659 | | Epanechnikov | 94.9510763209393 | 0.0106539400813084 | | Rectangular | 81.6046966731898 | 0.0094967201141213 | | Triangular | 90.0978473581213 | 0.0118292973437474 | | Biweight | 94.9510763209393 | 0.0111023460714745 | | Cosine | 94.9510763209393 | 0.0112645241879143 | | Optcosine | 94.9510763209393 | 0.0108008702437607 |
\begin{tabular}{lllllllll}
\hline
Maximum Density Values \tabularnewline
Kernel & x-value & max. density \tabularnewline
Gaussian & 93.7377690802348 & 0.0121157807477659 \tabularnewline
Epanechnikov & 94.9510763209393 & 0.0106539400813084 \tabularnewline
Rectangular & 81.6046966731898 & 0.0094967201141213 \tabularnewline
Triangular & 90.0978473581213 & 0.0118292973437474 \tabularnewline
Biweight & 94.9510763209393 & 0.0111023460714745 \tabularnewline
Cosine & 94.9510763209393 & 0.0112645241879143 \tabularnewline
Optcosine & 94.9510763209393 & 0.0108008702437607 \tabularnewline
 \hline
\end{tabular}
%Source: https://freestatistics.org/blog/index.php?pk=232509&T=17
[TABLE]
[ROW][C]Maximum Density Values[/C][/ROW]
[ROW][C]Kernel[/C][C]x-value[/C][C]max. density[/C][/ROW]
[ROW][C]Gaussian[/C][C]93.7377690802348[/C][C]0.0121157807477659[/C][/ROW]
[ROW][C]Epanechnikov[/C][C]94.9510763209393[/C][C]0.0106539400813084[/C][/ROW]
[ROW][C]Rectangular[/C][C]81.6046966731898[/C][C]0.0094967201141213[/C][/ROW]
[ROW][C]Triangular[/C][C]90.0978473581213[/C][C]0.0118292973437474[/C][/ROW]
[ROW][C]Biweight[/C][C]94.9510763209393[/C][C]0.0111023460714745[/C][/ROW]
[ROW][C]Cosine[/C][C]94.9510763209393[/C][C]0.0112645241879143[/C][/ROW]
[ROW][C]Optcosine[/C][C]94.9510763209393[/C][C]0.0108008702437607[/C][/ROW]
 [/TABLE]
Source: https://freestatistics.org/blog/index.php?pk=232509&T=17
Globally Unique Identifier (entire table): ba.freestatistics.org/blog/index.php?pk=232509&T=17
As an alternative you can also use a QR Code:
The GUIDs for individual cells are displayed in the table below:
| Maximum Density Values | | Kernel | x-value | max. density | | Gaussian | 93.7377690802348 | 0.0121157807477659 | | Epanechnikov | 94.9510763209393 | 0.0106539400813084 | | Rectangular | 81.6046966731898 | 0.0094967201141213 | | Triangular | 90.0978473581213 | 0.0118292973437474 | | Biweight | 94.9510763209393 | 0.0111023460714745 | | Cosine | 94.9510763209393 | 0.0112645241879143 | | Optcosine | 94.9510763209393 | 0.0108008702437607 |
If you paste this QR Code into your document, anyone with a smartphone or tablet will be able to scan it and view this table in a browser.
If you paste this QR Code into your document, anyone with a smartphone or tablet will be able to scan it and view this table in a browser.
If you paste this QR Code into your document, anyone with a smartphone or tablet will be able to scan it and view this table in a browser.
If you paste this QR Code into your document, anyone with a smartphone or tablet will be able to scan it and view this table in a browser.
If you paste this QR Code into your document, anyone with a smartphone or tablet will be able to scan it and view this table in a browser.
| Maximum Density Values | | Kernel | x-value | max. density | | Gaussian | 93.7377690802348 | 0.0121157807477659 | | Epanechnikov | 94.9510763209393 | 0.0106539400813084 | | Rectangular | 82.2113502935421 | 0.0094967201141213 | | Triangular | 90.0978473581213 | 0.0118292973437474 | | Biweight | 94.9510763209393 | 0.0111023460714745 | | Cosine | 94.9510763209393 | 0.0112645241879143 | | Optcosine | 94.9510763209393 | 0.0108008702437607 |
\begin{tabular}{lllllllll}
\hline
Maximum Density Values \tabularnewline
Kernel & x-value & max. density \tabularnewline
Gaussian & 93.7377690802348 & 0.0121157807477659 \tabularnewline
Epanechnikov & 94.9510763209393 & 0.0106539400813084 \tabularnewline
Rectangular & 82.2113502935421 & 0.0094967201141213 \tabularnewline
Triangular & 90.0978473581213 & 0.0118292973437474 \tabularnewline
Biweight & 94.9510763209393 & 0.0111023460714745 \tabularnewline
Cosine & 94.9510763209393 & 0.0112645241879143 \tabularnewline
Optcosine & 94.9510763209393 & 0.0108008702437607 \tabularnewline
 \hline
\end{tabular}
%Source: https://freestatistics.org/blog/index.php?pk=232509&T=18
[TABLE]
[ROW][C]Maximum Density Values[/C][/ROW]
[ROW][C]Kernel[/C][C]x-value[/C][C]max. density[/C][/ROW]
[ROW][C]Gaussian[/C][C]93.7377690802348[/C][C]0.0121157807477659[/C][/ROW]
[ROW][C]Epanechnikov[/C][C]94.9510763209393[/C][C]0.0106539400813084[/C][/ROW]
[ROW][C]Rectangular[/C][C]82.2113502935421[/C][C]0.0094967201141213[/C][/ROW]
[ROW][C]Triangular[/C][C]90.0978473581213[/C][C]0.0118292973437474[/C][/ROW]
[ROW][C]Biweight[/C][C]94.9510763209393[/C][C]0.0111023460714745[/C][/ROW]
[ROW][C]Cosine[/C][C]94.9510763209393[/C][C]0.0112645241879143[/C][/ROW]
[ROW][C]Optcosine[/C][C]94.9510763209393[/C][C]0.0108008702437607[/C][/ROW]
 [/TABLE]
Source: https://freestatistics.org/blog/index.php?pk=232509&T=18
Globally Unique Identifier (entire table): ba.freestatistics.org/blog/index.php?pk=232509&T=18
As an alternative you can also use a QR Code:
The GUIDs for individual cells are displayed in the table below:
| Maximum Density Values | | Kernel | x-value | max. density | | Gaussian | 93.7377690802348 | 0.0121157807477659 | | Epanechnikov | 94.9510763209393 | 0.0106539400813084 | | Rectangular | 82.2113502935421 | 0.0094967201141213 | | Triangular | 90.0978473581213 | 0.0118292973437474 | | Biweight | 94.9510763209393 | 0.0111023460714745 | | Cosine | 94.9510763209393 | 0.0112645241879143 | | Optcosine | 94.9510763209393 | 0.0108008702437607 |
If you paste this QR Code into your document, anyone with a smartphone or tablet will be able to scan it and view this table in a browser.
If you paste this QR Code into your document, anyone with a smartphone or tablet will be able to scan it and view this table in a browser.
If you paste this QR Code into your document, anyone with a smartphone or tablet will be able to scan it and view this table in a browser.
If you paste this QR Code into your document, anyone with a smartphone or tablet will be able to scan it and view this table in a browser.
If you paste this QR Code into your document, anyone with a smartphone or tablet will be able to scan it and view this table in a browser.
| Maximum Density Values | | Kernel | x-value | max. density | | Gaussian | 93.7377690802348 | 0.0121157807477659 | | Epanechnikov | 94.9510763209393 | 0.0106539400813084 | | Rectangular | 82.8180039138943 | 0.0094967201141213 | | Triangular | 90.0978473581213 | 0.0118292973437474 | | Biweight | 94.9510763209393 | 0.0111023460714745 | | Cosine | 94.9510763209393 | 0.0112645241879143 | | Optcosine | 94.9510763209393 | 0.0108008702437607 |
\begin{tabular}{lllllllll}
\hline
Maximum Density Values \tabularnewline
Kernel & x-value & max. density \tabularnewline
Gaussian & 93.7377690802348 & 0.0121157807477659 \tabularnewline
Epanechnikov & 94.9510763209393 & 0.0106539400813084 \tabularnewline
Rectangular & 82.8180039138943 & 0.0094967201141213 \tabularnewline
Triangular & 90.0978473581213 & 0.0118292973437474 \tabularnewline
Biweight & 94.9510763209393 & 0.0111023460714745 \tabularnewline
Cosine & 94.9510763209393 & 0.0112645241879143 \tabularnewline
Optcosine & 94.9510763209393 & 0.0108008702437607 \tabularnewline
 \hline
\end{tabular}
%Source: https://freestatistics.org/blog/index.php?pk=232509&T=19
[TABLE]
[ROW][C]Maximum Density Values[/C][/ROW]
[ROW][C]Kernel[/C][C]x-value[/C][C]max. density[/C][/ROW]
[ROW][C]Gaussian[/C][C]93.7377690802348[/C][C]0.0121157807477659[/C][/ROW]
[ROW][C]Epanechnikov[/C][C]94.9510763209393[/C][C]0.0106539400813084[/C][/ROW]
[ROW][C]Rectangular[/C][C]82.8180039138943[/C][C]0.0094967201141213[/C][/ROW]
[ROW][C]Triangular[/C][C]90.0978473581213[/C][C]0.0118292973437474[/C][/ROW]
[ROW][C]Biweight[/C][C]94.9510763209393[/C][C]0.0111023460714745[/C][/ROW]
[ROW][C]Cosine[/C][C]94.9510763209393[/C][C]0.0112645241879143[/C][/ROW]
[ROW][C]Optcosine[/C][C]94.9510763209393[/C][C]0.0108008702437607[/C][/ROW]
 [/TABLE]
Source: https://freestatistics.org/blog/index.php?pk=232509&T=19
Globally Unique Identifier (entire table): ba.freestatistics.org/blog/index.php?pk=232509&T=19
As an alternative you can also use a QR Code:
The GUIDs for individual cells are displayed in the table below:
| Maximum Density Values | | Kernel | x-value | max. density | | Gaussian | 93.7377690802348 | 0.0121157807477659 | | Epanechnikov | 94.9510763209393 | 0.0106539400813084 | | Rectangular | 82.8180039138943 | 0.0094967201141213 | | Triangular | 90.0978473581213 | 0.0118292973437474 | | Biweight | 94.9510763209393 | 0.0111023460714745 | | Cosine | 94.9510763209393 | 0.0112645241879143 | | Optcosine | 94.9510763209393 | 0.0108008702437607 |
If you paste this QR Code into your document, anyone with a smartphone or tablet will be able to scan it and view this table in a browser.
If you paste this QR Code into your document, anyone with a smartphone or tablet will be able to scan it and view this table in a browser.
If you paste this QR Code into your document, anyone with a smartphone or tablet will be able to scan it and view this table in a browser.
If you paste this QR Code into your document, anyone with a smartphone or tablet will be able to scan it and view this table in a browser.
If you paste this QR Code into your document, anyone with a smartphone or tablet will be able to scan it and view this table in a browser.
| Maximum Density Values | | Kernel | x-value | max. density | | Gaussian | 93.7377690802348 | 0.0121157807477659 | | Epanechnikov | 94.9510763209393 | 0.0106539400813084 | | Rectangular | 83.4246575342466 | 0.0094967201141213 | | Triangular | 90.0978473581213 | 0.0118292973437474 | | Biweight | 94.9510763209393 | 0.0111023460714745 | | Cosine | 94.9510763209393 | 0.0112645241879143 | | Optcosine | 94.9510763209393 | 0.0108008702437607 |
\begin{tabular}{lllllllll}
\hline
Maximum Density Values \tabularnewline
Kernel & x-value & max. density \tabularnewline
Gaussian & 93.7377690802348 & 0.0121157807477659 \tabularnewline
Epanechnikov & 94.9510763209393 & 0.0106539400813084 \tabularnewline
Rectangular & 83.4246575342466 & 0.0094967201141213 \tabularnewline
Triangular & 90.0978473581213 & 0.0118292973437474 \tabularnewline
Biweight & 94.9510763209393 & 0.0111023460714745 \tabularnewline
Cosine & 94.9510763209393 & 0.0112645241879143 \tabularnewline
Optcosine & 94.9510763209393 & 0.0108008702437607 \tabularnewline
 \hline
\end{tabular}
%Source: https://freestatistics.org/blog/index.php?pk=232509&T=20
[TABLE]
[ROW][C]Maximum Density Values[/C][/ROW]
[ROW][C]Kernel[/C][C]x-value[/C][C]max. density[/C][/ROW]
[ROW][C]Gaussian[/C][C]93.7377690802348[/C][C]0.0121157807477659[/C][/ROW]
[ROW][C]Epanechnikov[/C][C]94.9510763209393[/C][C]0.0106539400813084[/C][/ROW]
[ROW][C]Rectangular[/C][C]83.4246575342466[/C][C]0.0094967201141213[/C][/ROW]
[ROW][C]Triangular[/C][C]90.0978473581213[/C][C]0.0118292973437474[/C][/ROW]
[ROW][C]Biweight[/C][C]94.9510763209393[/C][C]0.0111023460714745[/C][/ROW]
[ROW][C]Cosine[/C][C]94.9510763209393[/C][C]0.0112645241879143[/C][/ROW]
[ROW][C]Optcosine[/C][C]94.9510763209393[/C][C]0.0108008702437607[/C][/ROW]
 [/TABLE]
Source: https://freestatistics.org/blog/index.php?pk=232509&T=20
Globally Unique Identifier (entire table): ba.freestatistics.org/blog/index.php?pk=232509&T=20
As an alternative you can also use a QR Code:
The GUIDs for individual cells are displayed in the table below:
| Maximum Density Values | | Kernel | x-value | max. density | | Gaussian | 93.7377690802348 | 0.0121157807477659 | | Epanechnikov | 94.9510763209393 | 0.0106539400813084 | | Rectangular | 83.4246575342466 | 0.0094967201141213 | | Triangular | 90.0978473581213 | 0.0118292973437474 | | Biweight | 94.9510763209393 | 0.0111023460714745 | | Cosine | 94.9510763209393 | 0.0112645241879143 | | Optcosine | 94.9510763209393 | 0.0108008702437607 |
If you paste this QR Code into your document, anyone with a smartphone or tablet will be able to scan it and view this table in a browser.
If you paste this QR Code into your document, anyone with a smartphone or tablet will be able to scan it and view this table in a browser.
If you paste this QR Code into your document, anyone with a smartphone or tablet will be able to scan it and view this table in a browser.
If you paste this QR Code into your document, anyone with a smartphone or tablet will be able to scan it and view this table in a browser.
If you paste this QR Code into your document, anyone with a smartphone or tablet will be able to scan it and view this table in a browser.
| Maximum Density Values | | Kernel | x-value | max. density | | Gaussian | 93.7377690802348 | 0.0121157807477659 | | Epanechnikov | 94.9510763209393 | 0.0106539400813084 | | Rectangular | 84.0313111545988 | 0.0094967201141213 | | Triangular | 90.0978473581213 | 0.0118292973437474 | | Biweight | 94.9510763209393 | 0.0111023460714745 | | Cosine | 94.9510763209393 | 0.0112645241879143 | | Optcosine | 94.9510763209393 | 0.0108008702437607 |
\begin{tabular}{lllllllll}
\hline
Maximum Density Values \tabularnewline
Kernel & x-value & max. density \tabularnewline
Gaussian & 93.7377690802348 & 0.0121157807477659 \tabularnewline
Epanechnikov & 94.9510763209393 & 0.0106539400813084 \tabularnewline
Rectangular & 84.0313111545988 & 0.0094967201141213 \tabularnewline
Triangular & 90.0978473581213 & 0.0118292973437474 \tabularnewline
Biweight & 94.9510763209393 & 0.0111023460714745 \tabularnewline
Cosine & 94.9510763209393 & 0.0112645241879143 \tabularnewline
Optcosine & 94.9510763209393 & 0.0108008702437607 \tabularnewline
 \hline
\end{tabular}
%Source: https://freestatistics.org/blog/index.php?pk=232509&T=21
[TABLE]
[ROW][C]Maximum Density Values[/C][/ROW]
[ROW][C]Kernel[/C][C]x-value[/C][C]max. density[/C][/ROW]
[ROW][C]Gaussian[/C][C]93.7377690802348[/C][C]0.0121157807477659[/C][/ROW]
[ROW][C]Epanechnikov[/C][C]94.9510763209393[/C][C]0.0106539400813084[/C][/ROW]
[ROW][C]Rectangular[/C][C]84.0313111545988[/C][C]0.0094967201141213[/C][/ROW]
[ROW][C]Triangular[/C][C]90.0978473581213[/C][C]0.0118292973437474[/C][/ROW]
[ROW][C]Biweight[/C][C]94.9510763209393[/C][C]0.0111023460714745[/C][/ROW]
[ROW][C]Cosine[/C][C]94.9510763209393[/C][C]0.0112645241879143[/C][/ROW]
[ROW][C]Optcosine[/C][C]94.9510763209393[/C][C]0.0108008702437607[/C][/ROW]
 [/TABLE]
Source: https://freestatistics.org/blog/index.php?pk=232509&T=21
Globally Unique Identifier (entire table): ba.freestatistics.org/blog/index.php?pk=232509&T=21
As an alternative you can also use a QR Code:
The GUIDs for individual cells are displayed in the table below:
| Maximum Density Values | | Kernel | x-value | max. density | | Gaussian | 93.7377690802348 | 0.0121157807477659 | | Epanechnikov | 94.9510763209393 | 0.0106539400813084 | | Rectangular | 84.0313111545988 | 0.0094967201141213 | | Triangular | 90.0978473581213 | 0.0118292973437474 | | Biweight | 94.9510763209393 | 0.0111023460714745 | | Cosine | 94.9510763209393 | 0.0112645241879143 | | Optcosine | 94.9510763209393 | 0.0108008702437607 |
If you paste this QR Code into your document, anyone with a smartphone or tablet will be able to scan it and view this table in a browser.
If you paste this QR Code into your document, anyone with a smartphone or tablet will be able to scan it and view this table in a browser.
If you paste this QR Code into your document, anyone with a smartphone or tablet will be able to scan it and view this table in a browser.
If you paste this QR Code into your document, anyone with a smartphone or tablet will be able to scan it and view this table in a browser.
If you paste this QR Code into your document, anyone with a smartphone or tablet will be able to scan it and view this table in a browser.
| Maximum Density Values | | Kernel | x-value | max. density | | Gaussian | 93.7377690802348 | 0.0121157807477659 | | Epanechnikov | 94.9510763209393 | 0.0106539400813084 | | Rectangular | 84.6379647749511 | 0.0094967201141213 | | Triangular | 90.0978473581213 | 0.0118292973437474 | | Biweight | 94.9510763209393 | 0.0111023460714745 | | Cosine | 94.9510763209393 | 0.0112645241879143 | | Optcosine | 94.9510763209393 | 0.0108008702437607 |
\begin{tabular}{lllllllll}
\hline
Maximum Density Values \tabularnewline
Kernel & x-value & max. density \tabularnewline
Gaussian & 93.7377690802348 & 0.0121157807477659 \tabularnewline
Epanechnikov & 94.9510763209393 & 0.0106539400813084 \tabularnewline
Rectangular & 84.6379647749511 & 0.0094967201141213 \tabularnewline
Triangular & 90.0978473581213 & 0.0118292973437474 \tabularnewline
Biweight & 94.9510763209393 & 0.0111023460714745 \tabularnewline
Cosine & 94.9510763209393 & 0.0112645241879143 \tabularnewline
Optcosine & 94.9510763209393 & 0.0108008702437607 \tabularnewline
 \hline
\end{tabular}
%Source: https://freestatistics.org/blog/index.php?pk=232509&T=22
[TABLE]
[ROW][C]Maximum Density Values[/C][/ROW]
[ROW][C]Kernel[/C][C]x-value[/C][C]max. density[/C][/ROW]
[ROW][C]Gaussian[/C][C]93.7377690802348[/C][C]0.0121157807477659[/C][/ROW]
[ROW][C]Epanechnikov[/C][C]94.9510763209393[/C][C]0.0106539400813084[/C][/ROW]
[ROW][C]Rectangular[/C][C]84.6379647749511[/C][C]0.0094967201141213[/C][/ROW]
[ROW][C]Triangular[/C][C]90.0978473581213[/C][C]0.0118292973437474[/C][/ROW]
[ROW][C]Biweight[/C][C]94.9510763209393[/C][C]0.0111023460714745[/C][/ROW]
[ROW][C]Cosine[/C][C]94.9510763209393[/C][C]0.0112645241879143[/C][/ROW]
[ROW][C]Optcosine[/C][C]94.9510763209393[/C][C]0.0108008702437607[/C][/ROW]
 [/TABLE]
Source: https://freestatistics.org/blog/index.php?pk=232509&T=22
Globally Unique Identifier (entire table): ba.freestatistics.org/blog/index.php?pk=232509&T=22
As an alternative you can also use a QR Code:
The GUIDs for individual cells are displayed in the table below:
| Maximum Density Values | | Kernel | x-value | max. density | | Gaussian | 93.7377690802348 | 0.0121157807477659 | | Epanechnikov | 94.9510763209393 | 0.0106539400813084 | | Rectangular | 84.6379647749511 | 0.0094967201141213 | | Triangular | 90.0978473581213 | 0.0118292973437474 | | Biweight | 94.9510763209393 | 0.0111023460714745 | | Cosine | 94.9510763209393 | 0.0112645241879143 | | Optcosine | 94.9510763209393 | 0.0108008702437607 |
If you paste this QR Code into your document, anyone with a smartphone or tablet will be able to scan it and view this table in a browser.
If you paste this QR Code into your document, anyone with a smartphone or tablet will be able to scan it and view this table in a browser.
If you paste this QR Code into your document, anyone with a smartphone or tablet will be able to scan it and view this table in a browser.
If you paste this QR Code into your document, anyone with a smartphone or tablet will be able to scan it and view this table in a browser.
If you paste this QR Code into your document, anyone with a smartphone or tablet will be able to scan it and view this table in a browser.
| Maximum Density Values | | Kernel | x-value | max. density | | Gaussian | 93.7377690802348 | 0.0121157807477659 | | Epanechnikov | 94.9510763209393 | 0.0106539400813084 | | Rectangular | 85.8512720156556 | 0.0094967201141213 | | Triangular | 90.0978473581213 | 0.0118292973437474 | | Biweight | 94.9510763209393 | 0.0111023460714745 | | Cosine | 94.9510763209393 | 0.0112645241879143 | | Optcosine | 94.9510763209393 | 0.0108008702437607 |
\begin{tabular}{lllllllll}
\hline
Maximum Density Values \tabularnewline
Kernel & x-value & max. density \tabularnewline
Gaussian & 93.7377690802348 & 0.0121157807477659 \tabularnewline
Epanechnikov & 94.9510763209393 & 0.0106539400813084 \tabularnewline
Rectangular & 85.8512720156556 & 0.0094967201141213 \tabularnewline
Triangular & 90.0978473581213 & 0.0118292973437474 \tabularnewline
Biweight & 94.9510763209393 & 0.0111023460714745 \tabularnewline
Cosine & 94.9510763209393 & 0.0112645241879143 \tabularnewline
Optcosine & 94.9510763209393 & 0.0108008702437607 \tabularnewline
 \hline
\end{tabular}
%Source: https://freestatistics.org/blog/index.php?pk=232509&T=23
[TABLE]
[ROW][C]Maximum Density Values[/C][/ROW]
[ROW][C]Kernel[/C][C]x-value[/C][C]max. density[/C][/ROW]
[ROW][C]Gaussian[/C][C]93.7377690802348[/C][C]0.0121157807477659[/C][/ROW]
[ROW][C]Epanechnikov[/C][C]94.9510763209393[/C][C]0.0106539400813084[/C][/ROW]
[ROW][C]Rectangular[/C][C]85.8512720156556[/C][C]0.0094967201141213[/C][/ROW]
[ROW][C]Triangular[/C][C]90.0978473581213[/C][C]0.0118292973437474[/C][/ROW]
[ROW][C]Biweight[/C][C]94.9510763209393[/C][C]0.0111023460714745[/C][/ROW]
[ROW][C]Cosine[/C][C]94.9510763209393[/C][C]0.0112645241879143[/C][/ROW]
[ROW][C]Optcosine[/C][C]94.9510763209393[/C][C]0.0108008702437607[/C][/ROW]
 [/TABLE]
Source: https://freestatistics.org/blog/index.php?pk=232509&T=23
Globally Unique Identifier (entire table): ba.freestatistics.org/blog/index.php?pk=232509&T=23
As an alternative you can also use a QR Code:
The GUIDs for individual cells are displayed in the table below:
| Maximum Density Values | | Kernel | x-value | max. density | | Gaussian | 93.7377690802348 | 0.0121157807477659 | | Epanechnikov | 94.9510763209393 | 0.0106539400813084 | | Rectangular | 85.8512720156556 | 0.0094967201141213 | | Triangular | 90.0978473581213 | 0.0118292973437474 | | Biweight | 94.9510763209393 | 0.0111023460714745 | | Cosine | 94.9510763209393 | 0.0112645241879143 | | Optcosine | 94.9510763209393 | 0.0108008702437607 |
If you paste this QR Code into your document, anyone with a smartphone or tablet will be able to scan it and view this table in a browser.
If you paste this QR Code into your document, anyone with a smartphone or tablet will be able to scan it and view this table in a browser.
If you paste this QR Code into your document, anyone with a smartphone or tablet will be able to scan it and view this table in a browser.
If you paste this QR Code into your document, anyone with a smartphone or tablet will be able to scan it and view this table in a browser.
If you paste this QR Code into your document, anyone with a smartphone or tablet will be able to scan it and view this table in a browser.
| Maximum Density Values | | Kernel | x-value | max. density | | Gaussian | 93.7377690802348 | 0.0121157807477659 | | Epanechnikov | 94.9510763209393 | 0.0106539400813084 | | Rectangular | 86.4579256360078 | 0.0094967201141213 | | Triangular | 90.0978473581213 | 0.0118292973437474 | | Biweight | 94.9510763209393 | 0.0111023460714745 | | Cosine | 94.9510763209393 | 0.0112645241879143 | | Optcosine | 94.9510763209393 | 0.0108008702437607 |
\begin{tabular}{lllllllll}
\hline
Maximum Density Values \tabularnewline
Kernel & x-value & max. density \tabularnewline
Gaussian & 93.7377690802348 & 0.0121157807477659 \tabularnewline
Epanechnikov & 94.9510763209393 & 0.0106539400813084 \tabularnewline
Rectangular & 86.4579256360078 & 0.0094967201141213 \tabularnewline
Triangular & 90.0978473581213 & 0.0118292973437474 \tabularnewline
Biweight & 94.9510763209393 & 0.0111023460714745 \tabularnewline
Cosine & 94.9510763209393 & 0.0112645241879143 \tabularnewline
Optcosine & 94.9510763209393 & 0.0108008702437607 \tabularnewline
 \hline
\end{tabular}
%Source: https://freestatistics.org/blog/index.php?pk=232509&T=24
[TABLE]
[ROW][C]Maximum Density Values[/C][/ROW]
[ROW][C]Kernel[/C][C]x-value[/C][C]max. density[/C][/ROW]
[ROW][C]Gaussian[/C][C]93.7377690802348[/C][C]0.0121157807477659[/C][/ROW]
[ROW][C]Epanechnikov[/C][C]94.9510763209393[/C][C]0.0106539400813084[/C][/ROW]
[ROW][C]Rectangular[/C][C]86.4579256360078[/C][C]0.0094967201141213[/C][/ROW]
[ROW][C]Triangular[/C][C]90.0978473581213[/C][C]0.0118292973437474[/C][/ROW]
[ROW][C]Biweight[/C][C]94.9510763209393[/C][C]0.0111023460714745[/C][/ROW]
[ROW][C]Cosine[/C][C]94.9510763209393[/C][C]0.0112645241879143[/C][/ROW]
[ROW][C]Optcosine[/C][C]94.9510763209393[/C][C]0.0108008702437607[/C][/ROW]
 [/TABLE]
Source: https://freestatistics.org/blog/index.php?pk=232509&T=24
Globally Unique Identifier (entire table): ba.freestatistics.org/blog/index.php?pk=232509&T=24
As an alternative you can also use a QR Code:
The GUIDs for individual cells are displayed in the table below:
| Maximum Density Values | | Kernel | x-value | max. density | | Gaussian | 93.7377690802348 | 0.0121157807477659 | | Epanechnikov | 94.9510763209393 | 0.0106539400813084 | | Rectangular | 86.4579256360078 | 0.0094967201141213 | | Triangular | 90.0978473581213 | 0.0118292973437474 | | Biweight | 94.9510763209393 | 0.0111023460714745 | | Cosine | 94.9510763209393 | 0.0112645241879143 | | Optcosine | 94.9510763209393 | 0.0108008702437607 |
If you paste this QR Code into your document, anyone with a smartphone or tablet will be able to scan it and view this table in a browser.
If you paste this QR Code into your document, anyone with a smartphone or tablet will be able to scan it and view this table in a browser.
If you paste this QR Code into your document, anyone with a smartphone or tablet will be able to scan it and view this table in a browser.
If you paste this QR Code into your document, anyone with a smartphone or tablet will be able to scan it and view this table in a browser.
If you paste this QR Code into your document, anyone with a smartphone or tablet will be able to scan it and view this table in a browser.
| Maximum Density Values | | Kernel | x-value | max. density | | Gaussian | 93.7377690802348 | 0.0121157807477659 | | Epanechnikov | 94.9510763209393 | 0.0106539400813084 | | Rectangular | 87.0645792563601 | 0.0094967201141213 | | Triangular | 90.0978473581213 | 0.0118292973437474 | | Biweight | 94.9510763209393 | 0.0111023460714745 | | Cosine | 94.9510763209393 | 0.0112645241879143 | | Optcosine | 94.9510763209393 | 0.0108008702437607 |
\begin{tabular}{lllllllll}
\hline
Maximum Density Values \tabularnewline
Kernel & x-value & max. density \tabularnewline
Gaussian & 93.7377690802348 & 0.0121157807477659 \tabularnewline
Epanechnikov & 94.9510763209393 & 0.0106539400813084 \tabularnewline
Rectangular & 87.0645792563601 & 0.0094967201141213 \tabularnewline
Triangular & 90.0978473581213 & 0.0118292973437474 \tabularnewline
Biweight & 94.9510763209393 & 0.0111023460714745 \tabularnewline
Cosine & 94.9510763209393 & 0.0112645241879143 \tabularnewline
Optcosine & 94.9510763209393 & 0.0108008702437607 \tabularnewline
 \hline
\end{tabular}
%Source: https://freestatistics.org/blog/index.php?pk=232509&T=25
[TABLE]
[ROW][C]Maximum Density Values[/C][/ROW]
[ROW][C]Kernel[/C][C]x-value[/C][C]max. density[/C][/ROW]
[ROW][C]Gaussian[/C][C]93.7377690802348[/C][C]0.0121157807477659[/C][/ROW]
[ROW][C]Epanechnikov[/C][C]94.9510763209393[/C][C]0.0106539400813084[/C][/ROW]
[ROW][C]Rectangular[/C][C]87.0645792563601[/C][C]0.0094967201141213[/C][/ROW]
[ROW][C]Triangular[/C][C]90.0978473581213[/C][C]0.0118292973437474[/C][/ROW]
[ROW][C]Biweight[/C][C]94.9510763209393[/C][C]0.0111023460714745[/C][/ROW]
[ROW][C]Cosine[/C][C]94.9510763209393[/C][C]0.0112645241879143[/C][/ROW]
[ROW][C]Optcosine[/C][C]94.9510763209393[/C][C]0.0108008702437607[/C][/ROW]
 [/TABLE]
Source: https://freestatistics.org/blog/index.php?pk=232509&T=25
Globally Unique Identifier (entire table): ba.freestatistics.org/blog/index.php?pk=232509&T=25
As an alternative you can also use a QR Code:
The GUIDs for individual cells are displayed in the table below:
| Maximum Density Values | | Kernel | x-value | max. density | | Gaussian | 93.7377690802348 | 0.0121157807477659 | | Epanechnikov | 94.9510763209393 | 0.0106539400813084 | | Rectangular | 87.0645792563601 | 0.0094967201141213 | | Triangular | 90.0978473581213 | 0.0118292973437474 | | Biweight | 94.9510763209393 | 0.0111023460714745 | | Cosine | 94.9510763209393 | 0.0112645241879143 | | Optcosine | 94.9510763209393 | 0.0108008702437607 |
If you paste this QR Code into your document, anyone with a smartphone or tablet will be able to scan it and view this table in a browser.
If you paste this QR Code into your document, anyone with a smartphone or tablet will be able to scan it and view this table in a browser.
If you paste this QR Code into your document, anyone with a smartphone or tablet will be able to scan it and view this table in a browser.
If you paste this QR Code into your document, anyone with a smartphone or tablet will be able to scan it and view this table in a browser.
If you paste this QR Code into your document, anyone with a smartphone or tablet will be able to scan it and view this table in a browser.
| Maximum Density Values | | Kernel | x-value | max. density | | Gaussian | 93.7377690802348 | 0.0121157807477659 | | Epanechnikov | 94.9510763209393 | 0.0106539400813084 | | Rectangular | 87.6712328767123 | 0.0094967201141213 | | Triangular | 90.0978473581213 | 0.0118292973437474 | | Biweight | 94.9510763209393 | 0.0111023460714745 | | Cosine | 94.9510763209393 | 0.0112645241879143 | | Optcosine | 94.9510763209393 | 0.0108008702437607 |
\begin{tabular}{lllllllll}
\hline
Maximum Density Values \tabularnewline
Kernel & x-value & max. density \tabularnewline
Gaussian & 93.7377690802348 & 0.0121157807477659 \tabularnewline
Epanechnikov & 94.9510763209393 & 0.0106539400813084 \tabularnewline
Rectangular & 87.6712328767123 & 0.0094967201141213 \tabularnewline
Triangular & 90.0978473581213 & 0.0118292973437474 \tabularnewline
Biweight & 94.9510763209393 & 0.0111023460714745 \tabularnewline
Cosine & 94.9510763209393 & 0.0112645241879143 \tabularnewline
Optcosine & 94.9510763209393 & 0.0108008702437607 \tabularnewline
 \hline
\end{tabular}
%Source: https://freestatistics.org/blog/index.php?pk=232509&T=26
[TABLE]
[ROW][C]Maximum Density Values[/C][/ROW]
[ROW][C]Kernel[/C][C]x-value[/C][C]max. density[/C][/ROW]
[ROW][C]Gaussian[/C][C]93.7377690802348[/C][C]0.0121157807477659[/C][/ROW]
[ROW][C]Epanechnikov[/C][C]94.9510763209393[/C][C]0.0106539400813084[/C][/ROW]
[ROW][C]Rectangular[/C][C]87.6712328767123[/C][C]0.0094967201141213[/C][/ROW]
[ROW][C]Triangular[/C][C]90.0978473581213[/C][C]0.0118292973437474[/C][/ROW]
[ROW][C]Biweight[/C][C]94.9510763209393[/C][C]0.0111023460714745[/C][/ROW]
[ROW][C]Cosine[/C][C]94.9510763209393[/C][C]0.0112645241879143[/C][/ROW]
[ROW][C]Optcosine[/C][C]94.9510763209393[/C][C]0.0108008702437607[/C][/ROW]
 [/TABLE]
Source: https://freestatistics.org/blog/index.php?pk=232509&T=26
Globally Unique Identifier (entire table): ba.freestatistics.org/blog/index.php?pk=232509&T=26
As an alternative you can also use a QR Code:
The GUIDs for individual cells are displayed in the table below:
| Maximum Density Values | | Kernel | x-value | max. density | | Gaussian | 93.7377690802348 | 0.0121157807477659 | | Epanechnikov | 94.9510763209393 | 0.0106539400813084 | | Rectangular | 87.6712328767123 | 0.0094967201141213 | | Triangular | 90.0978473581213 | 0.0118292973437474 | | Biweight | 94.9510763209393 | 0.0111023460714745 | | Cosine | 94.9510763209393 | 0.0112645241879143 | | Optcosine | 94.9510763209393 | 0.0108008702437607 |
If you paste this QR Code into your document, anyone with a smartphone or tablet will be able to scan it and view this table in a browser.
If you paste this QR Code into your document, anyone with a smartphone or tablet will be able to scan it and view this table in a browser.
If you paste this QR Code into your document, anyone with a smartphone or tablet will be able to scan it and view this table in a browser.
If you paste this QR Code into your document, anyone with a smartphone or tablet will be able to scan it and view this table in a browser.
If you paste this QR Code into your document, anyone with a smartphone or tablet will be able to scan it and view this table in a browser.
| Maximum Density Values | | Kernel | x-value | max. density | | Gaussian | 93.7377690802348 | 0.0121157807477659 | | Epanechnikov | 94.9510763209393 | 0.0106539400813084 | | Rectangular | 89.4911937377691 | 0.0094967201141213 | | Triangular | 90.0978473581213 | 0.0118292973437474 | | Biweight | 94.9510763209393 | 0.0111023460714745 | | Cosine | 94.9510763209393 | 0.0112645241879143 | | Optcosine | 94.9510763209393 | 0.0108008702437607 |
\begin{tabular}{lllllllll}
\hline
Maximum Density Values \tabularnewline
Kernel & x-value & max. density \tabularnewline
Gaussian & 93.7377690802348 & 0.0121157807477659 \tabularnewline
Epanechnikov & 94.9510763209393 & 0.0106539400813084 \tabularnewline
Rectangular & 89.4911937377691 & 0.0094967201141213 \tabularnewline
Triangular & 90.0978473581213 & 0.0118292973437474 \tabularnewline
Biweight & 94.9510763209393 & 0.0111023460714745 \tabularnewline
Cosine & 94.9510763209393 & 0.0112645241879143 \tabularnewline
Optcosine & 94.9510763209393 & 0.0108008702437607 \tabularnewline
 \hline
\end{tabular}
%Source: https://freestatistics.org/blog/index.php?pk=232509&T=27
[TABLE]
[ROW][C]Maximum Density Values[/C][/ROW]
[ROW][C]Kernel[/C][C]x-value[/C][C]max. density[/C][/ROW]
[ROW][C]Gaussian[/C][C]93.7377690802348[/C][C]0.0121157807477659[/C][/ROW]
[ROW][C]Epanechnikov[/C][C]94.9510763209393[/C][C]0.0106539400813084[/C][/ROW]
[ROW][C]Rectangular[/C][C]89.4911937377691[/C][C]0.0094967201141213[/C][/ROW]
[ROW][C]Triangular[/C][C]90.0978473581213[/C][C]0.0118292973437474[/C][/ROW]
[ROW][C]Biweight[/C][C]94.9510763209393[/C][C]0.0111023460714745[/C][/ROW]
[ROW][C]Cosine[/C][C]94.9510763209393[/C][C]0.0112645241879143[/C][/ROW]
[ROW][C]Optcosine[/C][C]94.9510763209393[/C][C]0.0108008702437607[/C][/ROW]
 [/TABLE]
Source: https://freestatistics.org/blog/index.php?pk=232509&T=27
Globally Unique Identifier (entire table): ba.freestatistics.org/blog/index.php?pk=232509&T=27
As an alternative you can also use a QR Code:
The GUIDs for individual cells are displayed in the table below:
| Maximum Density Values | | Kernel | x-value | max. density | | Gaussian | 93.7377690802348 | 0.0121157807477659 | | Epanechnikov | 94.9510763209393 | 0.0106539400813084 | | Rectangular | 89.4911937377691 | 0.0094967201141213 | | Triangular | 90.0978473581213 | 0.0118292973437474 | | Biweight | 94.9510763209393 | 0.0111023460714745 | | Cosine | 94.9510763209393 | 0.0112645241879143 | | Optcosine | 94.9510763209393 | 0.0108008702437607 |
If you paste this QR Code into your document, anyone with a smartphone or tablet will be able to scan it and view this table in a browser.
If you paste this QR Code into your document, anyone with a smartphone or tablet will be able to scan it and view this table in a browser.
If you paste this QR Code into your document, anyone with a smartphone or tablet will be able to scan it and view this table in a browser.
If you paste this QR Code into your document, anyone with a smartphone or tablet will be able to scan it and view this table in a browser.
If you paste this QR Code into your document, anyone with a smartphone or tablet will be able to scan it and view this table in a browser.
| Maximum Density Values | | Kernel | x-value | max. density | | Gaussian | 93.7377690802348 | 0.0121157807477659 | | Epanechnikov | 94.9510763209393 | 0.0106539400813084 | | Rectangular | 90.0978473581213 | 0.0094967201141213 | | Triangular | 90.0978473581213 | 0.0118292973437474 | | Biweight | 94.9510763209393 | 0.0111023460714745 | | Cosine | 94.9510763209393 | 0.0112645241879143 | | Optcosine | 94.9510763209393 | 0.0108008702437607 |
\begin{tabular}{lllllllll}
\hline
Maximum Density Values \tabularnewline
Kernel & x-value & max. density \tabularnewline
Gaussian & 93.7377690802348 & 0.0121157807477659 \tabularnewline
Epanechnikov & 94.9510763209393 & 0.0106539400813084 \tabularnewline
Rectangular & 90.0978473581213 & 0.0094967201141213 \tabularnewline
Triangular & 90.0978473581213 & 0.0118292973437474 \tabularnewline
Biweight & 94.9510763209393 & 0.0111023460714745 \tabularnewline
Cosine & 94.9510763209393 & 0.0112645241879143 \tabularnewline
Optcosine & 94.9510763209393 & 0.0108008702437607 \tabularnewline
 \hline
\end{tabular}
%Source: https://freestatistics.org/blog/index.php?pk=232509&T=28
[TABLE]
[ROW][C]Maximum Density Values[/C][/ROW]
[ROW][C]Kernel[/C][C]x-value[/C][C]max. density[/C][/ROW]
[ROW][C]Gaussian[/C][C]93.7377690802348[/C][C]0.0121157807477659[/C][/ROW]
[ROW][C]Epanechnikov[/C][C]94.9510763209393[/C][C]0.0106539400813084[/C][/ROW]
[ROW][C]Rectangular[/C][C]90.0978473581213[/C][C]0.0094967201141213[/C][/ROW]
[ROW][C]Triangular[/C][C]90.0978473581213[/C][C]0.0118292973437474[/C][/ROW]
[ROW][C]Biweight[/C][C]94.9510763209393[/C][C]0.0111023460714745[/C][/ROW]
[ROW][C]Cosine[/C][C]94.9510763209393[/C][C]0.0112645241879143[/C][/ROW]
[ROW][C]Optcosine[/C][C]94.9510763209393[/C][C]0.0108008702437607[/C][/ROW]
 [/TABLE]
Source: https://freestatistics.org/blog/index.php?pk=232509&T=28
Globally Unique Identifier (entire table): ba.freestatistics.org/blog/index.php?pk=232509&T=28
As an alternative you can also use a QR Code:
The GUIDs for individual cells are displayed in the table below:
| Maximum Density Values | | Kernel | x-value | max. density | | Gaussian | 93.7377690802348 | 0.0121157807477659 | | Epanechnikov | 94.9510763209393 | 0.0106539400813084 | | Rectangular | 90.0978473581213 | 0.0094967201141213 | | Triangular | 90.0978473581213 | 0.0118292973437474 | | Biweight | 94.9510763209393 | 0.0111023460714745 | | Cosine | 94.9510763209393 | 0.0112645241879143 | | Optcosine | 94.9510763209393 | 0.0108008702437607 |
If you paste this QR Code into your document, anyone with a smartphone or tablet will be able to scan it and view this table in a browser.
If you paste this QR Code into your document, anyone with a smartphone or tablet will be able to scan it and view this table in a browser.
If you paste this QR Code into your document, anyone with a smartphone or tablet will be able to scan it and view this table in a browser.
If you paste this QR Code into your document, anyone with a smartphone or tablet will be able to scan it and view this table in a browser.
If you paste this QR Code into your document, anyone with a smartphone or tablet will be able to scan it and view this table in a browser.
| Maximum Density Values | | Kernel | x-value | max. density | | Gaussian | 93.7377690802348 | 0.0121157807477659 | | Epanechnikov | 94.9510763209393 | 0.0106539400813084 | | Rectangular | 90.7045009784736 | 0.0094967201141213 | | Triangular | 90.0978473581213 | 0.0118292973437474 | | Biweight | 94.9510763209393 | 0.0111023460714745 | | Cosine | 94.9510763209393 | 0.0112645241879143 | | Optcosine | 94.9510763209393 | 0.0108008702437607 |
\begin{tabular}{lllllllll}
\hline
Maximum Density Values \tabularnewline
Kernel & x-value & max. density \tabularnewline
Gaussian & 93.7377690802348 & 0.0121157807477659 \tabularnewline
Epanechnikov & 94.9510763209393 & 0.0106539400813084 \tabularnewline
Rectangular & 90.7045009784736 & 0.0094967201141213 \tabularnewline
Triangular & 90.0978473581213 & 0.0118292973437474 \tabularnewline
Biweight & 94.9510763209393 & 0.0111023460714745 \tabularnewline
Cosine & 94.9510763209393 & 0.0112645241879143 \tabularnewline
Optcosine & 94.9510763209393 & 0.0108008702437607 \tabularnewline
 \hline
\end{tabular}
%Source: https://freestatistics.org/blog/index.php?pk=232509&T=29
[TABLE]
[ROW][C]Maximum Density Values[/C][/ROW]
[ROW][C]Kernel[/C][C]x-value[/C][C]max. density[/C][/ROW]
[ROW][C]Gaussian[/C][C]93.7377690802348[/C][C]0.0121157807477659[/C][/ROW]
[ROW][C]Epanechnikov[/C][C]94.9510763209393[/C][C]0.0106539400813084[/C][/ROW]
[ROW][C]Rectangular[/C][C]90.7045009784736[/C][C]0.0094967201141213[/C][/ROW]
[ROW][C]Triangular[/C][C]90.0978473581213[/C][C]0.0118292973437474[/C][/ROW]
[ROW][C]Biweight[/C][C]94.9510763209393[/C][C]0.0111023460714745[/C][/ROW]
[ROW][C]Cosine[/C][C]94.9510763209393[/C][C]0.0112645241879143[/C][/ROW]
[ROW][C]Optcosine[/C][C]94.9510763209393[/C][C]0.0108008702437607[/C][/ROW]
 [/TABLE]
Source: https://freestatistics.org/blog/index.php?pk=232509&T=29
Globally Unique Identifier (entire table): ba.freestatistics.org/blog/index.php?pk=232509&T=29
As an alternative you can also use a QR Code:
The GUIDs for individual cells are displayed in the table below:
| Maximum Density Values | | Kernel | x-value | max. density | | Gaussian | 93.7377690802348 | 0.0121157807477659 | | Epanechnikov | 94.9510763209393 | 0.0106539400813084 | | Rectangular | 90.7045009784736 | 0.0094967201141213 | | Triangular | 90.0978473581213 | 0.0118292973437474 | | Biweight | 94.9510763209393 | 0.0111023460714745 | | Cosine | 94.9510763209393 | 0.0112645241879143 | | Optcosine | 94.9510763209393 | 0.0108008702437607 |
If you paste this QR Code into your document, anyone with a smartphone or tablet will be able to scan it and view this table in a browser.
If you paste this QR Code into your document, anyone with a smartphone or tablet will be able to scan it and view this table in a browser.
If you paste this QR Code into your document, anyone with a smartphone or tablet will be able to scan it and view this table in a browser.
If you paste this QR Code into your document, anyone with a smartphone or tablet will be able to scan it and view this table in a browser.
If you paste this QR Code into your document, anyone with a smartphone or tablet will be able to scan it and view this table in a browser.
| Maximum Density Values | | Kernel | x-value | max. density | | Gaussian | 93.7377690802348 | 0.0121157807477659 | | Epanechnikov | 94.9510763209393 | 0.0106539400813084 | | Rectangular | 91.3111545988258 | 0.0094967201141213 | | Triangular | 90.0978473581213 | 0.0118292973437474 | | Biweight | 94.9510763209393 | 0.0111023460714745 | | Cosine | 94.9510763209393 | 0.0112645241879143 | | Optcosine | 94.9510763209393 | 0.0108008702437607 |
\begin{tabular}{lllllllll}
\hline
Maximum Density Values \tabularnewline
Kernel & x-value & max. density \tabularnewline
Gaussian & 93.7377690802348 & 0.0121157807477659 \tabularnewline
Epanechnikov & 94.9510763209393 & 0.0106539400813084 \tabularnewline
Rectangular & 91.3111545988258 & 0.0094967201141213 \tabularnewline
Triangular & 90.0978473581213 & 0.0118292973437474 \tabularnewline
Biweight & 94.9510763209393 & 0.0111023460714745 \tabularnewline
Cosine & 94.9510763209393 & 0.0112645241879143 \tabularnewline
Optcosine & 94.9510763209393 & 0.0108008702437607 \tabularnewline
 \hline
\end{tabular}
%Source: https://freestatistics.org/blog/index.php?pk=232509&T=30
[TABLE]
[ROW][C]Maximum Density Values[/C][/ROW]
[ROW][C]Kernel[/C][C]x-value[/C][C]max. density[/C][/ROW]
[ROW][C]Gaussian[/C][C]93.7377690802348[/C][C]0.0121157807477659[/C][/ROW]
[ROW][C]Epanechnikov[/C][C]94.9510763209393[/C][C]0.0106539400813084[/C][/ROW]
[ROW][C]Rectangular[/C][C]91.3111545988258[/C][C]0.0094967201141213[/C][/ROW]
[ROW][C]Triangular[/C][C]90.0978473581213[/C][C]0.0118292973437474[/C][/ROW]
[ROW][C]Biweight[/C][C]94.9510763209393[/C][C]0.0111023460714745[/C][/ROW]
[ROW][C]Cosine[/C][C]94.9510763209393[/C][C]0.0112645241879143[/C][/ROW]
[ROW][C]Optcosine[/C][C]94.9510763209393[/C][C]0.0108008702437607[/C][/ROW]
 [/TABLE]
Source: https://freestatistics.org/blog/index.php?pk=232509&T=30
Globally Unique Identifier (entire table): ba.freestatistics.org/blog/index.php?pk=232509&T=30
As an alternative you can also use a QR Code:
The GUIDs for individual cells are displayed in the table below:
| Maximum Density Values | | Kernel | x-value | max. density | | Gaussian | 93.7377690802348 | 0.0121157807477659 | | Epanechnikov | 94.9510763209393 | 0.0106539400813084 | | Rectangular | 91.3111545988258 | 0.0094967201141213 | | Triangular | 90.0978473581213 | 0.0118292973437474 | | Biweight | 94.9510763209393 | 0.0111023460714745 | | Cosine | 94.9510763209393 | 0.0112645241879143 | | Optcosine | 94.9510763209393 | 0.0108008702437607 |
If you paste this QR Code into your document, anyone with a smartphone or tablet will be able to scan it and view this table in a browser.
If you paste this QR Code into your document, anyone with a smartphone or tablet will be able to scan it and view this table in a browser.
If you paste this QR Code into your document, anyone with a smartphone or tablet will be able to scan it and view this table in a browser.
If you paste this QR Code into your document, anyone with a smartphone or tablet will be able to scan it and view this table in a browser.
If you paste this QR Code into your document, anyone with a smartphone or tablet will be able to scan it and view this table in a browser.
| Maximum Density Values | | Kernel | x-value | max. density | | Gaussian | 93.7377690802348 | 0.0121157807477659 | | Epanechnikov | 94.9510763209393 | 0.0106539400813084 | | Rectangular | 91.9178082191781 | 0.0094967201141213 | | Triangular | 90.0978473581213 | 0.0118292973437474 | | Biweight | 94.9510763209393 | 0.0111023460714745 | | Cosine | 94.9510763209393 | 0.0112645241879143 | | Optcosine | 94.9510763209393 | 0.0108008702437607 |
\begin{tabular}{lllllllll}
\hline
Maximum Density Values \tabularnewline
Kernel & x-value & max. density \tabularnewline
Gaussian & 93.7377690802348 & 0.0121157807477659 \tabularnewline
Epanechnikov & 94.9510763209393 & 0.0106539400813084 \tabularnewline
Rectangular & 91.9178082191781 & 0.0094967201141213 \tabularnewline
Triangular & 90.0978473581213 & 0.0118292973437474 \tabularnewline
Biweight & 94.9510763209393 & 0.0111023460714745 \tabularnewline
Cosine & 94.9510763209393 & 0.0112645241879143 \tabularnewline
Optcosine & 94.9510763209393 & 0.0108008702437607 \tabularnewline
 \hline
\end{tabular}
%Source: https://freestatistics.org/blog/index.php?pk=232509&T=31
[TABLE]
[ROW][C]Maximum Density Values[/C][/ROW]
[ROW][C]Kernel[/C][C]x-value[/C][C]max. density[/C][/ROW]
[ROW][C]Gaussian[/C][C]93.7377690802348[/C][C]0.0121157807477659[/C][/ROW]
[ROW][C]Epanechnikov[/C][C]94.9510763209393[/C][C]0.0106539400813084[/C][/ROW]
[ROW][C]Rectangular[/C][C]91.9178082191781[/C][C]0.0094967201141213[/C][/ROW]
[ROW][C]Triangular[/C][C]90.0978473581213[/C][C]0.0118292973437474[/C][/ROW]
[ROW][C]Biweight[/C][C]94.9510763209393[/C][C]0.0111023460714745[/C][/ROW]
[ROW][C]Cosine[/C][C]94.9510763209393[/C][C]0.0112645241879143[/C][/ROW]
[ROW][C]Optcosine[/C][C]94.9510763209393[/C][C]0.0108008702437607[/C][/ROW]
 [/TABLE]
Source: https://freestatistics.org/blog/index.php?pk=232509&T=31
Globally Unique Identifier (entire table): ba.freestatistics.org/blog/index.php?pk=232509&T=31
As an alternative you can also use a QR Code:
The GUIDs for individual cells are displayed in the table below:
| Maximum Density Values | | Kernel | x-value | max. density | | Gaussian | 93.7377690802348 | 0.0121157807477659 | | Epanechnikov | 94.9510763209393 | 0.0106539400813084 | | Rectangular | 91.9178082191781 | 0.0094967201141213 | | Triangular | 90.0978473581213 | 0.0118292973437474 | | Biweight | 94.9510763209393 | 0.0111023460714745 | | Cosine | 94.9510763209393 | 0.0112645241879143 | | Optcosine | 94.9510763209393 | 0.0108008702437607 |
If you paste this QR Code into your document, anyone with a smartphone or tablet will be able to scan it and view this table in a browser.
If you paste this QR Code into your document, anyone with a smartphone or tablet will be able to scan it and view this table in a browser.
If you paste this QR Code into your document, anyone with a smartphone or tablet will be able to scan it and view this table in a browser.
If you paste this QR Code into your document, anyone with a smartphone or tablet will be able to scan it and view this table in a browser.
If you paste this QR Code into your document, anyone with a smartphone or tablet will be able to scan it and view this table in a browser.
| Maximum Density Values | | Kernel | x-value | max. density | | Gaussian | 93.7377690802348 | 0.0121157807477659 | | Epanechnikov | 94.9510763209393 | 0.0106539400813084 | | Rectangular | 93.7377690802348 | 0.0094967201141213 | | Triangular | 90.0978473581213 | 0.0118292973437474 | | Biweight | 94.9510763209393 | 0.0111023460714745 | | Cosine | 94.9510763209393 | 0.0112645241879143 | | Optcosine | 94.9510763209393 | 0.0108008702437607 |
\begin{tabular}{lllllllll}
\hline
Maximum Density Values \tabularnewline
Kernel & x-value & max. density \tabularnewline
Gaussian & 93.7377690802348 & 0.0121157807477659 \tabularnewline
Epanechnikov & 94.9510763209393 & 0.0106539400813084 \tabularnewline
Rectangular & 93.7377690802348 & 0.0094967201141213 \tabularnewline
Triangular & 90.0978473581213 & 0.0118292973437474 \tabularnewline
Biweight & 94.9510763209393 & 0.0111023460714745 \tabularnewline
Cosine & 94.9510763209393 & 0.0112645241879143 \tabularnewline
Optcosine & 94.9510763209393 & 0.0108008702437607 \tabularnewline
 \hline
\end{tabular}
%Source: https://freestatistics.org/blog/index.php?pk=232509&T=32
[TABLE]
[ROW][C]Maximum Density Values[/C][/ROW]
[ROW][C]Kernel[/C][C]x-value[/C][C]max. density[/C][/ROW]
[ROW][C]Gaussian[/C][C]93.7377690802348[/C][C]0.0121157807477659[/C][/ROW]
[ROW][C]Epanechnikov[/C][C]94.9510763209393[/C][C]0.0106539400813084[/C][/ROW]
[ROW][C]Rectangular[/C][C]93.7377690802348[/C][C]0.0094967201141213[/C][/ROW]
[ROW][C]Triangular[/C][C]90.0978473581213[/C][C]0.0118292973437474[/C][/ROW]
[ROW][C]Biweight[/C][C]94.9510763209393[/C][C]0.0111023460714745[/C][/ROW]
[ROW][C]Cosine[/C][C]94.9510763209393[/C][C]0.0112645241879143[/C][/ROW]
[ROW][C]Optcosine[/C][C]94.9510763209393[/C][C]0.0108008702437607[/C][/ROW]
 [/TABLE]
Source: https://freestatistics.org/blog/index.php?pk=232509&T=32
Globally Unique Identifier (entire table): ba.freestatistics.org/blog/index.php?pk=232509&T=32
As an alternative you can also use a QR Code:
The GUIDs for individual cells are displayed in the table below:
| Maximum Density Values | | Kernel | x-value | max. density | | Gaussian | 93.7377690802348 | 0.0121157807477659 | | Epanechnikov | 94.9510763209393 | 0.0106539400813084 | | Rectangular | 93.7377690802348 | 0.0094967201141213 | | Triangular | 90.0978473581213 | 0.0118292973437474 | | Biweight | 94.9510763209393 | 0.0111023460714745 | | Cosine | 94.9510763209393 | 0.0112645241879143 | | Optcosine | 94.9510763209393 | 0.0108008702437607 |
If you paste this QR Code into your document, anyone with a smartphone or tablet will be able to scan it and view this table in a browser.
If you paste this QR Code into your document, anyone with a smartphone or tablet will be able to scan it and view this table in a browser.
If you paste this QR Code into your document, anyone with a smartphone or tablet will be able to scan it and view this table in a browser.
If you paste this QR Code into your document, anyone with a smartphone or tablet will be able to scan it and view this table in a browser.
If you paste this QR Code into your document, anyone with a smartphone or tablet will be able to scan it and view this table in a browser.
| Maximum Density Values | | Kernel | x-value | max. density | | Gaussian | 93.7377690802348 | 0.0121157807477659 | | Epanechnikov | 94.9510763209393 | 0.0106539400813084 | | Rectangular | 94.3444227005871 | 0.0094967201141213 | | Triangular | 90.0978473581213 | 0.0118292973437474 | | Biweight | 94.9510763209393 | 0.0111023460714745 | | Cosine | 94.9510763209393 | 0.0112645241879143 | | Optcosine | 94.9510763209393 | 0.0108008702437607 |
\begin{tabular}{lllllllll}
\hline
Maximum Density Values \tabularnewline
Kernel & x-value & max. density \tabularnewline
Gaussian & 93.7377690802348 & 0.0121157807477659 \tabularnewline
Epanechnikov & 94.9510763209393 & 0.0106539400813084 \tabularnewline
Rectangular & 94.3444227005871 & 0.0094967201141213 \tabularnewline
Triangular & 90.0978473581213 & 0.0118292973437474 \tabularnewline
Biweight & 94.9510763209393 & 0.0111023460714745 \tabularnewline
Cosine & 94.9510763209393 & 0.0112645241879143 \tabularnewline
Optcosine & 94.9510763209393 & 0.0108008702437607 \tabularnewline
 \hline
\end{tabular}
%Source: https://freestatistics.org/blog/index.php?pk=232509&T=33
[TABLE]
[ROW][C]Maximum Density Values[/C][/ROW]
[ROW][C]Kernel[/C][C]x-value[/C][C]max. density[/C][/ROW]
[ROW][C]Gaussian[/C][C]93.7377690802348[/C][C]0.0121157807477659[/C][/ROW]
[ROW][C]Epanechnikov[/C][C]94.9510763209393[/C][C]0.0106539400813084[/C][/ROW]
[ROW][C]Rectangular[/C][C]94.3444227005871[/C][C]0.0094967201141213[/C][/ROW]
[ROW][C]Triangular[/C][C]90.0978473581213[/C][C]0.0118292973437474[/C][/ROW]
[ROW][C]Biweight[/C][C]94.9510763209393[/C][C]0.0111023460714745[/C][/ROW]
[ROW][C]Cosine[/C][C]94.9510763209393[/C][C]0.0112645241879143[/C][/ROW]
[ROW][C]Optcosine[/C][C]94.9510763209393[/C][C]0.0108008702437607[/C][/ROW]
 [/TABLE]
Source: https://freestatistics.org/blog/index.php?pk=232509&T=33
Globally Unique Identifier (entire table): ba.freestatistics.org/blog/index.php?pk=232509&T=33
As an alternative you can also use a QR Code:
The GUIDs for individual cells are displayed in the table below:
| Maximum Density Values | | Kernel | x-value | max. density | | Gaussian | 93.7377690802348 | 0.0121157807477659 | | Epanechnikov | 94.9510763209393 | 0.0106539400813084 | | Rectangular | 94.3444227005871 | 0.0094967201141213 | | Triangular | 90.0978473581213 | 0.0118292973437474 | | Biweight | 94.9510763209393 | 0.0111023460714745 | | Cosine | 94.9510763209393 | 0.0112645241879143 | | Optcosine | 94.9510763209393 | 0.0108008702437607 |
If you paste this QR Code into your document, anyone with a smartphone or tablet will be able to scan it and view this table in a browser.
If you paste this QR Code into your document, anyone with a smartphone or tablet will be able to scan it and view this table in a browser.
If you paste this QR Code into your document, anyone with a smartphone or tablet will be able to scan it and view this table in a browser.
If you paste this QR Code into your document, anyone with a smartphone or tablet will be able to scan it and view this table in a browser.
If you paste this QR Code into your document, anyone with a smartphone or tablet will be able to scan it and view this table in a browser.
| Maximum Density Values | | Kernel | x-value | max. density | | Gaussian | 93.7377690802348 | 0.0121157807477659 | | Epanechnikov | 94.9510763209393 | 0.0106539400813084 | | Rectangular | 94.9510763209393 | 0.0094967201141213 | | Triangular | 90.0978473581213 | 0.0118292973437474 | | Biweight | 94.9510763209393 | 0.0111023460714745 | | Cosine | 94.9510763209393 | 0.0112645241879143 | | Optcosine | 94.9510763209393 | 0.0108008702437607 |
\begin{tabular}{lllllllll}
\hline
Maximum Density Values \tabularnewline
Kernel & x-value & max. density \tabularnewline
Gaussian & 93.7377690802348 & 0.0121157807477659 \tabularnewline
Epanechnikov & 94.9510763209393 & 0.0106539400813084 \tabularnewline
Rectangular & 94.9510763209393 & 0.0094967201141213 \tabularnewline
Triangular & 90.0978473581213 & 0.0118292973437474 \tabularnewline
Biweight & 94.9510763209393 & 0.0111023460714745 \tabularnewline
Cosine & 94.9510763209393 & 0.0112645241879143 \tabularnewline
Optcosine & 94.9510763209393 & 0.0108008702437607 \tabularnewline
 \hline
\end{tabular}
%Source: https://freestatistics.org/blog/index.php?pk=232509&T=34
[TABLE]
[ROW][C]Maximum Density Values[/C][/ROW]
[ROW][C]Kernel[/C][C]x-value[/C][C]max. density[/C][/ROW]
[ROW][C]Gaussian[/C][C]93.7377690802348[/C][C]0.0121157807477659[/C][/ROW]
[ROW][C]Epanechnikov[/C][C]94.9510763209393[/C][C]0.0106539400813084[/C][/ROW]
[ROW][C]Rectangular[/C][C]94.9510763209393[/C][C]0.0094967201141213[/C][/ROW]
[ROW][C]Triangular[/C][C]90.0978473581213[/C][C]0.0118292973437474[/C][/ROW]
[ROW][C]Biweight[/C][C]94.9510763209393[/C][C]0.0111023460714745[/C][/ROW]
[ROW][C]Cosine[/C][C]94.9510763209393[/C][C]0.0112645241879143[/C][/ROW]
[ROW][C]Optcosine[/C][C]94.9510763209393[/C][C]0.0108008702437607[/C][/ROW]
 [/TABLE]
Source: https://freestatistics.org/blog/index.php?pk=232509&T=34
Globally Unique Identifier (entire table): ba.freestatistics.org/blog/index.php?pk=232509&T=34
As an alternative you can also use a QR Code:
The GUIDs for individual cells are displayed in the table below:
| Maximum Density Values | | Kernel | x-value | max. density | | Gaussian | 93.7377690802348 | 0.0121157807477659 | | Epanechnikov | 94.9510763209393 | 0.0106539400813084 | | Rectangular | 94.9510763209393 | 0.0094967201141213 | | Triangular | 90.0978473581213 | 0.0118292973437474 | | Biweight | 94.9510763209393 | 0.0111023460714745 | | Cosine | 94.9510763209393 | 0.0112645241879143 | | Optcosine | 94.9510763209393 | 0.0108008702437607 |
If you paste this QR Code into your document, anyone with a smartphone or tablet will be able to scan it and view this table in a browser.
If you paste this QR Code into your document, anyone with a smartphone or tablet will be able to scan it and view this table in a browser.
If you paste this QR Code into your document, anyone with a smartphone or tablet will be able to scan it and view this table in a browser.
If you paste this QR Code into your document, anyone with a smartphone or tablet will be able to scan it and view this table in a browser.
If you paste this QR Code into your document, anyone with a smartphone or tablet will be able to scan it and view this table in a browser.
| Maximum Density Values | | Kernel | x-value | max. density | | Gaussian | 93.7377690802348 | 0.0121157807477659 | | Epanechnikov | 94.9510763209393 | 0.0106539400813084 | | Rectangular | 95.5577299412916 | 0.0094967201141213 | | Triangular | 90.0978473581213 | 0.0118292973437474 | | Biweight | 94.9510763209393 | 0.0111023460714745 | | Cosine | 94.9510763209393 | 0.0112645241879143 | | Optcosine | 94.9510763209393 | 0.0108008702437607 |
\begin{tabular}{lllllllll}
\hline
Maximum Density Values \tabularnewline
Kernel & x-value & max. density \tabularnewline
Gaussian & 93.7377690802348 & 0.0121157807477659 \tabularnewline
Epanechnikov & 94.9510763209393 & 0.0106539400813084 \tabularnewline
Rectangular & 95.5577299412916 & 0.0094967201141213 \tabularnewline
Triangular & 90.0978473581213 & 0.0118292973437474 \tabularnewline
Biweight & 94.9510763209393 & 0.0111023460714745 \tabularnewline
Cosine & 94.9510763209393 & 0.0112645241879143 \tabularnewline
Optcosine & 94.9510763209393 & 0.0108008702437607 \tabularnewline
 \hline
\end{tabular}
%Source: https://freestatistics.org/blog/index.php?pk=232509&T=35
[TABLE]
[ROW][C]Maximum Density Values[/C][/ROW]
[ROW][C]Kernel[/C][C]x-value[/C][C]max. density[/C][/ROW]
[ROW][C]Gaussian[/C][C]93.7377690802348[/C][C]0.0121157807477659[/C][/ROW]
[ROW][C]Epanechnikov[/C][C]94.9510763209393[/C][C]0.0106539400813084[/C][/ROW]
[ROW][C]Rectangular[/C][C]95.5577299412916[/C][C]0.0094967201141213[/C][/ROW]
[ROW][C]Triangular[/C][C]90.0978473581213[/C][C]0.0118292973437474[/C][/ROW]
[ROW][C]Biweight[/C][C]94.9510763209393[/C][C]0.0111023460714745[/C][/ROW]
[ROW][C]Cosine[/C][C]94.9510763209393[/C][C]0.0112645241879143[/C][/ROW]
[ROW][C]Optcosine[/C][C]94.9510763209393[/C][C]0.0108008702437607[/C][/ROW]
 [/TABLE]
Source: https://freestatistics.org/blog/index.php?pk=232509&T=35
Globally Unique Identifier (entire table): ba.freestatistics.org/blog/index.php?pk=232509&T=35
As an alternative you can also use a QR Code:
The GUIDs for individual cells are displayed in the table below:
| Maximum Density Values | | Kernel | x-value | max. density | | Gaussian | 93.7377690802348 | 0.0121157807477659 | | Epanechnikov | 94.9510763209393 | 0.0106539400813084 | | Rectangular | 95.5577299412916 | 0.0094967201141213 | | Triangular | 90.0978473581213 | 0.0118292973437474 | | Biweight | 94.9510763209393 | 0.0111023460714745 | | Cosine | 94.9510763209393 | 0.0112645241879143 | | Optcosine | 94.9510763209393 | 0.0108008702437607 |
If you paste this QR Code into your document, anyone with a smartphone or tablet will be able to scan it and view this table in a browser.
If you paste this QR Code into your document, anyone with a smartphone or tablet will be able to scan it and view this table in a browser.
If you paste this QR Code into your document, anyone with a smartphone or tablet will be able to scan it and view this table in a browser.
If you paste this QR Code into your document, anyone with a smartphone or tablet will be able to scan it and view this table in a browser.
If you paste this QR Code into your document, anyone with a smartphone or tablet will be able to scan it and view this table in a browser.
| Maximum Density Values | | Kernel | x-value | max. density | | Gaussian | 93.7377690802348 | 0.0121157807477659 | | Epanechnikov | 94.9510763209393 | 0.0106539400813084 | | Rectangular | 96.1643835616438 | 0.0094967201141213 | | Triangular | 90.0978473581213 | 0.0118292973437474 | | Biweight | 94.9510763209393 | 0.0111023460714745 | | Cosine | 94.9510763209393 | 0.0112645241879143 | | Optcosine | 94.9510763209393 | 0.0108008702437607 |
\begin{tabular}{lllllllll}
\hline
Maximum Density Values \tabularnewline
Kernel & x-value & max. density \tabularnewline
Gaussian & 93.7377690802348 & 0.0121157807477659 \tabularnewline
Epanechnikov & 94.9510763209393 & 0.0106539400813084 \tabularnewline
Rectangular & 96.1643835616438 & 0.0094967201141213 \tabularnewline
Triangular & 90.0978473581213 & 0.0118292973437474 \tabularnewline
Biweight & 94.9510763209393 & 0.0111023460714745 \tabularnewline
Cosine & 94.9510763209393 & 0.0112645241879143 \tabularnewline
Optcosine & 94.9510763209393 & 0.0108008702437607 \tabularnewline
 \hline
\end{tabular}
%Source: https://freestatistics.org/blog/index.php?pk=232509&T=36
[TABLE]
[ROW][C]Maximum Density Values[/C][/ROW]
[ROW][C]Kernel[/C][C]x-value[/C][C]max. density[/C][/ROW]
[ROW][C]Gaussian[/C][C]93.7377690802348[/C][C]0.0121157807477659[/C][/ROW]
[ROW][C]Epanechnikov[/C][C]94.9510763209393[/C][C]0.0106539400813084[/C][/ROW]
[ROW][C]Rectangular[/C][C]96.1643835616438[/C][C]0.0094967201141213[/C][/ROW]
[ROW][C]Triangular[/C][C]90.0978473581213[/C][C]0.0118292973437474[/C][/ROW]
[ROW][C]Biweight[/C][C]94.9510763209393[/C][C]0.0111023460714745[/C][/ROW]
[ROW][C]Cosine[/C][C]94.9510763209393[/C][C]0.0112645241879143[/C][/ROW]
[ROW][C]Optcosine[/C][C]94.9510763209393[/C][C]0.0108008702437607[/C][/ROW]
 [/TABLE]
Source: https://freestatistics.org/blog/index.php?pk=232509&T=36
Globally Unique Identifier (entire table): ba.freestatistics.org/blog/index.php?pk=232509&T=36
As an alternative you can also use a QR Code:
The GUIDs for individual cells are displayed in the table below:
| Maximum Density Values | | Kernel | x-value | max. density | | Gaussian | 93.7377690802348 | 0.0121157807477659 | | Epanechnikov | 94.9510763209393 | 0.0106539400813084 | | Rectangular | 96.1643835616438 | 0.0094967201141213 | | Triangular | 90.0978473581213 | 0.0118292973437474 | | Biweight | 94.9510763209393 | 0.0111023460714745 | | Cosine | 94.9510763209393 | 0.0112645241879143 | | Optcosine | 94.9510763209393 | 0.0108008702437607 |
If you paste this QR Code into your document, anyone with a smartphone or tablet will be able to scan it and view this table in a browser.
If you paste this QR Code into your document, anyone with a smartphone or tablet will be able to scan it and view this table in a browser.
If you paste this QR Code into your document, anyone with a smartphone or tablet will be able to scan it and view this table in a browser.
If you paste this QR Code into your document, anyone with a smartphone or tablet will be able to scan it and view this table in a browser.
If you paste this QR Code into your document, anyone with a smartphone or tablet will be able to scan it and view this table in a browser.
| Maximum Density Values | | Kernel | x-value | max. density | | Gaussian | 93.7377690802348 | 0.0121157807477659 | | Epanechnikov | 94.9510763209393 | 0.0106539400813084 | | Rectangular | 96.7710371819961 | 0.0094967201141213 | | Triangular | 90.0978473581213 | 0.0118292973437474 | | Biweight | 94.9510763209393 | 0.0111023460714745 | | Cosine | 94.9510763209393 | 0.0112645241879143 | | Optcosine | 94.9510763209393 | 0.0108008702437607 |
\begin{tabular}{lllllllll}
\hline
Maximum Density Values \tabularnewline
Kernel & x-value & max. density \tabularnewline
Gaussian & 93.7377690802348 & 0.0121157807477659 \tabularnewline
Epanechnikov & 94.9510763209393 & 0.0106539400813084 \tabularnewline
Rectangular & 96.7710371819961 & 0.0094967201141213 \tabularnewline
Triangular & 90.0978473581213 & 0.0118292973437474 \tabularnewline
Biweight & 94.9510763209393 & 0.0111023460714745 \tabularnewline
Cosine & 94.9510763209393 & 0.0112645241879143 \tabularnewline
Optcosine & 94.9510763209393 & 0.0108008702437607 \tabularnewline
 \hline
\end{tabular}
%Source: https://freestatistics.org/blog/index.php?pk=232509&T=37
[TABLE]
[ROW][C]Maximum Density Values[/C][/ROW]
[ROW][C]Kernel[/C][C]x-value[/C][C]max. density[/C][/ROW]
[ROW][C]Gaussian[/C][C]93.7377690802348[/C][C]0.0121157807477659[/C][/ROW]
[ROW][C]Epanechnikov[/C][C]94.9510763209393[/C][C]0.0106539400813084[/C][/ROW]
[ROW][C]Rectangular[/C][C]96.7710371819961[/C][C]0.0094967201141213[/C][/ROW]
[ROW][C]Triangular[/C][C]90.0978473581213[/C][C]0.0118292973437474[/C][/ROW]
[ROW][C]Biweight[/C][C]94.9510763209393[/C][C]0.0111023460714745[/C][/ROW]
[ROW][C]Cosine[/C][C]94.9510763209393[/C][C]0.0112645241879143[/C][/ROW]
[ROW][C]Optcosine[/C][C]94.9510763209393[/C][C]0.0108008702437607[/C][/ROW]
 [/TABLE]
Source: https://freestatistics.org/blog/index.php?pk=232509&T=37
Globally Unique Identifier (entire table): ba.freestatistics.org/blog/index.php?pk=232509&T=37
As an alternative you can also use a QR Code:
The GUIDs for individual cells are displayed in the table below:
| Maximum Density Values | | Kernel | x-value | max. density | | Gaussian | 93.7377690802348 | 0.0121157807477659 | | Epanechnikov | 94.9510763209393 | 0.0106539400813084 | | Rectangular | 96.7710371819961 | 0.0094967201141213 | | Triangular | 90.0978473581213 | 0.0118292973437474 | | Biweight | 94.9510763209393 | 0.0111023460714745 | | Cosine | 94.9510763209393 | 0.0112645241879143 | | Optcosine | 94.9510763209393 | 0.0108008702437607 |
If you paste this QR Code into your document, anyone with a smartphone or tablet will be able to scan it and view this table in a browser.
If you paste this QR Code into your document, anyone with a smartphone or tablet will be able to scan it and view this table in a browser.
If you paste this QR Code into your document, anyone with a smartphone or tablet will be able to scan it and view this table in a browser.
If you paste this QR Code into your document, anyone with a smartphone or tablet will be able to scan it and view this table in a browser.
If you paste this QR Code into your document, anyone with a smartphone or tablet will be able to scan it and view this table in a browser.
| Maximum Density Values | | Kernel | x-value | max. density | | Gaussian | 93.7377690802348 | 0.0121157807477659 | | Epanechnikov | 94.9510763209393 | 0.0106539400813084 | | Rectangular | 97.3776908023483 | 0.0094967201141213 | | Triangular | 90.0978473581213 | 0.0118292973437474 | | Biweight | 94.9510763209393 | 0.0111023460714745 | | Cosine | 94.9510763209393 | 0.0112645241879143 | | Optcosine | 94.9510763209393 | 0.0108008702437607 |
\begin{tabular}{lllllllll}
\hline
Maximum Density Values \tabularnewline
Kernel & x-value & max. density \tabularnewline
Gaussian & 93.7377690802348 & 0.0121157807477659 \tabularnewline
Epanechnikov & 94.9510763209393 & 0.0106539400813084 \tabularnewline
Rectangular & 97.3776908023483 & 0.0094967201141213 \tabularnewline
Triangular & 90.0978473581213 & 0.0118292973437474 \tabularnewline
Biweight & 94.9510763209393 & 0.0111023460714745 \tabularnewline
Cosine & 94.9510763209393 & 0.0112645241879143 \tabularnewline
Optcosine & 94.9510763209393 & 0.0108008702437607 \tabularnewline
 \hline
\end{tabular}
%Source: https://freestatistics.org/blog/index.php?pk=232509&T=38
[TABLE]
[ROW][C]Maximum Density Values[/C][/ROW]
[ROW][C]Kernel[/C][C]x-value[/C][C]max. density[/C][/ROW]
[ROW][C]Gaussian[/C][C]93.7377690802348[/C][C]0.0121157807477659[/C][/ROW]
[ROW][C]Epanechnikov[/C][C]94.9510763209393[/C][C]0.0106539400813084[/C][/ROW]
[ROW][C]Rectangular[/C][C]97.3776908023483[/C][C]0.0094967201141213[/C][/ROW]
[ROW][C]Triangular[/C][C]90.0978473581213[/C][C]0.0118292973437474[/C][/ROW]
[ROW][C]Biweight[/C][C]94.9510763209393[/C][C]0.0111023460714745[/C][/ROW]
[ROW][C]Cosine[/C][C]94.9510763209393[/C][C]0.0112645241879143[/C][/ROW]
[ROW][C]Optcosine[/C][C]94.9510763209393[/C][C]0.0108008702437607[/C][/ROW]
 [/TABLE]
Source: https://freestatistics.org/blog/index.php?pk=232509&T=38
Globally Unique Identifier (entire table): ba.freestatistics.org/blog/index.php?pk=232509&T=38
As an alternative you can also use a QR Code:
The GUIDs for individual cells are displayed in the table below:
| Maximum Density Values | | Kernel | x-value | max. density | | Gaussian | 93.7377690802348 | 0.0121157807477659 | | Epanechnikov | 94.9510763209393 | 0.0106539400813084 | | Rectangular | 97.3776908023483 | 0.0094967201141213 | | Triangular | 90.0978473581213 | 0.0118292973437474 | | Biweight | 94.9510763209393 | 0.0111023460714745 | | Cosine | 94.9510763209393 | 0.0112645241879143 | | Optcosine | 94.9510763209393 | 0.0108008702437607 |
If you paste this QR Code into your document, anyone with a smartphone or tablet will be able to scan it and view this table in a browser.
If you paste this QR Code into your document, anyone with a smartphone or tablet will be able to scan it and view this table in a browser.
If you paste this QR Code into your document, anyone with a smartphone or tablet will be able to scan it and view this table in a browser.
If you paste this QR Code into your document, anyone with a smartphone or tablet will be able to scan it and view this table in a browser.
If you paste this QR Code into your document, anyone with a smartphone or tablet will be able to scan it and view this table in a browser.
| Maximum Density Values | | Kernel | x-value | max. density | | Gaussian | 93.7377690802348 | 0.0121157807477659 | | Epanechnikov | 94.9510763209393 | 0.0106539400813084 | | Rectangular | 97.9843444227006 | 0.0094967201141213 | | Triangular | 90.0978473581213 | 0.0118292973437474 | | Biweight | 94.9510763209393 | 0.0111023460714745 | | Cosine | 94.9510763209393 | 0.0112645241879143 | | Optcosine | 94.9510763209393 | 0.0108008702437607 |
\begin{tabular}{lllllllll}
\hline
Maximum Density Values \tabularnewline
Kernel & x-value & max. density \tabularnewline
Gaussian & 93.7377690802348 & 0.0121157807477659 \tabularnewline
Epanechnikov & 94.9510763209393 & 0.0106539400813084 \tabularnewline
Rectangular & 97.9843444227006 & 0.0094967201141213 \tabularnewline
Triangular & 90.0978473581213 & 0.0118292973437474 \tabularnewline
Biweight & 94.9510763209393 & 0.0111023460714745 \tabularnewline
Cosine & 94.9510763209393 & 0.0112645241879143 \tabularnewline
Optcosine & 94.9510763209393 & 0.0108008702437607 \tabularnewline
 \hline
\end{tabular}
%Source: https://freestatistics.org/blog/index.php?pk=232509&T=39
[TABLE]
[ROW][C]Maximum Density Values[/C][/ROW]
[ROW][C]Kernel[/C][C]x-value[/C][C]max. density[/C][/ROW]
[ROW][C]Gaussian[/C][C]93.7377690802348[/C][C]0.0121157807477659[/C][/ROW]
[ROW][C]Epanechnikov[/C][C]94.9510763209393[/C][C]0.0106539400813084[/C][/ROW]
[ROW][C]Rectangular[/C][C]97.9843444227006[/C][C]0.0094967201141213[/C][/ROW]
[ROW][C]Triangular[/C][C]90.0978473581213[/C][C]0.0118292973437474[/C][/ROW]
[ROW][C]Biweight[/C][C]94.9510763209393[/C][C]0.0111023460714745[/C][/ROW]
[ROW][C]Cosine[/C][C]94.9510763209393[/C][C]0.0112645241879143[/C][/ROW]
[ROW][C]Optcosine[/C][C]94.9510763209393[/C][C]0.0108008702437607[/C][/ROW]
 [/TABLE]
Source: https://freestatistics.org/blog/index.php?pk=232509&T=39
Globally Unique Identifier (entire table): ba.freestatistics.org/blog/index.php?pk=232509&T=39
As an alternative you can also use a QR Code:
The GUIDs for individual cells are displayed in the table below:
| Maximum Density Values | | Kernel | x-value | max. density | | Gaussian | 93.7377690802348 | 0.0121157807477659 | | Epanechnikov | 94.9510763209393 | 0.0106539400813084 | | Rectangular | 97.9843444227006 | 0.0094967201141213 | | Triangular | 90.0978473581213 | 0.0118292973437474 | | Biweight | 94.9510763209393 | 0.0111023460714745 | | Cosine | 94.9510763209393 | 0.0112645241879143 | | Optcosine | 94.9510763209393 | 0.0108008702437607 |
If you paste this QR Code into your document, anyone with a smartphone or tablet will be able to scan it and view this table in a browser.
If you paste this QR Code into your document, anyone with a smartphone or tablet will be able to scan it and view this table in a browser.
If you paste this QR Code into your document, anyone with a smartphone or tablet will be able to scan it and view this table in a browser.
If you paste this QR Code into your document, anyone with a smartphone or tablet will be able to scan it and view this table in a browser.
If you paste this QR Code into your document, anyone with a smartphone or tablet will be able to scan it and view this table in a browser.
| Maximum Density Values | | Kernel | x-value | max. density | | Gaussian | 93.7377690802348 | 0.0121157807477659 | | Epanechnikov | 94.9510763209393 | 0.0106539400813084 | | Rectangular | 98.5909980430528 | 0.0094967201141213 | | Triangular | 90.0978473581213 | 0.0118292973437474 | | Biweight | 94.9510763209393 | 0.0111023460714745 | | Cosine | 94.9510763209393 | 0.0112645241879143 | | Optcosine | 94.9510763209393 | 0.0108008702437607 |
\begin{tabular}{lllllllll}
\hline
Maximum Density Values \tabularnewline
Kernel & x-value & max. density \tabularnewline
Gaussian & 93.7377690802348 & 0.0121157807477659 \tabularnewline
Epanechnikov & 94.9510763209393 & 0.0106539400813084 \tabularnewline
Rectangular & 98.5909980430528 & 0.0094967201141213 \tabularnewline
Triangular & 90.0978473581213 & 0.0118292973437474 \tabularnewline
Biweight & 94.9510763209393 & 0.0111023460714745 \tabularnewline
Cosine & 94.9510763209393 & 0.0112645241879143 \tabularnewline
Optcosine & 94.9510763209393 & 0.0108008702437607 \tabularnewline
 \hline
\end{tabular}
%Source: https://freestatistics.org/blog/index.php?pk=232509&T=40
[TABLE]
[ROW][C]Maximum Density Values[/C][/ROW]
[ROW][C]Kernel[/C][C]x-value[/C][C]max. density[/C][/ROW]
[ROW][C]Gaussian[/C][C]93.7377690802348[/C][C]0.0121157807477659[/C][/ROW]
[ROW][C]Epanechnikov[/C][C]94.9510763209393[/C][C]0.0106539400813084[/C][/ROW]
[ROW][C]Rectangular[/C][C]98.5909980430528[/C][C]0.0094967201141213[/C][/ROW]
[ROW][C]Triangular[/C][C]90.0978473581213[/C][C]0.0118292973437474[/C][/ROW]
[ROW][C]Biweight[/C][C]94.9510763209393[/C][C]0.0111023460714745[/C][/ROW]
[ROW][C]Cosine[/C][C]94.9510763209393[/C][C]0.0112645241879143[/C][/ROW]
[ROW][C]Optcosine[/C][C]94.9510763209393[/C][C]0.0108008702437607[/C][/ROW]
 [/TABLE]
Source: https://freestatistics.org/blog/index.php?pk=232509&T=40
Globally Unique Identifier (entire table): ba.freestatistics.org/blog/index.php?pk=232509&T=40
As an alternative you can also use a QR Code:
The GUIDs for individual cells are displayed in the table below:
| Maximum Density Values | | Kernel | x-value | max. density | | Gaussian | 93.7377690802348 | 0.0121157807477659 | | Epanechnikov | 94.9510763209393 | 0.0106539400813084 | | Rectangular | 98.5909980430528 | 0.0094967201141213 | | Triangular | 90.0978473581213 | 0.0118292973437474 | | Biweight | 94.9510763209393 | 0.0111023460714745 | | Cosine | 94.9510763209393 | 0.0112645241879143 | | Optcosine | 94.9510763209393 | 0.0108008702437607 |
If you paste this QR Code into your document, anyone with a smartphone or tablet will be able to scan it and view this table in a browser.
If you paste this QR Code into your document, anyone with a smartphone or tablet will be able to scan it and view this table in a browser.
If you paste this QR Code into your document, anyone with a smartphone or tablet will be able to scan it and view this table in a browser.
If you paste this QR Code into your document, anyone with a smartphone or tablet will be able to scan it and view this table in a browser.
If you paste this QR Code into your document, anyone with a smartphone or tablet will be able to scan it and view this table in a browser.
| Maximum Density Values | | Kernel | x-value | max. density | | Gaussian | 93.7377690802348 | 0.0121157807477659 | | Epanechnikov | 94.9510763209393 | 0.0106539400813084 | | Rectangular | 99.1976516634051 | 0.0094967201141213 | | Triangular | 90.0978473581213 | 0.0118292973437474 | | Biweight | 94.9510763209393 | 0.0111023460714745 | | Cosine | 94.9510763209393 | 0.0112645241879143 | | Optcosine | 94.9510763209393 | 0.0108008702437607 |
\begin{tabular}{lllllllll}
\hline
Maximum Density Values \tabularnewline
Kernel & x-value & max. density \tabularnewline
Gaussian & 93.7377690802348 & 0.0121157807477659 \tabularnewline
Epanechnikov & 94.9510763209393 & 0.0106539400813084 \tabularnewline
Rectangular & 99.1976516634051 & 0.0094967201141213 \tabularnewline
Triangular & 90.0978473581213 & 0.0118292973437474 \tabularnewline
Biweight & 94.9510763209393 & 0.0111023460714745 \tabularnewline
Cosine & 94.9510763209393 & 0.0112645241879143 \tabularnewline
Optcosine & 94.9510763209393 & 0.0108008702437607 \tabularnewline
 \hline
\end{tabular}
%Source: https://freestatistics.org/blog/index.php?pk=232509&T=41
[TABLE]
[ROW][C]Maximum Density Values[/C][/ROW]
[ROW][C]Kernel[/C][C]x-value[/C][C]max. density[/C][/ROW]
[ROW][C]Gaussian[/C][C]93.7377690802348[/C][C]0.0121157807477659[/C][/ROW]
[ROW][C]Epanechnikov[/C][C]94.9510763209393[/C][C]0.0106539400813084[/C][/ROW]
[ROW][C]Rectangular[/C][C]99.1976516634051[/C][C]0.0094967201141213[/C][/ROW]
[ROW][C]Triangular[/C][C]90.0978473581213[/C][C]0.0118292973437474[/C][/ROW]
[ROW][C]Biweight[/C][C]94.9510763209393[/C][C]0.0111023460714745[/C][/ROW]
[ROW][C]Cosine[/C][C]94.9510763209393[/C][C]0.0112645241879143[/C][/ROW]
[ROW][C]Optcosine[/C][C]94.9510763209393[/C][C]0.0108008702437607[/C][/ROW]
 [/TABLE]
Source: https://freestatistics.org/blog/index.php?pk=232509&T=41
Globally Unique Identifier (entire table): ba.freestatistics.org/blog/index.php?pk=232509&T=41
As an alternative you can also use a QR Code:
The GUIDs for individual cells are displayed in the table below:
| Maximum Density Values | | Kernel | x-value | max. density | | Gaussian | 93.7377690802348 | 0.0121157807477659 | | Epanechnikov | 94.9510763209393 | 0.0106539400813084 | | Rectangular | 99.1976516634051 | 0.0094967201141213 | | Triangular | 90.0978473581213 | 0.0118292973437474 | | Biweight | 94.9510763209393 | 0.0111023460714745 | | Cosine | 94.9510763209393 | 0.0112645241879143 | | Optcosine | 94.9510763209393 | 0.0108008702437607 |
If you paste this QR Code into your document, anyone with a smartphone or tablet will be able to scan it and view this table in a browser.
If you paste this QR Code into your document, anyone with a smartphone or tablet will be able to scan it and view this table in a browser.
If you paste this QR Code into your document, anyone with a smartphone or tablet will be able to scan it and view this table in a browser.
If you paste this QR Code into your document, anyone with a smartphone or tablet will be able to scan it and view this table in a browser.
If you paste this QR Code into your document, anyone with a smartphone or tablet will be able to scan it and view this table in a browser.
| Maximum Density Values | | Kernel | x-value | max. density | | Gaussian | 93.7377690802348 | 0.0121157807477659 | | Epanechnikov | 94.9510763209393 | 0.0106539400813084 | | Rectangular | 99.8043052837573 | 0.0094967201141213 | | Triangular | 90.0978473581213 | 0.0118292973437474 | | Biweight | 94.9510763209393 | 0.0111023460714745 | | Cosine | 94.9510763209393 | 0.0112645241879143 | | Optcosine | 94.9510763209393 | 0.0108008702437607 |
\begin{tabular}{lllllllll}
\hline
Maximum Density Values \tabularnewline
Kernel & x-value & max. density \tabularnewline
Gaussian & 93.7377690802348 & 0.0121157807477659 \tabularnewline
Epanechnikov & 94.9510763209393 & 0.0106539400813084 \tabularnewline
Rectangular & 99.8043052837573 & 0.0094967201141213 \tabularnewline
Triangular & 90.0978473581213 & 0.0118292973437474 \tabularnewline
Biweight & 94.9510763209393 & 0.0111023460714745 \tabularnewline
Cosine & 94.9510763209393 & 0.0112645241879143 \tabularnewline
Optcosine & 94.9510763209393 & 0.0108008702437607 \tabularnewline
 \hline
\end{tabular}
%Source: https://freestatistics.org/blog/index.php?pk=232509&T=42
[TABLE]
[ROW][C]Maximum Density Values[/C][/ROW]
[ROW][C]Kernel[/C][C]x-value[/C][C]max. density[/C][/ROW]
[ROW][C]Gaussian[/C][C]93.7377690802348[/C][C]0.0121157807477659[/C][/ROW]
[ROW][C]Epanechnikov[/C][C]94.9510763209393[/C][C]0.0106539400813084[/C][/ROW]
[ROW][C]Rectangular[/C][C]99.8043052837573[/C][C]0.0094967201141213[/C][/ROW]
[ROW][C]Triangular[/C][C]90.0978473581213[/C][C]0.0118292973437474[/C][/ROW]
[ROW][C]Biweight[/C][C]94.9510763209393[/C][C]0.0111023460714745[/C][/ROW]
[ROW][C]Cosine[/C][C]94.9510763209393[/C][C]0.0112645241879143[/C][/ROW]
[ROW][C]Optcosine[/C][C]94.9510763209393[/C][C]0.0108008702437607[/C][/ROW]
 [/TABLE]
Source: https://freestatistics.org/blog/index.php?pk=232509&T=42
Globally Unique Identifier (entire table): ba.freestatistics.org/blog/index.php?pk=232509&T=42
As an alternative you can also use a QR Code:
The GUIDs for individual cells are displayed in the table below:
| Maximum Density Values | | Kernel | x-value | max. density | | Gaussian | 93.7377690802348 | 0.0121157807477659 | | Epanechnikov | 94.9510763209393 | 0.0106539400813084 | | Rectangular | 99.8043052837573 | 0.0094967201141213 | | Triangular | 90.0978473581213 | 0.0118292973437474 | | Biweight | 94.9510763209393 | 0.0111023460714745 | | Cosine | 94.9510763209393 | 0.0112645241879143 | | Optcosine | 94.9510763209393 | 0.0108008702437607 |
If you paste this QR Code into your document, anyone with a smartphone or tablet will be able to scan it and view this table in a browser.
If you paste this QR Code into your document, anyone with a smartphone or tablet will be able to scan it and view this table in a browser.
If you paste this QR Code into your document, anyone with a smartphone or tablet will be able to scan it and view this table in a browser.
If you paste this QR Code into your document, anyone with a smartphone or tablet will be able to scan it and view this table in a browser.
If you paste this QR Code into your document, anyone with a smartphone or tablet will be able to scan it and view this table in a browser.
| Maximum Density Values | | Kernel | x-value | max. density | | Gaussian | 93.7377690802348 | 0.0121157807477659 | | Epanechnikov | 94.9510763209393 | 0.0106539400813084 | | Rectangular | 100.41095890411 | 0.0094967201141213 | | Triangular | 90.0978473581213 | 0.0118292973437474 | | Biweight | 94.9510763209393 | 0.0111023460714745 | | Cosine | 94.9510763209393 | 0.0112645241879143 | | Optcosine | 94.9510763209393 | 0.0108008702437607 |
\begin{tabular}{lllllllll}
\hline
Maximum Density Values \tabularnewline
Kernel & x-value & max. density \tabularnewline
Gaussian & 93.7377690802348 & 0.0121157807477659 \tabularnewline
Epanechnikov & 94.9510763209393 & 0.0106539400813084 \tabularnewline
Rectangular & 100.41095890411 & 0.0094967201141213 \tabularnewline
Triangular & 90.0978473581213 & 0.0118292973437474 \tabularnewline
Biweight & 94.9510763209393 & 0.0111023460714745 \tabularnewline
Cosine & 94.9510763209393 & 0.0112645241879143 \tabularnewline
Optcosine & 94.9510763209393 & 0.0108008702437607 \tabularnewline
 \hline
\end{tabular}
%Source: https://freestatistics.org/blog/index.php?pk=232509&T=43
[TABLE]
[ROW][C]Maximum Density Values[/C][/ROW]
[ROW][C]Kernel[/C][C]x-value[/C][C]max. density[/C][/ROW]
[ROW][C]Gaussian[/C][C]93.7377690802348[/C][C]0.0121157807477659[/C][/ROW]
[ROW][C]Epanechnikov[/C][C]94.9510763209393[/C][C]0.0106539400813084[/C][/ROW]
[ROW][C]Rectangular[/C][C]100.41095890411[/C][C]0.0094967201141213[/C][/ROW]
[ROW][C]Triangular[/C][C]90.0978473581213[/C][C]0.0118292973437474[/C][/ROW]
[ROW][C]Biweight[/C][C]94.9510763209393[/C][C]0.0111023460714745[/C][/ROW]
[ROW][C]Cosine[/C][C]94.9510763209393[/C][C]0.0112645241879143[/C][/ROW]
[ROW][C]Optcosine[/C][C]94.9510763209393[/C][C]0.0108008702437607[/C][/ROW]
 [/TABLE]
Source: https://freestatistics.org/blog/index.php?pk=232509&T=43
Globally Unique Identifier (entire table): ba.freestatistics.org/blog/index.php?pk=232509&T=43
As an alternative you can also use a QR Code:
The GUIDs for individual cells are displayed in the table below:
| Maximum Density Values | | Kernel | x-value | max. density | | Gaussian | 93.7377690802348 | 0.0121157807477659 | | Epanechnikov | 94.9510763209393 | 0.0106539400813084 | | Rectangular | 100.41095890411 | 0.0094967201141213 | | Triangular | 90.0978473581213 | 0.0118292973437474 | | Biweight | 94.9510763209393 | 0.0111023460714745 | | Cosine | 94.9510763209393 | 0.0112645241879143 | | Optcosine | 94.9510763209393 | 0.0108008702437607 |
If you paste this QR Code into your document, anyone with a smartphone or tablet will be able to scan it and view this table in a browser.
If you paste this QR Code into your document, anyone with a smartphone or tablet will be able to scan it and view this table in a browser.
If you paste this QR Code into your document, anyone with a smartphone or tablet will be able to scan it and view this table in a browser.
If you paste this QR Code into your document, anyone with a smartphone or tablet will be able to scan it and view this table in a browser.
If you paste this QR Code into your document, anyone with a smartphone or tablet will be able to scan it and view this table in a browser.
| Maximum Density Values | | Kernel | x-value | max. density | | Gaussian | 93.7377690802348 | 0.0121157807477659 | | Epanechnikov | 94.9510763209393 | 0.0106539400813084 | | Rectangular | 101.017612524462 | 0.0094967201141213 | | Triangular | 90.0978473581213 | 0.0118292973437474 | | Biweight | 94.9510763209393 | 0.0111023460714745 | | Cosine | 94.9510763209393 | 0.0112645241879143 | | Optcosine | 94.9510763209393 | 0.0108008702437607 |
\begin{tabular}{lllllllll}
\hline
Maximum Density Values \tabularnewline
Kernel & x-value & max. density \tabularnewline
Gaussian & 93.7377690802348 & 0.0121157807477659 \tabularnewline
Epanechnikov & 94.9510763209393 & 0.0106539400813084 \tabularnewline
Rectangular & 101.017612524462 & 0.0094967201141213 \tabularnewline
Triangular & 90.0978473581213 & 0.0118292973437474 \tabularnewline
Biweight & 94.9510763209393 & 0.0111023460714745 \tabularnewline
Cosine & 94.9510763209393 & 0.0112645241879143 \tabularnewline
Optcosine & 94.9510763209393 & 0.0108008702437607 \tabularnewline
 \hline
\end{tabular}
%Source: https://freestatistics.org/blog/index.php?pk=232509&T=44
[TABLE]
[ROW][C]Maximum Density Values[/C][/ROW]
[ROW][C]Kernel[/C][C]x-value[/C][C]max. density[/C][/ROW]
[ROW][C]Gaussian[/C][C]93.7377690802348[/C][C]0.0121157807477659[/C][/ROW]
[ROW][C]Epanechnikov[/C][C]94.9510763209393[/C][C]0.0106539400813084[/C][/ROW]
[ROW][C]Rectangular[/C][C]101.017612524462[/C][C]0.0094967201141213[/C][/ROW]
[ROW][C]Triangular[/C][C]90.0978473581213[/C][C]0.0118292973437474[/C][/ROW]
[ROW][C]Biweight[/C][C]94.9510763209393[/C][C]0.0111023460714745[/C][/ROW]
[ROW][C]Cosine[/C][C]94.9510763209393[/C][C]0.0112645241879143[/C][/ROW]
[ROW][C]Optcosine[/C][C]94.9510763209393[/C][C]0.0108008702437607[/C][/ROW]
 [/TABLE]
Source: https://freestatistics.org/blog/index.php?pk=232509&T=44
Globally Unique Identifier (entire table): ba.freestatistics.org/blog/index.php?pk=232509&T=44
As an alternative you can also use a QR Code:
The GUIDs for individual cells are displayed in the table below:
| Maximum Density Values | | Kernel | x-value | max. density | | Gaussian | 93.7377690802348 | 0.0121157807477659 | | Epanechnikov | 94.9510763209393 | 0.0106539400813084 | | Rectangular | 101.017612524462 | 0.0094967201141213 | | Triangular | 90.0978473581213 | 0.0118292973437474 | | Biweight | 94.9510763209393 | 0.0111023460714745 | | Cosine | 94.9510763209393 | 0.0112645241879143 | | Optcosine | 94.9510763209393 | 0.0108008702437607 |
If you paste this QR Code into your document, anyone with a smartphone or tablet will be able to scan it and view this table in a browser.
If you paste this QR Code into your document, anyone with a smartphone or tablet will be able to scan it and view this table in a browser.
If you paste this QR Code into your document, anyone with a smartphone or tablet will be able to scan it and view this table in a browser.
If you paste this QR Code into your document, anyone with a smartphone or tablet will be able to scan it and view this table in a browser.
If you paste this QR Code into your document, anyone with a smartphone or tablet will be able to scan it and view this table in a browser.
| Maximum Density Values | | Kernel | x-value | max. density | | Gaussian | 93.7377690802348 | 0.0121157807477659 | | Epanechnikov | 94.9510763209393 | 0.0106539400813084 | | Rectangular | 101.624266144814 | 0.0094967201141213 | | Triangular | 90.0978473581213 | 0.0118292973437474 | | Biweight | 94.9510763209393 | 0.0111023460714745 | | Cosine | 94.9510763209393 | 0.0112645241879143 | | Optcosine | 94.9510763209393 | 0.0108008702437607 |
\begin{tabular}{lllllllll}
\hline
Maximum Density Values \tabularnewline
Kernel & x-value & max. density \tabularnewline
Gaussian & 93.7377690802348 & 0.0121157807477659 \tabularnewline
Epanechnikov & 94.9510763209393 & 0.0106539400813084 \tabularnewline
Rectangular & 101.624266144814 & 0.0094967201141213 \tabularnewline
Triangular & 90.0978473581213 & 0.0118292973437474 \tabularnewline
Biweight & 94.9510763209393 & 0.0111023460714745 \tabularnewline
Cosine & 94.9510763209393 & 0.0112645241879143 \tabularnewline
Optcosine & 94.9510763209393 & 0.0108008702437607 \tabularnewline
 \hline
\end{tabular}
%Source: https://freestatistics.org/blog/index.php?pk=232509&T=45
[TABLE]
[ROW][C]Maximum Density Values[/C][/ROW]
[ROW][C]Kernel[/C][C]x-value[/C][C]max. density[/C][/ROW]
[ROW][C]Gaussian[/C][C]93.7377690802348[/C][C]0.0121157807477659[/C][/ROW]
[ROW][C]Epanechnikov[/C][C]94.9510763209393[/C][C]0.0106539400813084[/C][/ROW]
[ROW][C]Rectangular[/C][C]101.624266144814[/C][C]0.0094967201141213[/C][/ROW]
[ROW][C]Triangular[/C][C]90.0978473581213[/C][C]0.0118292973437474[/C][/ROW]
[ROW][C]Biweight[/C][C]94.9510763209393[/C][C]0.0111023460714745[/C][/ROW]
[ROW][C]Cosine[/C][C]94.9510763209393[/C][C]0.0112645241879143[/C][/ROW]
[ROW][C]Optcosine[/C][C]94.9510763209393[/C][C]0.0108008702437607[/C][/ROW]
 [/TABLE]
Source: https://freestatistics.org/blog/index.php?pk=232509&T=45
Globally Unique Identifier (entire table): ba.freestatistics.org/blog/index.php?pk=232509&T=45
As an alternative you can also use a QR Code:
The GUIDs for individual cells are displayed in the table below:
| Maximum Density Values | | Kernel | x-value | max. density | | Gaussian | 93.7377690802348 | 0.0121157807477659 | | Epanechnikov | 94.9510763209393 | 0.0106539400813084 | | Rectangular | 101.624266144814 | 0.0094967201141213 | | Triangular | 90.0978473581213 | 0.0118292973437474 | | Biweight | 94.9510763209393 | 0.0111023460714745 | | Cosine | 94.9510763209393 | 0.0112645241879143 | | Optcosine | 94.9510763209393 | 0.0108008702437607 |
If you paste this QR Code into your document, anyone with a smartphone or tablet will be able to scan it and view this table in a browser.
If you paste this QR Code into your document, anyone with a smartphone or tablet will be able to scan it and view this table in a browser.
If you paste this QR Code into your document, anyone with a smartphone or tablet will be able to scan it and view this table in a browser.
If you paste this QR Code into your document, anyone with a smartphone or tablet will be able to scan it and view this table in a browser.
If you paste this QR Code into your document, anyone with a smartphone or tablet will be able to scan it and view this table in a browser.
| Maximum Density Values | | Kernel | x-value | max. density | | Gaussian | 93.7377690802348 | 0.0121157807477659 | | Epanechnikov | 94.9510763209393 | 0.0106539400813084 | | Rectangular | 102.230919765166 | 0.0094967201141213 | | Triangular | 90.0978473581213 | 0.0118292973437474 | | Biweight | 94.9510763209393 | 0.0111023460714745 | | Cosine | 94.9510763209393 | 0.0112645241879143 | | Optcosine | 94.9510763209393 | 0.0108008702437607 |
\begin{tabular}{lllllllll}
\hline
Maximum Density Values \tabularnewline
Kernel & x-value & max. density \tabularnewline
Gaussian & 93.7377690802348 & 0.0121157807477659 \tabularnewline
Epanechnikov & 94.9510763209393 & 0.0106539400813084 \tabularnewline
Rectangular & 102.230919765166 & 0.0094967201141213 \tabularnewline
Triangular & 90.0978473581213 & 0.0118292973437474 \tabularnewline
Biweight & 94.9510763209393 & 0.0111023460714745 \tabularnewline
Cosine & 94.9510763209393 & 0.0112645241879143 \tabularnewline
Optcosine & 94.9510763209393 & 0.0108008702437607 \tabularnewline
 \hline
\end{tabular}
%Source: https://freestatistics.org/blog/index.php?pk=232509&T=46
[TABLE]
[ROW][C]Maximum Density Values[/C][/ROW]
[ROW][C]Kernel[/C][C]x-value[/C][C]max. density[/C][/ROW]
[ROW][C]Gaussian[/C][C]93.7377690802348[/C][C]0.0121157807477659[/C][/ROW]
[ROW][C]Epanechnikov[/C][C]94.9510763209393[/C][C]0.0106539400813084[/C][/ROW]
[ROW][C]Rectangular[/C][C]102.230919765166[/C][C]0.0094967201141213[/C][/ROW]
[ROW][C]Triangular[/C][C]90.0978473581213[/C][C]0.0118292973437474[/C][/ROW]
[ROW][C]Biweight[/C][C]94.9510763209393[/C][C]0.0111023460714745[/C][/ROW]
[ROW][C]Cosine[/C][C]94.9510763209393[/C][C]0.0112645241879143[/C][/ROW]
[ROW][C]Optcosine[/C][C]94.9510763209393[/C][C]0.0108008702437607[/C][/ROW]
 [/TABLE]
Source: https://freestatistics.org/blog/index.php?pk=232509&T=46
Globally Unique Identifier (entire table): ba.freestatistics.org/blog/index.php?pk=232509&T=46
As an alternative you can also use a QR Code:
The GUIDs for individual cells are displayed in the table below:
| Maximum Density Values | | Kernel | x-value | max. density | | Gaussian | 93.7377690802348 | 0.0121157807477659 | | Epanechnikov | 94.9510763209393 | 0.0106539400813084 | | Rectangular | 102.230919765166 | 0.0094967201141213 | | Triangular | 90.0978473581213 | 0.0118292973437474 | | Biweight | 94.9510763209393 | 0.0111023460714745 | | Cosine | 94.9510763209393 | 0.0112645241879143 | | Optcosine | 94.9510763209393 | 0.0108008702437607 |
If you paste this QR Code into your document, anyone with a smartphone or tablet will be able to scan it and view this table in a browser.
If you paste this QR Code into your document, anyone with a smartphone or tablet will be able to scan it and view this table in a browser.
If you paste this QR Code into your document, anyone with a smartphone or tablet will be able to scan it and view this table in a browser.
If you paste this QR Code into your document, anyone with a smartphone or tablet will be able to scan it and view this table in a browser.
If you paste this QR Code into your document, anyone with a smartphone or tablet will be able to scan it and view this table in a browser.
| Maximum Density Values | | Kernel | x-value | max. density | | Gaussian | 93.7377690802348 | 0.0121157807477659 | | Epanechnikov | 94.9510763209393 | 0.0106539400813084 | | Rectangular | 102.837573385519 | 0.0094967201141213 | | Triangular | 90.0978473581213 | 0.0118292973437474 | | Biweight | 94.9510763209393 | 0.0111023460714745 | | Cosine | 94.9510763209393 | 0.0112645241879143 | | Optcosine | 94.9510763209393 | 0.0108008702437607 |
\begin{tabular}{lllllllll}
\hline
Maximum Density Values \tabularnewline
Kernel & x-value & max. density \tabularnewline
Gaussian & 93.7377690802348 & 0.0121157807477659 \tabularnewline
Epanechnikov & 94.9510763209393 & 0.0106539400813084 \tabularnewline
Rectangular & 102.837573385519 & 0.0094967201141213 \tabularnewline
Triangular & 90.0978473581213 & 0.0118292973437474 \tabularnewline
Biweight & 94.9510763209393 & 0.0111023460714745 \tabularnewline
Cosine & 94.9510763209393 & 0.0112645241879143 \tabularnewline
Optcosine & 94.9510763209393 & 0.0108008702437607 \tabularnewline
 \hline
\end{tabular}
%Source: https://freestatistics.org/blog/index.php?pk=232509&T=47
[TABLE]
[ROW][C]Maximum Density Values[/C][/ROW]
[ROW][C]Kernel[/C][C]x-value[/C][C]max. density[/C][/ROW]
[ROW][C]Gaussian[/C][C]93.7377690802348[/C][C]0.0121157807477659[/C][/ROW]
[ROW][C]Epanechnikov[/C][C]94.9510763209393[/C][C]0.0106539400813084[/C][/ROW]
[ROW][C]Rectangular[/C][C]102.837573385519[/C][C]0.0094967201141213[/C][/ROW]
[ROW][C]Triangular[/C][C]90.0978473581213[/C][C]0.0118292973437474[/C][/ROW]
[ROW][C]Biweight[/C][C]94.9510763209393[/C][C]0.0111023460714745[/C][/ROW]
[ROW][C]Cosine[/C][C]94.9510763209393[/C][C]0.0112645241879143[/C][/ROW]
[ROW][C]Optcosine[/C][C]94.9510763209393[/C][C]0.0108008702437607[/C][/ROW]
 [/TABLE]
Source: https://freestatistics.org/blog/index.php?pk=232509&T=47
Globally Unique Identifier (entire table): ba.freestatistics.org/blog/index.php?pk=232509&T=47
As an alternative you can also use a QR Code:
The GUIDs for individual cells are displayed in the table below:
| Maximum Density Values | | Kernel | x-value | max. density | | Gaussian | 93.7377690802348 | 0.0121157807477659 | | Epanechnikov | 94.9510763209393 | 0.0106539400813084 | | Rectangular | 102.837573385519 | 0.0094967201141213 | | Triangular | 90.0978473581213 | 0.0118292973437474 | | Biweight | 94.9510763209393 | 0.0111023460714745 | | Cosine | 94.9510763209393 | 0.0112645241879143 | | Optcosine | 94.9510763209393 | 0.0108008702437607 |
If you paste this QR Code into your document, anyone with a smartphone or tablet will be able to scan it and view this table in a browser.
If you paste this QR Code into your document, anyone with a smartphone or tablet will be able to scan it and view this table in a browser.
If you paste this QR Code into your document, anyone with a smartphone or tablet will be able to scan it and view this table in a browser.
If you paste this QR Code into your document, anyone with a smartphone or tablet will be able to scan it and view this table in a browser.
If you paste this QR Code into your document, anyone with a smartphone or tablet will be able to scan it and view this table in a browser.
| Maximum Density Values | | Kernel | x-value | max. density | | Gaussian | 93.7377690802348 | 0.0121157807477659 | | Epanechnikov | 94.9510763209393 | 0.0106539400813084 | | Rectangular | 103.444227005871 | 0.0094967201141213 | | Triangular | 90.0978473581213 | 0.0118292973437474 | | Biweight | 94.9510763209393 | 0.0111023460714745 | | Cosine | 94.9510763209393 | 0.0112645241879143 | | Optcosine | 94.9510763209393 | 0.0108008702437607 |
\begin{tabular}{lllllllll}
\hline
Maximum Density Values \tabularnewline
Kernel & x-value & max. density \tabularnewline
Gaussian & 93.7377690802348 & 0.0121157807477659 \tabularnewline
Epanechnikov & 94.9510763209393 & 0.0106539400813084 \tabularnewline
Rectangular & 103.444227005871 & 0.0094967201141213 \tabularnewline
Triangular & 90.0978473581213 & 0.0118292973437474 \tabularnewline
Biweight & 94.9510763209393 & 0.0111023460714745 \tabularnewline
Cosine & 94.9510763209393 & 0.0112645241879143 \tabularnewline
Optcosine & 94.9510763209393 & 0.0108008702437607 \tabularnewline
 \hline
\end{tabular}
%Source: https://freestatistics.org/blog/index.php?pk=232509&T=48
[TABLE]
[ROW][C]Maximum Density Values[/C][/ROW]
[ROW][C]Kernel[/C][C]x-value[/C][C]max. density[/C][/ROW]
[ROW][C]Gaussian[/C][C]93.7377690802348[/C][C]0.0121157807477659[/C][/ROW]
[ROW][C]Epanechnikov[/C][C]94.9510763209393[/C][C]0.0106539400813084[/C][/ROW]
[ROW][C]Rectangular[/C][C]103.444227005871[/C][C]0.0094967201141213[/C][/ROW]
[ROW][C]Triangular[/C][C]90.0978473581213[/C][C]0.0118292973437474[/C][/ROW]
[ROW][C]Biweight[/C][C]94.9510763209393[/C][C]0.0111023460714745[/C][/ROW]
[ROW][C]Cosine[/C][C]94.9510763209393[/C][C]0.0112645241879143[/C][/ROW]
[ROW][C]Optcosine[/C][C]94.9510763209393[/C][C]0.0108008702437607[/C][/ROW]
 [/TABLE]
Source: https://freestatistics.org/blog/index.php?pk=232509&T=48
Globally Unique Identifier (entire table): ba.freestatistics.org/blog/index.php?pk=232509&T=48
As an alternative you can also use a QR Code:
The GUIDs for individual cells are displayed in the table below:
| Maximum Density Values | | Kernel | x-value | max. density | | Gaussian | 93.7377690802348 | 0.0121157807477659 | | Epanechnikov | 94.9510763209393 | 0.0106539400813084 | | Rectangular | 103.444227005871 | 0.0094967201141213 | | Triangular | 90.0978473581213 | 0.0118292973437474 | | Biweight | 94.9510763209393 | 0.0111023460714745 | | Cosine | 94.9510763209393 | 0.0112645241879143 | | Optcosine | 94.9510763209393 | 0.0108008702437607 |
If you paste this QR Code into your document, anyone with a smartphone or tablet will be able to scan it and view this table in a browser.
If you paste this QR Code into your document, anyone with a smartphone or tablet will be able to scan it and view this table in a browser.
If you paste this QR Code into your document, anyone with a smartphone or tablet will be able to scan it and view this table in a browser.
If you paste this QR Code into your document, anyone with a smartphone or tablet will be able to scan it and view this table in a browser.
If you paste this QR Code into your document, anyone with a smartphone or tablet will be able to scan it and view this table in a browser.
| Maximum Density Values | | Kernel | x-value | max. density | | Gaussian | 93.7377690802348 | 0.0121157807477659 | | Epanechnikov | 94.9510763209393 | 0.0106539400813084 | | Rectangular | 104.050880626223 | 0.0094967201141213 | | Triangular | 90.0978473581213 | 0.0118292973437474 | | Biweight | 94.9510763209393 | 0.0111023460714745 | | Cosine | 94.9510763209393 | 0.0112645241879143 | | Optcosine | 94.9510763209393 | 0.0108008702437607 |
\begin{tabular}{lllllllll}
\hline
Maximum Density Values \tabularnewline
Kernel & x-value & max. density \tabularnewline
Gaussian & 93.7377690802348 & 0.0121157807477659 \tabularnewline
Epanechnikov & 94.9510763209393 & 0.0106539400813084 \tabularnewline
Rectangular & 104.050880626223 & 0.0094967201141213 \tabularnewline
Triangular & 90.0978473581213 & 0.0118292973437474 \tabularnewline
Biweight & 94.9510763209393 & 0.0111023460714745 \tabularnewline
Cosine & 94.9510763209393 & 0.0112645241879143 \tabularnewline
Optcosine & 94.9510763209393 & 0.0108008702437607 \tabularnewline
 \hline
\end{tabular}
%Source: https://freestatistics.org/blog/index.php?pk=232509&T=49
[TABLE]
[ROW][C]Maximum Density Values[/C][/ROW]
[ROW][C]Kernel[/C][C]x-value[/C][C]max. density[/C][/ROW]
[ROW][C]Gaussian[/C][C]93.7377690802348[/C][C]0.0121157807477659[/C][/ROW]
[ROW][C]Epanechnikov[/C][C]94.9510763209393[/C][C]0.0106539400813084[/C][/ROW]
[ROW][C]Rectangular[/C][C]104.050880626223[/C][C]0.0094967201141213[/C][/ROW]
[ROW][C]Triangular[/C][C]90.0978473581213[/C][C]0.0118292973437474[/C][/ROW]
[ROW][C]Biweight[/C][C]94.9510763209393[/C][C]0.0111023460714745[/C][/ROW]
[ROW][C]Cosine[/C][C]94.9510763209393[/C][C]0.0112645241879143[/C][/ROW]
[ROW][C]Optcosine[/C][C]94.9510763209393[/C][C]0.0108008702437607[/C][/ROW]
 [/TABLE]
Source: https://freestatistics.org/blog/index.php?pk=232509&T=49
Globally Unique Identifier (entire table): ba.freestatistics.org/blog/index.php?pk=232509&T=49
As an alternative you can also use a QR Code:
The GUIDs for individual cells are displayed in the table below:
| Maximum Density Values | | Kernel | x-value | max. density | | Gaussian | 93.7377690802348 | 0.0121157807477659 | | Epanechnikov | 94.9510763209393 | 0.0106539400813084 | | Rectangular | 104.050880626223 | 0.0094967201141213 | | Triangular | 90.0978473581213 | 0.0118292973437474 | | Biweight | 94.9510763209393 | 0.0111023460714745 | | Cosine | 94.9510763209393 | 0.0112645241879143 | | Optcosine | 94.9510763209393 | 0.0108008702437607 |
If you paste this QR Code into your document, anyone with a smartphone or tablet will be able to scan it and view this table in a browser.
If you paste this QR Code into your document, anyone with a smartphone or tablet will be able to scan it and view this table in a browser.
If you paste this QR Code into your document, anyone with a smartphone or tablet will be able to scan it and view this table in a browser.
If you paste this QR Code into your document, anyone with a smartphone or tablet will be able to scan it and view this table in a browser.
If you paste this QR Code into your document, anyone with a smartphone or tablet will be able to scan it and view this table in a browser.
| Maximum Density Values | | Kernel | x-value | max. density | | Gaussian | 93.7377690802348 | 0.0121157807477659 | | Epanechnikov | 94.9510763209393 | 0.0106539400813084 | | Rectangular | 104.657534246575 | 0.0094967201141213 | | Triangular | 90.0978473581213 | 0.0118292973437474 | | Biweight | 94.9510763209393 | 0.0111023460714745 | | Cosine | 94.9510763209393 | 0.0112645241879143 | | Optcosine | 94.9510763209393 | 0.0108008702437607 |
\begin{tabular}{lllllllll}
\hline
Maximum Density Values \tabularnewline
Kernel & x-value & max. density \tabularnewline
Gaussian & 93.7377690802348 & 0.0121157807477659 \tabularnewline
Epanechnikov & 94.9510763209393 & 0.0106539400813084 \tabularnewline
Rectangular & 104.657534246575 & 0.0094967201141213 \tabularnewline
Triangular & 90.0978473581213 & 0.0118292973437474 \tabularnewline
Biweight & 94.9510763209393 & 0.0111023460714745 \tabularnewline
Cosine & 94.9510763209393 & 0.0112645241879143 \tabularnewline
Optcosine & 94.9510763209393 & 0.0108008702437607 \tabularnewline
 \hline
\end{tabular}
%Source: https://freestatistics.org/blog/index.php?pk=232509&T=50
[TABLE]
[ROW][C]Maximum Density Values[/C][/ROW]
[ROW][C]Kernel[/C][C]x-value[/C][C]max. density[/C][/ROW]
[ROW][C]Gaussian[/C][C]93.7377690802348[/C][C]0.0121157807477659[/C][/ROW]
[ROW][C]Epanechnikov[/C][C]94.9510763209393[/C][C]0.0106539400813084[/C][/ROW]
[ROW][C]Rectangular[/C][C]104.657534246575[/C][C]0.0094967201141213[/C][/ROW]
[ROW][C]Triangular[/C][C]90.0978473581213[/C][C]0.0118292973437474[/C][/ROW]
[ROW][C]Biweight[/C][C]94.9510763209393[/C][C]0.0111023460714745[/C][/ROW]
[ROW][C]Cosine[/C][C]94.9510763209393[/C][C]0.0112645241879143[/C][/ROW]
[ROW][C]Optcosine[/C][C]94.9510763209393[/C][C]0.0108008702437607[/C][/ROW]
 [/TABLE]
Source: https://freestatistics.org/blog/index.php?pk=232509&T=50
Globally Unique Identifier (entire table): ba.freestatistics.org/blog/index.php?pk=232509&T=50
As an alternative you can also use a QR Code:
The GUIDs for individual cells are displayed in the table below:
| Maximum Density Values | | Kernel | x-value | max. density | | Gaussian | 93.7377690802348 | 0.0121157807477659 | | Epanechnikov | 94.9510763209393 | 0.0106539400813084 | | Rectangular | 104.657534246575 | 0.0094967201141213 | | Triangular | 90.0978473581213 | 0.0118292973437474 | | Biweight | 94.9510763209393 | 0.0111023460714745 | | Cosine | 94.9510763209393 | 0.0112645241879143 | | Optcosine | 94.9510763209393 | 0.0108008702437607 |
If you paste this QR Code into your document, anyone with a smartphone or tablet will be able to scan it and view this table in a browser.
If you paste this QR Code into your document, anyone with a smartphone or tablet will be able to scan it and view this table in a browser.
If you paste this QR Code into your document, anyone with a smartphone or tablet will be able to scan it and view this table in a browser.
If you paste this QR Code into your document, anyone with a smartphone or tablet will be able to scan it and view this table in a browser.
If you paste this QR Code into your document, anyone with a smartphone or tablet will be able to scan it and view this table in a browser.
| Maximum Density Values | | Kernel | x-value | max. density | | Gaussian | 93.7377690802348 | 0.0121157807477659 | | Epanechnikov | 94.9510763209393 | 0.0106539400813084 | | Rectangular | 107.690802348337 | 0.0094967201141213 | | Triangular | 90.0978473581213 | 0.0118292973437474 | | Biweight | 94.9510763209393 | 0.0111023460714745 | | Cosine | 94.9510763209393 | 0.0112645241879143 | | Optcosine | 94.9510763209393 | 0.0108008702437607 |
\begin{tabular}{lllllllll}
\hline
Maximum Density Values \tabularnewline
Kernel & x-value & max. density \tabularnewline
Gaussian & 93.7377690802348 & 0.0121157807477659 \tabularnewline
Epanechnikov & 94.9510763209393 & 0.0106539400813084 \tabularnewline
Rectangular & 107.690802348337 & 0.0094967201141213 \tabularnewline
Triangular & 90.0978473581213 & 0.0118292973437474 \tabularnewline
Biweight & 94.9510763209393 & 0.0111023460714745 \tabularnewline
Cosine & 94.9510763209393 & 0.0112645241879143 \tabularnewline
Optcosine & 94.9510763209393 & 0.0108008702437607 \tabularnewline
 \hline
\end{tabular}
%Source: https://freestatistics.org/blog/index.php?pk=232509&T=51
[TABLE]
[ROW][C]Maximum Density Values[/C][/ROW]
[ROW][C]Kernel[/C][C]x-value[/C][C]max. density[/C][/ROW]
[ROW][C]Gaussian[/C][C]93.7377690802348[/C][C]0.0121157807477659[/C][/ROW]
[ROW][C]Epanechnikov[/C][C]94.9510763209393[/C][C]0.0106539400813084[/C][/ROW]
[ROW][C]Rectangular[/C][C]107.690802348337[/C][C]0.0094967201141213[/C][/ROW]
[ROW][C]Triangular[/C][C]90.0978473581213[/C][C]0.0118292973437474[/C][/ROW]
[ROW][C]Biweight[/C][C]94.9510763209393[/C][C]0.0111023460714745[/C][/ROW]
[ROW][C]Cosine[/C][C]94.9510763209393[/C][C]0.0112645241879143[/C][/ROW]
[ROW][C]Optcosine[/C][C]94.9510763209393[/C][C]0.0108008702437607[/C][/ROW]
 [/TABLE]
Source: https://freestatistics.org/blog/index.php?pk=232509&T=51
Globally Unique Identifier (entire table): ba.freestatistics.org/blog/index.php?pk=232509&T=51
As an alternative you can also use a QR Code:
The GUIDs for individual cells are displayed in the table below:
| Maximum Density Values | | Kernel | x-value | max. density | | Gaussian | 93.7377690802348 | 0.0121157807477659 | | Epanechnikov | 94.9510763209393 | 0.0106539400813084 | | Rectangular | 107.690802348337 | 0.0094967201141213 | | Triangular | 90.0978473581213 | 0.0118292973437474 | | Biweight | 94.9510763209393 | 0.0111023460714745 | | Cosine | 94.9510763209393 | 0.0112645241879143 | | Optcosine | 94.9510763209393 | 0.0108008702437607 |
If you paste this QR Code into your document, anyone with a smartphone or tablet will be able to scan it and view this table in a browser.
If you paste this QR Code into your document, anyone with a smartphone or tablet will be able to scan it and view this table in a browser.
If you paste this QR Code into your document, anyone with a smartphone or tablet will be able to scan it and view this table in a browser.
If you paste this QR Code into your document, anyone with a smartphone or tablet will be able to scan it and view this table in a browser.
If you paste this QR Code into your document, anyone with a smartphone or tablet will be able to scan it and view this table in a browser.
| Maximum Density Values | | Kernel | x-value | max. density | | Gaussian | 93.7377690802348 | 0.0121157807477659 | | Epanechnikov | 94.9510763209393 | 0.0106539400813084 | | Rectangular | 108.297455968689 | 0.0094967201141213 | | Triangular | 90.0978473581213 | 0.0118292973437474 | | Biweight | 94.9510763209393 | 0.0111023460714745 | | Cosine | 94.9510763209393 | 0.0112645241879143 | | Optcosine | 94.9510763209393 | 0.0108008702437607 |
\begin{tabular}{lllllllll}
\hline
Maximum Density Values \tabularnewline
Kernel & x-value & max. density \tabularnewline
Gaussian & 93.7377690802348 & 0.0121157807477659 \tabularnewline
Epanechnikov & 94.9510763209393 & 0.0106539400813084 \tabularnewline
Rectangular & 108.297455968689 & 0.0094967201141213 \tabularnewline
Triangular & 90.0978473581213 & 0.0118292973437474 \tabularnewline
Biweight & 94.9510763209393 & 0.0111023460714745 \tabularnewline
Cosine & 94.9510763209393 & 0.0112645241879143 \tabularnewline
Optcosine & 94.9510763209393 & 0.0108008702437607 \tabularnewline
 \hline
\end{tabular}
%Source: https://freestatistics.org/blog/index.php?pk=232509&T=52
[TABLE]
[ROW][C]Maximum Density Values[/C][/ROW]
[ROW][C]Kernel[/C][C]x-value[/C][C]max. density[/C][/ROW]
[ROW][C]Gaussian[/C][C]93.7377690802348[/C][C]0.0121157807477659[/C][/ROW]
[ROW][C]Epanechnikov[/C][C]94.9510763209393[/C][C]0.0106539400813084[/C][/ROW]
[ROW][C]Rectangular[/C][C]108.297455968689[/C][C]0.0094967201141213[/C][/ROW]
[ROW][C]Triangular[/C][C]90.0978473581213[/C][C]0.0118292973437474[/C][/ROW]
[ROW][C]Biweight[/C][C]94.9510763209393[/C][C]0.0111023460714745[/C][/ROW]
[ROW][C]Cosine[/C][C]94.9510763209393[/C][C]0.0112645241879143[/C][/ROW]
[ROW][C]Optcosine[/C][C]94.9510763209393[/C][C]0.0108008702437607[/C][/ROW]
 [/TABLE]
Source: https://freestatistics.org/blog/index.php?pk=232509&T=52
Globally Unique Identifier (entire table): ba.freestatistics.org/blog/index.php?pk=232509&T=52
As an alternative you can also use a QR Code:
The GUIDs for individual cells are displayed in the table below:
| Maximum Density Values | | Kernel | x-value | max. density | | Gaussian | 93.7377690802348 | 0.0121157807477659 | | Epanechnikov | 94.9510763209393 | 0.0106539400813084 | | Rectangular | 108.297455968689 | 0.0094967201141213 | | Triangular | 90.0978473581213 | 0.0118292973437474 | | Biweight | 94.9510763209393 | 0.0111023460714745 | | Cosine | 94.9510763209393 | 0.0112645241879143 | | Optcosine | 94.9510763209393 | 0.0108008702437607 |
If you paste this QR Code into your document, anyone with a smartphone or tablet will be able to scan it and view this table in a browser.
If you paste this QR Code into your document, anyone with a smartphone or tablet will be able to scan it and view this table in a browser.
If you paste this QR Code into your document, anyone with a smartphone or tablet will be able to scan it and view this table in a browser.
If you paste this QR Code into your document, anyone with a smartphone or tablet will be able to scan it and view this table in a browser.
If you paste this QR Code into your document, anyone with a smartphone or tablet will be able to scan it and view this table in a browser.
| Maximum Density Values | | Kernel | x-value | max. density | | Gaussian | 93.7377690802348 | 0.0121157807477659 | | Epanechnikov | 94.9510763209393 | 0.0106539400813084 | | Rectangular | 108.904109589041 | 0.0094967201141213 | | Triangular | 90.0978473581213 | 0.0118292973437474 | | Biweight | 94.9510763209393 | 0.0111023460714745 | | Cosine | 94.9510763209393 | 0.0112645241879143 | | Optcosine | 94.9510763209393 | 0.0108008702437607 |
\begin{tabular}{lllllllll}
\hline
Maximum Density Values \tabularnewline
Kernel & x-value & max. density \tabularnewline
Gaussian & 93.7377690802348 & 0.0121157807477659 \tabularnewline
Epanechnikov & 94.9510763209393 & 0.0106539400813084 \tabularnewline
Rectangular & 108.904109589041 & 0.0094967201141213 \tabularnewline
Triangular & 90.0978473581213 & 0.0118292973437474 \tabularnewline
Biweight & 94.9510763209393 & 0.0111023460714745 \tabularnewline
Cosine & 94.9510763209393 & 0.0112645241879143 \tabularnewline
Optcosine & 94.9510763209393 & 0.0108008702437607 \tabularnewline
 \hline
\end{tabular}
%Source: https://freestatistics.org/blog/index.php?pk=232509&T=53
[TABLE]
[ROW][C]Maximum Density Values[/C][/ROW]
[ROW][C]Kernel[/C][C]x-value[/C][C]max. density[/C][/ROW]
[ROW][C]Gaussian[/C][C]93.7377690802348[/C][C]0.0121157807477659[/C][/ROW]
[ROW][C]Epanechnikov[/C][C]94.9510763209393[/C][C]0.0106539400813084[/C][/ROW]
[ROW][C]Rectangular[/C][C]108.904109589041[/C][C]0.0094967201141213[/C][/ROW]
[ROW][C]Triangular[/C][C]90.0978473581213[/C][C]0.0118292973437474[/C][/ROW]
[ROW][C]Biweight[/C][C]94.9510763209393[/C][C]0.0111023460714745[/C][/ROW]
[ROW][C]Cosine[/C][C]94.9510763209393[/C][C]0.0112645241879143[/C][/ROW]
[ROW][C]Optcosine[/C][C]94.9510763209393[/C][C]0.0108008702437607[/C][/ROW]
 [/TABLE]
Source: https://freestatistics.org/blog/index.php?pk=232509&T=53
Globally Unique Identifier (entire table): ba.freestatistics.org/blog/index.php?pk=232509&T=53
As an alternative you can also use a QR Code:
The GUIDs for individual cells are displayed in the table below:
| Maximum Density Values | | Kernel | x-value | max. density | | Gaussian | 93.7377690802348 | 0.0121157807477659 | | Epanechnikov | 94.9510763209393 | 0.0106539400813084 | | Rectangular | 108.904109589041 | 0.0094967201141213 | | Triangular | 90.0978473581213 | 0.0118292973437474 | | Biweight | 94.9510763209393 | 0.0111023460714745 | | Cosine | 94.9510763209393 | 0.0112645241879143 | | Optcosine | 94.9510763209393 | 0.0108008702437607 |
If you paste this QR Code into your document, anyone with a smartphone or tablet will be able to scan it and view this table in a browser.
If you paste this QR Code into your document, anyone with a smartphone or tablet will be able to scan it and view this table in a browser.
If you paste this QR Code into your document, anyone with a smartphone or tablet will be able to scan it and view this table in a browser.
If you paste this QR Code into your document, anyone with a smartphone or tablet will be able to scan it and view this table in a browser.
If you paste this QR Code into your document, anyone with a smartphone or tablet will be able to scan it and view this table in a browser.
| Maximum Density Values | | Kernel | x-value | max. density | | Gaussian | 93.7377690802348 | 0.0121157807477659 | | Epanechnikov | 94.9510763209393 | 0.0106539400813084 | | Rectangular | 111.937377690802 | 0.0094967201141213 | | Triangular | 90.0978473581213 | 0.0118292973437474 | | Biweight | 94.9510763209393 | 0.0111023460714745 | | Cosine | 94.9510763209393 | 0.0112645241879143 | | Optcosine | 94.9510763209393 | 0.0108008702437607 |
\begin{tabular}{lllllllll}
\hline
Maximum Density Values \tabularnewline
Kernel & x-value & max. density \tabularnewline
Gaussian & 93.7377690802348 & 0.0121157807477659 \tabularnewline
Epanechnikov & 94.9510763209393 & 0.0106539400813084 \tabularnewline
Rectangular & 111.937377690802 & 0.0094967201141213 \tabularnewline
Triangular & 90.0978473581213 & 0.0118292973437474 \tabularnewline
Biweight & 94.9510763209393 & 0.0111023460714745 \tabularnewline
Cosine & 94.9510763209393 & 0.0112645241879143 \tabularnewline
Optcosine & 94.9510763209393 & 0.0108008702437607 \tabularnewline
 \hline
\end{tabular}
%Source: https://freestatistics.org/blog/index.php?pk=232509&T=54
[TABLE]
[ROW][C]Maximum Density Values[/C][/ROW]
[ROW][C]Kernel[/C][C]x-value[/C][C]max. density[/C][/ROW]
[ROW][C]Gaussian[/C][C]93.7377690802348[/C][C]0.0121157807477659[/C][/ROW]
[ROW][C]Epanechnikov[/C][C]94.9510763209393[/C][C]0.0106539400813084[/C][/ROW]
[ROW][C]Rectangular[/C][C]111.937377690802[/C][C]0.0094967201141213[/C][/ROW]
[ROW][C]Triangular[/C][C]90.0978473581213[/C][C]0.0118292973437474[/C][/ROW]
[ROW][C]Biweight[/C][C]94.9510763209393[/C][C]0.0111023460714745[/C][/ROW]
[ROW][C]Cosine[/C][C]94.9510763209393[/C][C]0.0112645241879143[/C][/ROW]
[ROW][C]Optcosine[/C][C]94.9510763209393[/C][C]0.0108008702437607[/C][/ROW]
 [/TABLE]
Source: https://freestatistics.org/blog/index.php?pk=232509&T=54
Globally Unique Identifier (entire table): ba.freestatistics.org/blog/index.php?pk=232509&T=54
As an alternative you can also use a QR Code:
The GUIDs for individual cells are displayed in the table below:
| Maximum Density Values | | Kernel | x-value | max. density | | Gaussian | 93.7377690802348 | 0.0121157807477659 | | Epanechnikov | 94.9510763209393 | 0.0106539400813084 | | Rectangular | 111.937377690802 | 0.0094967201141213 | | Triangular | 90.0978473581213 | 0.0118292973437474 | | Biweight | 94.9510763209393 | 0.0111023460714745 | | Cosine | 94.9510763209393 | 0.0112645241879143 | | Optcosine | 94.9510763209393 | 0.0108008702437607 |
If you paste this QR Code into your document, anyone with a smartphone or tablet will be able to scan it and view this table in a browser.
If you paste this QR Code into your document, anyone with a smartphone or tablet will be able to scan it and view this table in a browser.
If you paste this QR Code into your document, anyone with a smartphone or tablet will be able to scan it and view this table in a browser.
If you paste this QR Code into your document, anyone with a smartphone or tablet will be able to scan it and view this table in a browser.
If you paste this QR Code into your document, anyone with a smartphone or tablet will be able to scan it and view this table in a browser.
| Maximum Density Values | | Kernel | x-value | max. density | | Gaussian | 93.7377690802348 | 0.0121157807477659 | | Epanechnikov | 94.9510763209393 | 0.0106539400813084 | | Rectangular | 112.544031311155 | 0.0094967201141213 | | Triangular | 90.0978473581213 | 0.0118292973437474 | | Biweight | 94.9510763209393 | 0.0111023460714745 | | Cosine | 94.9510763209393 | 0.0112645241879143 | | Optcosine | 94.9510763209393 | 0.0108008702437607 |
\begin{tabular}{lllllllll}
\hline
Maximum Density Values \tabularnewline
Kernel & x-value & max. density \tabularnewline
Gaussian & 93.7377690802348 & 0.0121157807477659 \tabularnewline
Epanechnikov & 94.9510763209393 & 0.0106539400813084 \tabularnewline
Rectangular & 112.544031311155 & 0.0094967201141213 \tabularnewline
Triangular & 90.0978473581213 & 0.0118292973437474 \tabularnewline
Biweight & 94.9510763209393 & 0.0111023460714745 \tabularnewline
Cosine & 94.9510763209393 & 0.0112645241879143 \tabularnewline
Optcosine & 94.9510763209393 & 0.0108008702437607 \tabularnewline
 \hline
\end{tabular}
%Source: https://freestatistics.org/blog/index.php?pk=232509&T=55
[TABLE]
[ROW][C]Maximum Density Values[/C][/ROW]
[ROW][C]Kernel[/C][C]x-value[/C][C]max. density[/C][/ROW]
[ROW][C]Gaussian[/C][C]93.7377690802348[/C][C]0.0121157807477659[/C][/ROW]
[ROW][C]Epanechnikov[/C][C]94.9510763209393[/C][C]0.0106539400813084[/C][/ROW]
[ROW][C]Rectangular[/C][C]112.544031311155[/C][C]0.0094967201141213[/C][/ROW]
[ROW][C]Triangular[/C][C]90.0978473581213[/C][C]0.0118292973437474[/C][/ROW]
[ROW][C]Biweight[/C][C]94.9510763209393[/C][C]0.0111023460714745[/C][/ROW]
[ROW][C]Cosine[/C][C]94.9510763209393[/C][C]0.0112645241879143[/C][/ROW]
[ROW][C]Optcosine[/C][C]94.9510763209393[/C][C]0.0108008702437607[/C][/ROW]
 [/TABLE]
Source: https://freestatistics.org/blog/index.php?pk=232509&T=55
Globally Unique Identifier (entire table): ba.freestatistics.org/blog/index.php?pk=232509&T=55
As an alternative you can also use a QR Code:
The GUIDs for individual cells are displayed in the table below:
| Maximum Density Values | | Kernel | x-value | max. density | | Gaussian | 93.7377690802348 | 0.0121157807477659 | | Epanechnikov | 94.9510763209393 | 0.0106539400813084 | | Rectangular | 112.544031311155 | 0.0094967201141213 | | Triangular | 90.0978473581213 | 0.0118292973437474 | | Biweight | 94.9510763209393 | 0.0111023460714745 | | Cosine | 94.9510763209393 | 0.0112645241879143 | | Optcosine | 94.9510763209393 | 0.0108008702437607 |
If you paste this QR Code into your document, anyone with a smartphone or tablet will be able to scan it and view this table in a browser.
If you paste this QR Code into your document, anyone with a smartphone or tablet will be able to scan it and view this table in a browser.
If you paste this QR Code into your document, anyone with a smartphone or tablet will be able to scan it and view this table in a browser.
If you paste this QR Code into your document, anyone with a smartphone or tablet will be able to scan it and view this table in a browser.
If you paste this QR Code into your document, anyone with a smartphone or tablet will be able to scan it and view this table in a browser.
| Maximum Density Values | | Kernel | x-value | max. density | | Gaussian | 93.7377690802348 | 0.0121157807477659 | | Epanechnikov | 94.9510763209393 | 0.0106539400813084 | | Rectangular | 128.317025440313 | 0.0094967201141213 | | Triangular | 90.0978473581213 | 0.0118292973437474 | | Biweight | 94.9510763209393 | 0.0111023460714745 | | Cosine | 94.9510763209393 | 0.0112645241879143 | | Optcosine | 94.9510763209393 | 0.0108008702437607 |
\begin{tabular}{lllllllll}
\hline
Maximum Density Values \tabularnewline
Kernel & x-value & max. density \tabularnewline
Gaussian & 93.7377690802348 & 0.0121157807477659 \tabularnewline
Epanechnikov & 94.9510763209393 & 0.0106539400813084 \tabularnewline
Rectangular & 128.317025440313 & 0.0094967201141213 \tabularnewline
Triangular & 90.0978473581213 & 0.0118292973437474 \tabularnewline
Biweight & 94.9510763209393 & 0.0111023460714745 \tabularnewline
Cosine & 94.9510763209393 & 0.0112645241879143 \tabularnewline
Optcosine & 94.9510763209393 & 0.0108008702437607 \tabularnewline
 \hline
\end{tabular}
%Source: https://freestatistics.org/blog/index.php?pk=232509&T=56
[TABLE]
[ROW][C]Maximum Density Values[/C][/ROW]
[ROW][C]Kernel[/C][C]x-value[/C][C]max. density[/C][/ROW]
[ROW][C]Gaussian[/C][C]93.7377690802348[/C][C]0.0121157807477659[/C][/ROW]
[ROW][C]Epanechnikov[/C][C]94.9510763209393[/C][C]0.0106539400813084[/C][/ROW]
[ROW][C]Rectangular[/C][C]128.317025440313[/C][C]0.0094967201141213[/C][/ROW]
[ROW][C]Triangular[/C][C]90.0978473581213[/C][C]0.0118292973437474[/C][/ROW]
[ROW][C]Biweight[/C][C]94.9510763209393[/C][C]0.0111023460714745[/C][/ROW]
[ROW][C]Cosine[/C][C]94.9510763209393[/C][C]0.0112645241879143[/C][/ROW]
[ROW][C]Optcosine[/C][C]94.9510763209393[/C][C]0.0108008702437607[/C][/ROW]
 [/TABLE]
Source: https://freestatistics.org/blog/index.php?pk=232509&T=56
Globally Unique Identifier (entire table): ba.freestatistics.org/blog/index.php?pk=232509&T=56
As an alternative you can also use a QR Code:
The GUIDs for individual cells are displayed in the table below:
| Maximum Density Values | | Kernel | x-value | max. density | | Gaussian | 93.7377690802348 | 0.0121157807477659 | | Epanechnikov | 94.9510763209393 | 0.0106539400813084 | | Rectangular | 128.317025440313 | 0.0094967201141213 | | Triangular | 90.0978473581213 | 0.0118292973437474 | | Biweight | 94.9510763209393 | 0.0111023460714745 | | Cosine | 94.9510763209393 | 0.0112645241879143 | | Optcosine | 94.9510763209393 | 0.0108008702437607 |
If you paste this QR Code into your document, anyone with a smartphone or tablet will be able to scan it and view this table in a browser.
If you paste this QR Code into your document, anyone with a smartphone or tablet will be able to scan it and view this table in a browser.
If you paste this QR Code into your document, anyone with a smartphone or tablet will be able to scan it and view this table in a browser.
If you paste this QR Code into your document, anyone with a smartphone or tablet will be able to scan it and view this table in a browser.
If you paste this QR Code into your document, anyone with a smartphone or tablet will be able to scan it and view this table in a browser.
| Maximum Density Values | | Kernel | x-value | max. density | | Gaussian | 93.7377690802348 | 0.0121157807477659 | | Epanechnikov | 94.9510763209393 | 0.0106539400813084 | | Rectangular | 128.923679060665 | 0.0094967201141213 | | Triangular | 90.0978473581213 | 0.0118292973437474 | | Biweight | 94.9510763209393 | 0.0111023460714745 | | Cosine | 94.9510763209393 | 0.0112645241879143 | | Optcosine | 94.9510763209393 | 0.0108008702437607 |
\begin{tabular}{lllllllll}
\hline
Maximum Density Values \tabularnewline
Kernel & x-value & max. density \tabularnewline
Gaussian & 93.7377690802348 & 0.0121157807477659 \tabularnewline
Epanechnikov & 94.9510763209393 & 0.0106539400813084 \tabularnewline
Rectangular & 128.923679060665 & 0.0094967201141213 \tabularnewline
Triangular & 90.0978473581213 & 0.0118292973437474 \tabularnewline
Biweight & 94.9510763209393 & 0.0111023460714745 \tabularnewline
Cosine & 94.9510763209393 & 0.0112645241879143 \tabularnewline
Optcosine & 94.9510763209393 & 0.0108008702437607 \tabularnewline
 \hline
\end{tabular}
%Source: https://freestatistics.org/blog/index.php?pk=232509&T=57
[TABLE]
[ROW][C]Maximum Density Values[/C][/ROW]
[ROW][C]Kernel[/C][C]x-value[/C][C]max. density[/C][/ROW]
[ROW][C]Gaussian[/C][C]93.7377690802348[/C][C]0.0121157807477659[/C][/ROW]
[ROW][C]Epanechnikov[/C][C]94.9510763209393[/C][C]0.0106539400813084[/C][/ROW]
[ROW][C]Rectangular[/C][C]128.923679060665[/C][C]0.0094967201141213[/C][/ROW]
[ROW][C]Triangular[/C][C]90.0978473581213[/C][C]0.0118292973437474[/C][/ROW]
[ROW][C]Biweight[/C][C]94.9510763209393[/C][C]0.0111023460714745[/C][/ROW]
[ROW][C]Cosine[/C][C]94.9510763209393[/C][C]0.0112645241879143[/C][/ROW]
[ROW][C]Optcosine[/C][C]94.9510763209393[/C][C]0.0108008702437607[/C][/ROW]
 [/TABLE]
Source: https://freestatistics.org/blog/index.php?pk=232509&T=57
Globally Unique Identifier (entire table): ba.freestatistics.org/blog/index.php?pk=232509&T=57
As an alternative you can also use a QR Code:
The GUIDs for individual cells are displayed in the table below:
| Maximum Density Values | | Kernel | x-value | max. density | | Gaussian | 93.7377690802348 | 0.0121157807477659 | | Epanechnikov | 94.9510763209393 | 0.0106539400813084 | | Rectangular | 128.923679060665 | 0.0094967201141213 | | Triangular | 90.0978473581213 | 0.0118292973437474 | | Biweight | 94.9510763209393 | 0.0111023460714745 | | Cosine | 94.9510763209393 | 0.0112645241879143 | | Optcosine | 94.9510763209393 | 0.0108008702437607 |
If you paste this QR Code into your document, anyone with a smartphone or tablet will be able to scan it and view this table in a browser.
If you paste this QR Code into your document, anyone with a smartphone or tablet will be able to scan it and view this table in a browser.
If you paste this QR Code into your document, anyone with a smartphone or tablet will be able to scan it and view this table in a browser.
If you paste this QR Code into your document, anyone with a smartphone or tablet will be able to scan it and view this table in a browser.
If you paste this QR Code into your document, anyone with a smartphone or tablet will be able to scan it and view this table in a browser.
| Maximum Density Values | | Kernel | x-value | max. density | | Gaussian | 93.7377690802348 | 0.0121157807477659 | | Epanechnikov | 94.9510763209393 | 0.0106539400813084 | | Rectangular | 129.530332681018 | 0.0094967201141213 | | Triangular | 90.0978473581213 | 0.0118292973437474 | | Biweight | 94.9510763209393 | 0.0111023460714745 | | Cosine | 94.9510763209393 | 0.0112645241879143 | | Optcosine | 94.9510763209393 | 0.0108008702437607 |
\begin{tabular}{lllllllll}
\hline
Maximum Density Values \tabularnewline
Kernel & x-value & max. density \tabularnewline
Gaussian & 93.7377690802348 & 0.0121157807477659 \tabularnewline
Epanechnikov & 94.9510763209393 & 0.0106539400813084 \tabularnewline
Rectangular & 129.530332681018 & 0.0094967201141213 \tabularnewline
Triangular & 90.0978473581213 & 0.0118292973437474 \tabularnewline
Biweight & 94.9510763209393 & 0.0111023460714745 \tabularnewline
Cosine & 94.9510763209393 & 0.0112645241879143 \tabularnewline
Optcosine & 94.9510763209393 & 0.0108008702437607 \tabularnewline
 \hline
\end{tabular}
%Source: https://freestatistics.org/blog/index.php?pk=232509&T=58
[TABLE]
[ROW][C]Maximum Density Values[/C][/ROW]
[ROW][C]Kernel[/C][C]x-value[/C][C]max. density[/C][/ROW]
[ROW][C]Gaussian[/C][C]93.7377690802348[/C][C]0.0121157807477659[/C][/ROW]
[ROW][C]Epanechnikov[/C][C]94.9510763209393[/C][C]0.0106539400813084[/C][/ROW]
[ROW][C]Rectangular[/C][C]129.530332681018[/C][C]0.0094967201141213[/C][/ROW]
[ROW][C]Triangular[/C][C]90.0978473581213[/C][C]0.0118292973437474[/C][/ROW]
[ROW][C]Biweight[/C][C]94.9510763209393[/C][C]0.0111023460714745[/C][/ROW]
[ROW][C]Cosine[/C][C]94.9510763209393[/C][C]0.0112645241879143[/C][/ROW]
[ROW][C]Optcosine[/C][C]94.9510763209393[/C][C]0.0108008702437607[/C][/ROW]
 [/TABLE]
Source: https://freestatistics.org/blog/index.php?pk=232509&T=58
Globally Unique Identifier (entire table): ba.freestatistics.org/blog/index.php?pk=232509&T=58
As an alternative you can also use a QR Code:
The GUIDs for individual cells are displayed in the table below:
| Maximum Density Values | | Kernel | x-value | max. density | | Gaussian | 93.7377690802348 | 0.0121157807477659 | | Epanechnikov | 94.9510763209393 | 0.0106539400813084 | | Rectangular | 129.530332681018 | 0.0094967201141213 | | Triangular | 90.0978473581213 | 0.0118292973437474 | | Biweight | 94.9510763209393 | 0.0111023460714745 | | Cosine | 94.9510763209393 | 0.0112645241879143 | | Optcosine | 94.9510763209393 | 0.0108008702437607 |
If you paste this QR Code into your document, anyone with a smartphone or tablet will be able to scan it and view this table in a browser.
If you paste this QR Code into your document, anyone with a smartphone or tablet will be able to scan it and view this table in a browser.
If you paste this QR Code into your document, anyone with a smartphone or tablet will be able to scan it and view this table in a browser.
If you paste this QR Code into your document, anyone with a smartphone or tablet will be able to scan it and view this table in a browser.
If you paste this QR Code into your document, anyone with a smartphone or tablet will be able to scan it and view this table in a browser.
| Maximum Density Values | | Kernel | x-value | max. density | | Gaussian | 93.7377690802348 | 0.0121157807477659 | | Epanechnikov | 94.9510763209393 | 0.0106539400813084 | | Rectangular | 130.13698630137 | 0.0094967201141213 | | Triangular | 90.0978473581213 | 0.0118292973437474 | | Biweight | 94.9510763209393 | 0.0111023460714745 | | Cosine | 94.9510763209393 | 0.0112645241879143 | | Optcosine | 94.9510763209393 | 0.0108008702437607 |
\begin{tabular}{lllllllll}
\hline
Maximum Density Values \tabularnewline
Kernel & x-value & max. density \tabularnewline
Gaussian & 93.7377690802348 & 0.0121157807477659 \tabularnewline
Epanechnikov & 94.9510763209393 & 0.0106539400813084 \tabularnewline
Rectangular & 130.13698630137 & 0.0094967201141213 \tabularnewline
Triangular & 90.0978473581213 & 0.0118292973437474 \tabularnewline
Biweight & 94.9510763209393 & 0.0111023460714745 \tabularnewline
Cosine & 94.9510763209393 & 0.0112645241879143 \tabularnewline
Optcosine & 94.9510763209393 & 0.0108008702437607 \tabularnewline
 \hline
\end{tabular}
%Source: https://freestatistics.org/blog/index.php?pk=232509&T=59
[TABLE]
[ROW][C]Maximum Density Values[/C][/ROW]
[ROW][C]Kernel[/C][C]x-value[/C][C]max. density[/C][/ROW]
[ROW][C]Gaussian[/C][C]93.7377690802348[/C][C]0.0121157807477659[/C][/ROW]
[ROW][C]Epanechnikov[/C][C]94.9510763209393[/C][C]0.0106539400813084[/C][/ROW]
[ROW][C]Rectangular[/C][C]130.13698630137[/C][C]0.0094967201141213[/C][/ROW]
[ROW][C]Triangular[/C][C]90.0978473581213[/C][C]0.0118292973437474[/C][/ROW]
[ROW][C]Biweight[/C][C]94.9510763209393[/C][C]0.0111023460714745[/C][/ROW]
[ROW][C]Cosine[/C][C]94.9510763209393[/C][C]0.0112645241879143[/C][/ROW]
[ROW][C]Optcosine[/C][C]94.9510763209393[/C][C]0.0108008702437607[/C][/ROW]
 [/TABLE]
Source: https://freestatistics.org/blog/index.php?pk=232509&T=59
Globally Unique Identifier (entire table): ba.freestatistics.org/blog/index.php?pk=232509&T=59
As an alternative you can also use a QR Code:
The GUIDs for individual cells are displayed in the table below:
| Maximum Density Values | | Kernel | x-value | max. density | | Gaussian | 93.7377690802348 | 0.0121157807477659 | | Epanechnikov | 94.9510763209393 | 0.0106539400813084 | | Rectangular | 130.13698630137 | 0.0094967201141213 | | Triangular | 90.0978473581213 | 0.0118292973437474 | | Biweight | 94.9510763209393 | 0.0111023460714745 | | Cosine | 94.9510763209393 | 0.0112645241879143 | | Optcosine | 94.9510763209393 | 0.0108008702437607 |
If you paste this QR Code into your document, anyone with a smartphone or tablet will be able to scan it and view this table in a browser.
If you paste this QR Code into your document, anyone with a smartphone or tablet will be able to scan it and view this table in a browser.
If you paste this QR Code into your document, anyone with a smartphone or tablet will be able to scan it and view this table in a browser.
If you paste this QR Code into your document, anyone with a smartphone or tablet will be able to scan it and view this table in a browser.
If you paste this QR Code into your document, anyone with a smartphone or tablet will be able to scan it and view this table in a browser.
| Maximum Density Values | | Kernel | x-value | max. density | | Gaussian | 93.7377690802348 | 0.0121157807477659 | | Epanechnikov | 94.9510763209393 | 0.0106539400813084 | | Rectangular | 130.743639921722 | 0.0094967201141213 | | Triangular | 90.0978473581213 | 0.0118292973437474 | | Biweight | 94.9510763209393 | 0.0111023460714745 | | Cosine | 94.9510763209393 | 0.0112645241879143 | | Optcosine | 94.9510763209393 | 0.0108008702437607 |
\begin{tabular}{lllllllll}
\hline
Maximum Density Values \tabularnewline
Kernel & x-value & max. density \tabularnewline
Gaussian & 93.7377690802348 & 0.0121157807477659 \tabularnewline
Epanechnikov & 94.9510763209393 & 0.0106539400813084 \tabularnewline
Rectangular & 130.743639921722 & 0.0094967201141213 \tabularnewline
Triangular & 90.0978473581213 & 0.0118292973437474 \tabularnewline
Biweight & 94.9510763209393 & 0.0111023460714745 \tabularnewline
Cosine & 94.9510763209393 & 0.0112645241879143 \tabularnewline
Optcosine & 94.9510763209393 & 0.0108008702437607 \tabularnewline
\hline
\end{tabular}
%Source: https://freestatistics.org/blog/index.php?pk=232509&T=60
[TABLE]
[ROW][C]Maximum Density Values[/C][/ROW]
[ROW][C]Kernel[/C][C]x-value[/C][C]max. density[/C][/ROW]
[ROW][C]Gaussian[/C][C]93.7377690802348[/C][C]0.0121157807477659[/C][/ROW]
[ROW][C]Epanechnikov[/C][C]94.9510763209393[/C][C]0.0106539400813084[/C][/ROW]
[ROW][C]Rectangular[/C][C]130.743639921722[/C][C]0.0094967201141213[/C][/ROW]
[ROW][C]Triangular[/C][C]90.0978473581213[/C][C]0.0118292973437474[/C][/ROW]
[ROW][C]Biweight[/C][C]94.9510763209393[/C][C]0.0111023460714745[/C][/ROW]
[ROW][C]Cosine[/C][C]94.9510763209393[/C][C]0.0112645241879143[/C][/ROW]
[ROW][C]Optcosine[/C][C]94.9510763209393[/C][C]0.0108008702437607[/C][/ROW]
[/TABLE]
Source: https://freestatistics.org/blog/index.php?pk=232509&T=60
Globally Unique Identifier (entire table): ba.freestatistics.org/blog/index.php?pk=232509&T=60
As an alternative you can also use a QR Code:
The GUIDs for individual cells are displayed in the table below:
| Maximum Density Values | | Kernel | x-value | max. density | | Gaussian | 93.7377690802348 | 0.0121157807477659 | | Epanechnikov | 94.9510763209393 | 0.0106539400813084 | | Rectangular | 130.743639921722 | 0.0094967201141213 | | Triangular | 90.0978473581213 | 0.0118292973437474 | | Biweight | 94.9510763209393 | 0.0111023460714745 | | Cosine | 94.9510763209393 | 0.0112645241879143 | | Optcosine | 94.9510763209393 | 0.0108008702437607 |
If you paste this QR Code into your document, anyone with a smartphone or tablet will be able to scan it and view this table in a browser.
If you paste this QR Code into your document, anyone with a smartphone or tablet will be able to scan it and view this table in a browser.
If you paste this QR Code into your document, anyone with a smartphone or tablet will be able to scan it and view this table in a browser.
If you paste this QR Code into your document, anyone with a smartphone or tablet will be able to scan it and view this table in a browser.
If you paste this QR Code into your document, anyone with a smartphone or tablet will be able to scan it and view this table in a browser.
|