Free Statistics

of Irreproducible Research!

Author's title

Author*Unverified author*
R Software Modulerwasp_boxcoxnorm.wasp
Title produced by softwareBox-Cox Normality Plot
Date of computationWed, 31 Mar 2021 16:06:59 +0200
Cite this page as followsStatistical Computations at FreeStatistics.org, Office for Research Development and Education, URL https://freestatistics.org/blog/index.php?v=date/2021/Mar/31/t1617199734yxntizq8nupg2z0.htm/, Retrieved Fri, 19 Apr 2024 07:01:06 +0000
Statistical Computations at FreeStatistics.org, Office for Research Development and Education, URL https://freestatistics.org/blog/index.php?pk=319395, Retrieved Fri, 19 Apr 2024 07:01:06 +0000
QR Codes:

Original text written by user:
IsPrivate?No (this computation is public)
User-defined keywords
Estimated Impact100
Family? (F = Feedback message, R = changed R code, M = changed R Module, P = changed Parameters, D = changed Data)
-       [Box-Cox Normality Plot] [] [2021-03-31 14:06:59] [d41d8cd98f00b204e9800998ecf8427e] [Current]
Feedback Forum

Post a new message
Dataseries X:
11.24438088
17.66485036
15.18527714
25.30595776
24.00168259

94.14444444
43.37222
58.35000
50.15652
17.17381
29.27500
18.62142857
50.77307692


Summary of computational transaction
Raw Input view raw input (R code)
Raw Outputview raw output of R engine
Computing time2 seconds
R ServerBig Analytics Cloud Computing Center
R Framework error message
Warning: there are blank lines in the 'Data' field.
Please, use NA for missing data - blank lines are simply
 deleted and are NOT treated as missing values.

\begin{tabular}{lllllllll}
\hline
Summary of computational transaction \tabularnewline
Raw Input view raw input (R code)  \tabularnewline
Raw Outputview raw output of R engine  \tabularnewline
Computing time2 seconds \tabularnewline
R ServerBig Analytics Cloud Computing Center \tabularnewline
R Framework error message & 
Warning: there are blank lines in the 'Data' field.
Please, use NA for missing data - blank lines are simply
 deleted and are NOT treated as missing values.
\tabularnewline \hline \end{tabular} %Source: https://freestatistics.org/blog/index.php?pk=319395&T=0

[TABLE]
[ROW]
Summary of computational transaction[/C][/ROW] [ROW]Raw Input[/C] view raw input (R code) [/C][/ROW] [ROW]Raw Output[/C]view raw output of R engine [/C][/ROW] [ROW]Computing time[/C]2 seconds[/C][/ROW] [ROW]R Server[/C]Big Analytics Cloud Computing Center[/C][/ROW] [ROW]R Framework error message[/C][C]
Warning: there are blank lines in the 'Data' field.
Please, use NA for missing data - blank lines are simply
 deleted and are NOT treated as missing values.
[/C][/ROW] [/TABLE] Source: https://freestatistics.org/blog/index.php?pk=319395&T=0

Globally Unique Identifier (entire table): ba.freestatistics.org/blog/index.php?pk=319395&T=0

As an alternative you can also use a QR Code:  

The GUIDs for individual cells are displayed in the table below:

Summary of computational transaction
Raw Input view raw input (R code)
Raw Outputview raw output of R engine
Computing time2 seconds
R ServerBig Analytics Cloud Computing Center
R Framework error message
Warning: there are blank lines in the 'Data' field.
Please, use NA for missing data - blank lines are simply
 deleted and are NOT treated as missing values.


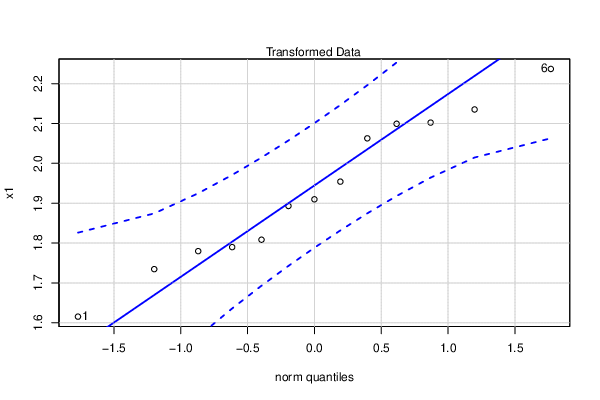
Box-Cox Normality Plot
# observations x13
maximum correlation0.985353792435655
optimal lambda-0.36
transformation formulafor all lambda <> 0 : T(Y) = (Y^lambda - 1) / lambda

\begin{tabular}{lllllllll}
\hline
Box-Cox Normality Plot \tabularnewline
# observations x & 13 \tabularnewline
maximum correlation & 0.985353792435655 \tabularnewline
optimal lambda & -0.36 \tabularnewline
transformation formula & for all lambda <> 0 : T(Y) = (Y^lambda - 1) / lambda \tabularnewline
\hline
\end{tabular}
%Source: https://freestatistics.org/blog/index.php?pk=319395&T=1

[TABLE]
[ROW][C]Box-Cox Normality Plot[/C][/ROW]
[ROW][C]# observations x[/C][C]13[/C][/ROW]
[ROW][C]maximum correlation[/C][C]0.985353792435655[/C][/ROW]
[ROW][C]optimal lambda[/C][C]-0.36[/C][/ROW]
[ROW][C]transformation formula[/C][C]for all lambda <> 0 : T(Y) = (Y^lambda - 1) / lambda[/C][/ROW]
[/TABLE]
Source: https://freestatistics.org/blog/index.php?pk=319395&T=1

Globally Unique Identifier (entire table): ba.freestatistics.org/blog/index.php?pk=319395&T=1

As an alternative you can also use a QR Code:  

The GUIDs for individual cells are displayed in the table below:

Box-Cox Normality Plot
# observations x13
maximum correlation0.985353792435655
optimal lambda-0.36
transformation formulafor all lambda <> 0 : T(Y) = (Y^lambda - 1) / lambda


Obs.OriginalTransformed
111.244380881.61536412565273
217.664850361.78982107371322
315.185277141.73453516258741
425.305957761.90974265351736
524.001682591.89304831223488
694.144444442.23685980924587
743.372222.06278557696792
858.352.13520430974151
950.156522.09923124363076
1017.173811.7797433935114
1129.2751.95409760140131
1218.621428571.80840053296032
1350.773076922.10220919380743

\begin{tabular}{lllllllll}
\hline
Obs. & Original & Transformed \tabularnewline
1 & 11.24438088 & 1.61536412565273 \tabularnewline
2 & 17.66485036 & 1.78982107371322 \tabularnewline
3 & 15.18527714 & 1.73453516258741 \tabularnewline
4 & 25.30595776 & 1.90974265351736 \tabularnewline
5 & 24.00168259 & 1.89304831223488 \tabularnewline
6 & 94.14444444 & 2.23685980924587 \tabularnewline
7 & 43.37222 & 2.06278557696792 \tabularnewline
8 & 58.35 & 2.13520430974151 \tabularnewline
9 & 50.15652 & 2.09923124363076 \tabularnewline
10 & 17.17381 & 1.7797433935114 \tabularnewline
11 & 29.275 & 1.95409760140131 \tabularnewline
12 & 18.62142857 & 1.80840053296032 \tabularnewline
13 & 50.77307692 & 2.10220919380743 \tabularnewline
\hline
\end{tabular}
%Source: https://freestatistics.org/blog/index.php?pk=319395&T=2

[TABLE]
[ROW][C]Obs.[/C][C]Original[/C][C]Transformed[/C][/ROW]
[ROW][C]1[/C][C]11.24438088[/C][C]1.61536412565273[/C][/ROW]
[ROW][C]2[/C][C]17.66485036[/C][C]1.78982107371322[/C][/ROW]
[ROW][C]3[/C][C]15.18527714[/C][C]1.73453516258741[/C][/ROW]
[ROW][C]4[/C][C]25.30595776[/C][C]1.90974265351736[/C][/ROW]
[ROW][C]5[/C][C]24.00168259[/C][C]1.89304831223488[/C][/ROW]
[ROW][C]6[/C][C]94.14444444[/C][C]2.23685980924587[/C][/ROW]
[ROW][C]7[/C][C]43.37222[/C][C]2.06278557696792[/C][/ROW]
[ROW][C]8[/C][C]58.35[/C][C]2.13520430974151[/C][/ROW]
[ROW][C]9[/C][C]50.15652[/C][C]2.09923124363076[/C][/ROW]
[ROW][C]10[/C][C]17.17381[/C][C]1.7797433935114[/C][/ROW]
[ROW][C]11[/C][C]29.275[/C][C]1.95409760140131[/C][/ROW]
[ROW][C]12[/C][C]18.62142857[/C][C]1.80840053296032[/C][/ROW]
[ROW][C]13[/C][C]50.77307692[/C][C]2.10220919380743[/C][/ROW]
[/TABLE]
Source: https://freestatistics.org/blog/index.php?pk=319395&T=2

Globally Unique Identifier (entire table): ba.freestatistics.org/blog/index.php?pk=319395&T=2

As an alternative you can also use a QR Code:  

The GUIDs for individual cells are displayed in the table below:

Obs.OriginalTransformed
111.244380881.61536412565273
217.664850361.78982107371322
315.185277141.73453516258741
425.305957761.90974265351736
524.001682591.89304831223488
694.144444442.23685980924587
743.372222.06278557696792
858.352.13520430974151
950.156522.09923124363076
1017.173811.7797433935114
1129.2751.95409760140131
1218.621428571.80840053296032
1350.773076922.10220919380743


Maximum Likelihood Estimation of Lambda
> summary(mypT)
bcPower Transformation to Normality 
  Est Power Rounded Pwr Wald Lwr Bnd Wald Upr Bnd
x   -0.2896           0      -1.2577       0.6784
Likelihood ratio test that transformation parameter is equal to 0
 (log transformation)
                            LRT df    pval
LR test, lambda = (0) 0.3482057  1 0.55513
Likelihood ratio test that no transformation is needed
                           LRT df      pval
LR test, lambda = (1) 7.041686  1 0.0079634

\begin{tabular}{lllllllll}
\hline
Maximum Likelihood Estimation of Lambda \tabularnewline
> summary(mypT)
bcPower Transformation to Normality 
  Est Power Rounded Pwr Wald Lwr Bnd Wald Upr Bnd
x   -0.2896           0      -1.2577       0.6784
Likelihood ratio test that transformation parameter is equal to 0
 (log transformation)
                            LRT df    pval
LR test, lambda = (0) 0.3482057  1 0.55513
Likelihood ratio test that no transformation is needed
                           LRT df      pval
LR test, lambda = (1) 7.041686  1 0.0079634
\tabularnewline \hline \end{tabular} %Source: https://freestatistics.org/blog/index.php?pk=319395&T=3

[TABLE]
[ROW][C]Maximum Likelihood Estimation of Lambda[/C][/ROW]
[ROW][C]
> summary(mypT)
bcPower Transformation to Normality 
  Est Power Rounded Pwr Wald Lwr Bnd Wald Upr Bnd
x   -0.2896           0      -1.2577       0.6784
Likelihood ratio test that transformation parameter is equal to 0
 (log transformation)
                            LRT df    pval
LR test, lambda = (0) 0.3482057  1 0.55513
Likelihood ratio test that no transformation is needed
                           LRT df      pval
LR test, lambda = (1) 7.041686  1 0.0079634
[/C][/ROW] [/TABLE] Source: https://freestatistics.org/blog/index.php?pk=319395&T=3

Globally Unique Identifier (entire table): ba.freestatistics.org/blog/index.php?pk=319395&T=3

As an alternative you can also use a QR Code:  

The GUIDs for individual cells are displayed in the table below:

Maximum Likelihood Estimation of Lambda
> summary(mypT)
bcPower Transformation to Normality 
  Est Power Rounded Pwr Wald Lwr Bnd Wald Upr Bnd
x   -0.2896           0      -1.2577       0.6784
Likelihood ratio test that transformation parameter is equal to 0
 (log transformation)
                            LRT df    pval
LR test, lambda = (0) 0.3482057  1 0.55513
Likelihood ratio test that no transformation is needed
                           LRT df      pval
LR test, lambda = (1) 7.041686  1 0.0079634


Parameters (Session):
par1 = Full Box-Cox transform ; par2 = -8 ; par3 = 2 ; par4 = 0 ; par5 = Yes ;
Parameters (R input):
par1 = Full Box-Cox transform ; par2 = -8 ; par3 = 2 ; par4 = 0 ; par5 = Yes ;
R code (references can be found in the software module):
library(car)
par2 <- abs(as.numeric(par2)*100)
par3 <- as.numeric(par3)*100
if(par4=='') par4 <- 0
par4 <- as.numeric(par4)
numlam <- par2 + par3 + 1
x <- x + par4
n <- length(x)
c <- array(NA,dim=c(numlam))
l <- array(NA,dim=c(numlam))
mx <- -1
mxli <- -999
for (i in 1:numlam)
{
l[i] <- (i-par2-1)/100
if (l[i] != 0)
{
if (par1 == 'Full Box-Cox transform') x1 <- (x^l[i] - 1) / l[i]
if (par1 == 'Simple Box-Cox transform') x1 <- x^l[i]
} else {
x1 <- log(x)
}
c[i] <- cor(qnorm(ppoints(x), mean=0, sd=1),sort(x1))
if (mx < c[i])
{
mx <- c[i]
mxli <- l[i]
x1.best <- x1
}
}
print(c)
print(mx)
print(mxli)
print(x1.best)
if (mxli != 0)
{
if (par1 == 'Full Box-Cox transform') x1 <- (x^mxli - 1) / mxli
if (par1 == 'Simple Box-Cox transform') x1 <- x^mxli
} else {
x1 <- log(x)
}
mypT <- powerTransform(x)
summary(mypT)
bitmap(file='test1.png')
plot(l,c,main='Box-Cox Normality Plot', xlab='Lambda',ylab='correlation')
mtext(paste('Optimal Lambda =',mxli))
grid()
dev.off()
bitmap(file='test2.png')
hist(x,main='Histogram of Original Data',xlab='X',ylab='frequency')
grid()
dev.off()
bitmap(file='test3.png')
hist(x1,main='Histogram of Transformed Data', xlab='X',ylab='frequency')
grid()
dev.off()
bitmap(file='test4.png')
qqPlot(x)
grid()
mtext('Original Data')
dev.off()
bitmap(file='test5.png')
qqPlot(x1)
grid()
mtext('Transformed Data')
dev.off()
load(file='createtable')
a<-table.start()
a<-table.row.start(a)
a<-table.element(a,'Box-Cox Normality Plot',2,TRUE)
a<-table.row.end(a)
a<-table.row.start(a)
a<-table.element(a,'# observations x',header=TRUE)
a<-table.element(a,n)
a<-table.row.end(a)
a<-table.row.start(a)
a<-table.element(a,'maximum correlation',header=TRUE)
a<-table.element(a,mx)
a<-table.row.end(a)
a<-table.row.start(a)
a<-table.element(a,'optimal lambda',header=TRUE)
a<-table.element(a,mxli)
a<-table.row.end(a)
a<-table.row.start(a)
a<-table.element(a,'transformation formula',header=TRUE)
if (par1 == 'Full Box-Cox transform') {
a<-table.element(a,'for all lambda <> 0 : T(Y) = (Y^lambda - 1) / lambda')
} else {
a<-table.element(a,'for all lambda <> 0 : T(Y) = Y^lambda')
}
a<-table.row.end(a)
if(mx<0) {
a<-table.row.start(a)
a<-table.element(a,'Warning: maximum correlation is negative! The Box-Cox transformation must not be used.',2)
a<-table.row.end(a)
}
a<-table.end(a)
table.save(a,file='mytable.tab')
if(par5=='Yes') {
a<-table.start()
a<-table.row.start(a)
a<-table.element(a,'Obs.',header=T)
a<-table.element(a,'Original',header=T)
a<-table.element(a,'Transformed',header=T)
a<-table.row.end(a)
for (i in 1:n) {
a<-table.row.start(a)
a<-table.element(a,i)
a<-table.element(a,x[i])
a<-table.element(a,x1.best[i])
a<-table.row.end(a)
}
a<-table.end(a)
table.save(a,file='mytable1.tab')
}
a<-table.start()
a<-table.row.start(a)
a<-table.element(a,'Maximum Likelihood Estimation of Lambda',1,TRUE)
a<-table.row.end(a)
a<-table.row.start(a)
a<-table.element(a,paste('
',RC.texteval('summary(mypT)'),'
',sep=''))
a<-table.row.end(a)
a<-table.end(a)
table.save(a,file='mytable3.tab')