Free Statistics

of Irreproducible Research!

Author's title

Author*Unverified author*
R Software Modulerwasp_centraltendency.wasp
Title produced by softwareCentral Tendency
Date of computationTue, 16 Mar 2010 11:47:47 -0600
Cite this page as followsStatistical Computations at FreeStatistics.org, Office for Research Development and Education, URL https://freestatistics.org/blog/index.php?v=date/2010/Mar/16/t1268762029zz0qcrdjtozx0vv.htm/, Retrieved Thu, 18 Apr 2024 22:09:33 +0000
Statistical Computations at FreeStatistics.org, Office for Research Development and Education, URL https://freestatistics.org/blog/index.php?pk=74471, Retrieved Thu, 18 Apr 2024 22:09:33 +0000
QR Codes:

Original text written by user:
IsPrivate?No (this computation is public)
User-defined keywordsKDGP1W52
Estimated Impact194
Family? (F = Feedback message, R = changed R code, M = changed R Module, P = changed Parameters, D = changed Data)
-       [Central Tendency] [rekenkundig gemid...] [2010-03-16 17:47:47] [819ef9efcbdcdc4b312cf90f12d3a4d4] [Current]
Feedback Forum

Post a new message
Dataseries X:
792108
472123
272128
992139
642162
352145
492169
92174
462193
92207
792222
72225
782230
52241
332266
902266
402287
812304
532313
802330
342322
222320
42314
252298
892323
392342
772330
982344
592342
662360
882362
942373
222371
632404
782475
372472
822461
142441
142435
742425
672393
302390
862379
772372
302370
452359
112353
442320
512322
192322
292303
962280
322321
362301
62288
812271
32259
72407
332399
712416
162432
652423
272420
642433
512435
722436
292453
812469
102444
122438
42476
702562


Summary of computational transaction
Raw Inputview raw input (R code)
Raw Outputview raw output of R engine
Computing time1 seconds
R Server'Gwilym Jenkins' @ 72.249.127.135

\begin{tabular}{lllllllll}
\hline
Summary of computational transaction \tabularnewline
Raw Input & view raw input (R code)  \tabularnewline
Raw Output & view raw output of R engine  \tabularnewline
Computing time & 1 seconds \tabularnewline
R Server & 'Gwilym Jenkins' @ 72.249.127.135 \tabularnewline
\hline
\end{tabular}
%Source: https://freestatistics.org/blog/index.php?pk=74471&T=0

[TABLE]
[ROW][C]Summary of computational transaction[/C][/ROW]
[ROW][C]Raw Input[/C][C]view raw input (R code) [/C][/ROW]
[ROW][C]Raw Output[/C][C]view raw output of R engine [/C][/ROW]
[ROW][C]Computing time[/C][C]1 seconds[/C][/ROW]
[ROW][C]R Server[/C][C]'Gwilym Jenkins' @ 72.249.127.135[/C][/ROW]
[/TABLE]
Source: https://freestatistics.org/blog/index.php?pk=74471&T=0

Globally Unique Identifier (entire table): ba.freestatistics.org/blog/index.php?pk=74471&T=0

As an alternative you can also use a QR Code:  

The GUIDs for individual cells are displayed in the table below:

Summary of computational transaction
Raw Inputview raw input (R code)
Raw Outputview raw output of R engine
Computing time1 seconds
R Server'Gwilym Jenkins' @ 72.249.127.135


Central Tendency - Ungrouped Data
MeasureValueS.E.Value/S.E.
Arithmetic Mean480666.55555555634499.6292465513.9325136545814
Geometric Mean358181.737393779
Harmonic Mean218459.664513429
Quadratic Mean561735.054379064
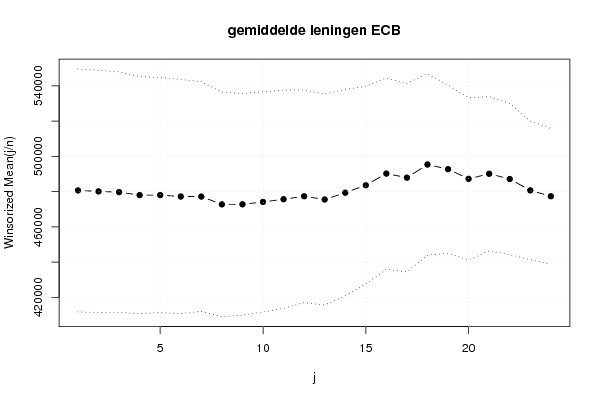
Winsorized Mean ( 1 / 24 )480670.16666666734446.174497498713.9542394381579
Winsorized Mean ( 2 / 24 )480117.33333333334333.082165258013.9841023017493
Winsorized Mean ( 3 / 24 )479694.7534099.338303558214.0675676967592
Winsorized Mean ( 4 / 24 )478024.7533590.210819944314.2310732303047
Winsorized Mean ( 5 / 24 )478024.33333333333349.101715888114.3339493041156
Winsorized Mean ( 6 / 24 )477209.41666666733202.544574465814.372676033802
Winsorized Mean ( 7 / 24 )477188.41666666732548.490602392514.6608462584618
Winsorized Mean ( 8 / 24 )472756.7531834.826897616914.8503006320851
Winsorized Mean ( 9 / 24 )472787.37531429.215322899215.0429264664310
Winsorized Mean ( 10 / 24 )474140.70833333331199.123437779015.1972445405051
Winsorized Mean ( 11 / 24 )475676.43055555630948.678138433715.3698464415136
Winsorized Mean ( 12 / 24 )477352.43055555630167.523954590515.8233878018656
Winsorized Mean ( 13 / 24 )475528.45833333329892.727343886215.9078311210232
Winsorized Mean ( 14 / 24 )479393.43055555629288.043351014716.3682300251357
Winsorized Mean ( 15 / 24 )483613.63888888928056.295098307517.2372594882659
Winsorized Mean ( 16 / 24 )490225.41666666727096.112998419918.0920937514268
Winsorized Mean ( 17 / 24 )487909.87526743.422319463418.2441076228642
Winsorized Mean ( 18 / 24 )495381.12525720.238589007819.2603627406363
Winsorized Mean ( 19 / 24 )492722.44444444423849.933044109120.6592799876286
Winsorized Mean ( 20 / 24 )487251.05555555623030.449853092221.1568188491175
Winsorized Mean ( 21 / 24 )490127.76388888921860.142073249122.4210694627037
Winsorized Mean ( 22 / 24 )487162.65277777821425.47794120522.7375395832304
Winsorized Mean ( 23 / 24 )480693.26388888919676.089074170524.4303256646623
Winsorized Mean ( 24 / 24 )477355.59722222219219.034982412324.8376465134206
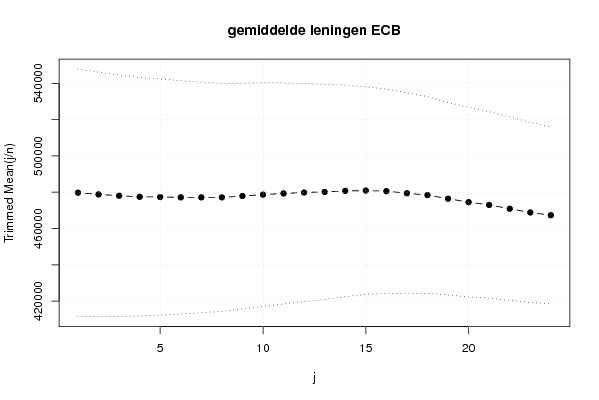
Trimmed Mean ( 1 / 24 )479765.62857142934116.160755915514.0627086384051
Trimmed Mean ( 2 / 24 )478807.88235294133711.337526440114.2031707278718
Trimmed Mean ( 3 / 24 )478093.63636363633287.338499989514.3626272903671
Trimmed Mean ( 4 / 24 )477493.2187532871.021518465114.5262665013855
Trimmed Mean ( 5 / 24 )477338.90322580632536.696065628914.6707859416020
Trimmed Mean ( 6 / 24 )477174.432186.922669139314.8251016384835
Trimmed Mean ( 7 / 24 )477167.15517241431782.206731027515.0136571450395
Trimmed Mean ( 8 / 24 )477163.2531431.286370257315.1811556287918
Trimmed Mean ( 9 / 24 )477897.66666666731140.449478672515.3465243651660
Trimmed Mean ( 10 / 24 )478683.86538461530840.566996603215.5212407553123
Trimmed Mean ( 11 / 24 )479338.0830485.210209607415.7236271852551
Trimmed Mean ( 12 / 24 )479837.39583333330061.024946689915.9621102967805
Trimmed Mean ( 13 / 24 )480161.5217391329658.458798790516.1896990331376
Trimmed Mean ( 14 / 24 )480744.70454545529165.364639781816.4834114190952
Trimmed Mean ( 15 / 24 )480910.16666666728626.098589591216.7997104167570
Trimmed Mean ( 16 / 24 )480585.7528157.868528920817.067547194007
Trimmed Mean ( 17 / 24 )479444.21052631627704.115170186517.3058842551400
Trimmed Mean ( 18 / 24 )478448.2527126.998048432217.6373459807748
Trimmed Mean ( 19 / 24 )476456.14705882426527.420355287417.9608925661653
Trimmed Mean ( 20 / 24 )474529.87526122.921341666318.1652683018695
Trimmed Mean ( 21 / 24 )473003.33333333325698.785806969418.4056685357118
Trimmed Mean ( 22 / 24 )470906.46428571425314.891405017618.6019547448020
Trimmed Mean ( 23 / 24 )468860.23076923124771.542838588518.9273729869927
Trimmed Mean ( 24 / 24 )467316.79166666724437.783672617219.1227157882693
Median457276
Midrange512199
Midmean - Weighted Average at Xnp471527.243243243
Midmean - Weighted Average at X(n+1)p478448.25
Midmean - Empirical Distribution Function471527.243243243
Midmean - Empirical Distribution Function - Averaging478448.25
Midmean - Empirical Distribution Function - Interpolation478448.25
Midmean - Closest Observation471527.243243243
Midmean - True Basic - Statistics Graphics Toolkit478448.25
Midmean - MS Excel (old versions)479444.210526316
Number of observations72

\begin{tabular}{lllllllll}
\hline
Central Tendency - Ungrouped Data \tabularnewline
Measure & Value & S.E. & Value/S.E. \tabularnewline
Arithmetic Mean & 480666.555555556 & 34499.62924655 & 13.9325136545814 \tabularnewline
Geometric Mean & 358181.737393779 &  &  \tabularnewline
Harmonic Mean & 218459.664513429 &  &  \tabularnewline
Quadratic Mean & 561735.054379064 &  &  \tabularnewline
Winsorized Mean ( 1 / 24 ) & 480670.166666667 & 34446.1744974987 & 13.9542394381579 \tabularnewline
Winsorized Mean ( 2 / 24 ) & 480117.333333333 & 34333.0821652580 & 13.9841023017493 \tabularnewline
Winsorized Mean ( 3 / 24 ) & 479694.75 & 34099.3383035582 & 14.0675676967592 \tabularnewline
Winsorized Mean ( 4 / 24 ) & 478024.75 & 33590.2108199443 & 14.2310732303047 \tabularnewline
Winsorized Mean ( 5 / 24 ) & 478024.333333333 & 33349.1017158881 & 14.3339493041156 \tabularnewline
Winsorized Mean ( 6 / 24 ) & 477209.416666667 & 33202.5445744658 & 14.372676033802 \tabularnewline
Winsorized Mean ( 7 / 24 ) & 477188.416666667 & 32548.4906023925 & 14.6608462584618 \tabularnewline
Winsorized Mean ( 8 / 24 ) & 472756.75 & 31834.8268976169 & 14.8503006320851 \tabularnewline
Winsorized Mean ( 9 / 24 ) & 472787.375 & 31429.2153228992 & 15.0429264664310 \tabularnewline
Winsorized Mean ( 10 / 24 ) & 474140.708333333 & 31199.1234377790 & 15.1972445405051 \tabularnewline
Winsorized Mean ( 11 / 24 ) & 475676.430555556 & 30948.6781384337 & 15.3698464415136 \tabularnewline
Winsorized Mean ( 12 / 24 ) & 477352.430555556 & 30167.5239545905 & 15.8233878018656 \tabularnewline
Winsorized Mean ( 13 / 24 ) & 475528.458333333 & 29892.7273438862 & 15.9078311210232 \tabularnewline
Winsorized Mean ( 14 / 24 ) & 479393.430555556 & 29288.0433510147 & 16.3682300251357 \tabularnewline
Winsorized Mean ( 15 / 24 ) & 483613.638888889 & 28056.2950983075 & 17.2372594882659 \tabularnewline
Winsorized Mean ( 16 / 24 ) & 490225.416666667 & 27096.1129984199 & 18.0920937514268 \tabularnewline
Winsorized Mean ( 17 / 24 ) & 487909.875 & 26743.4223194634 & 18.2441076228642 \tabularnewline
Winsorized Mean ( 18 / 24 ) & 495381.125 & 25720.2385890078 & 19.2603627406363 \tabularnewline
Winsorized Mean ( 19 / 24 ) & 492722.444444444 & 23849.9330441091 & 20.6592799876286 \tabularnewline
Winsorized Mean ( 20 / 24 ) & 487251.055555556 & 23030.4498530922 & 21.1568188491175 \tabularnewline
Winsorized Mean ( 21 / 24 ) & 490127.763888889 & 21860.1420732491 & 22.4210694627037 \tabularnewline
Winsorized Mean ( 22 / 24 ) & 487162.652777778 & 21425.477941205 & 22.7375395832304 \tabularnewline
Winsorized Mean ( 23 / 24 ) & 480693.263888889 & 19676.0890741705 & 24.4303256646623 \tabularnewline
Winsorized Mean ( 24 / 24 ) & 477355.597222222 & 19219.0349824123 & 24.8376465134206 \tabularnewline
Trimmed Mean ( 1 / 24 ) & 479765.628571429 & 34116.1607559155 & 14.0627086384051 \tabularnewline
Trimmed Mean ( 2 / 24 ) & 478807.882352941 & 33711.3375264401 & 14.2031707278718 \tabularnewline
Trimmed Mean ( 3 / 24 ) & 478093.636363636 & 33287.3384999895 & 14.3626272903671 \tabularnewline
Trimmed Mean ( 4 / 24 ) & 477493.21875 & 32871.0215184651 & 14.5262665013855 \tabularnewline
Trimmed Mean ( 5 / 24 ) & 477338.903225806 & 32536.6960656289 & 14.6707859416020 \tabularnewline
Trimmed Mean ( 6 / 24 ) & 477174.4 & 32186.9226691393 & 14.8251016384835 \tabularnewline
Trimmed Mean ( 7 / 24 ) & 477167.155172414 & 31782.2067310275 & 15.0136571450395 \tabularnewline
Trimmed Mean ( 8 / 24 ) & 477163.25 & 31431.2863702573 & 15.1811556287918 \tabularnewline
Trimmed Mean ( 9 / 24 ) & 477897.666666667 & 31140.4494786725 & 15.3465243651660 \tabularnewline
Trimmed Mean ( 10 / 24 ) & 478683.865384615 & 30840.5669966032 & 15.5212407553123 \tabularnewline
Trimmed Mean ( 11 / 24 ) & 479338.08 & 30485.2102096074 & 15.7236271852551 \tabularnewline
Trimmed Mean ( 12 / 24 ) & 479837.395833333 & 30061.0249466899 & 15.9621102967805 \tabularnewline
Trimmed Mean ( 13 / 24 ) & 480161.52173913 & 29658.4587987905 & 16.1896990331376 \tabularnewline
Trimmed Mean ( 14 / 24 ) & 480744.704545455 & 29165.3646397818 & 16.4834114190952 \tabularnewline
Trimmed Mean ( 15 / 24 ) & 480910.166666667 & 28626.0985895912 & 16.7997104167570 \tabularnewline
Trimmed Mean ( 16 / 24 ) & 480585.75 & 28157.8685289208 & 17.067547194007 \tabularnewline
Trimmed Mean ( 17 / 24 ) & 479444.210526316 & 27704.1151701865 & 17.3058842551400 \tabularnewline
Trimmed Mean ( 18 / 24 ) & 478448.25 & 27126.9980484322 & 17.6373459807748 \tabularnewline
Trimmed Mean ( 19 / 24 ) & 476456.147058824 & 26527.4203552874 & 17.9608925661653 \tabularnewline
Trimmed Mean ( 20 / 24 ) & 474529.875 & 26122.9213416663 & 18.1652683018695 \tabularnewline
Trimmed Mean ( 21 / 24 ) & 473003.333333333 & 25698.7858069694 & 18.4056685357118 \tabularnewline
Trimmed Mean ( 22 / 24 ) & 470906.464285714 & 25314.8914050176 & 18.6019547448020 \tabularnewline
Trimmed Mean ( 23 / 24 ) & 468860.230769231 & 24771.5428385885 & 18.9273729869927 \tabularnewline
Trimmed Mean ( 24 / 24 ) & 467316.791666667 & 24437.7836726172 & 19.1227157882693 \tabularnewline
Median & 457276 &  &  \tabularnewline
Midrange & 512199 &  &  \tabularnewline
Midmean - Weighted Average at Xnp & 471527.243243243 &  &  \tabularnewline
Midmean - Weighted Average at X(n+1)p & 478448.25 &  &  \tabularnewline
Midmean - Empirical Distribution Function & 471527.243243243 &  &  \tabularnewline
Midmean - Empirical Distribution Function - Averaging & 478448.25 &  &  \tabularnewline
Midmean - Empirical Distribution Function - Interpolation & 478448.25 &  &  \tabularnewline
Midmean - Closest Observation & 471527.243243243 &  &  \tabularnewline
Midmean - True Basic - Statistics Graphics Toolkit & 478448.25 &  &  \tabularnewline
Midmean - MS Excel (old versions) & 479444.210526316 &  &  \tabularnewline
Number of observations & 72 &  &  \tabularnewline
\hline
\end{tabular}
%Source: https://freestatistics.org/blog/index.php?pk=74471&T=1

[TABLE]
[ROW][C]Central Tendency - Ungrouped Data[/C][/ROW]
[ROW][C]Measure[/C][C]Value[/C][C]S.E.[/C][C]Value/S.E.[/C][/ROW]
[ROW][C]Arithmetic Mean[/C][C]480666.555555556[/C][C]34499.62924655[/C][C]13.9325136545814[/C][/ROW]
[ROW][C]Geometric Mean[/C][C]358181.737393779[/C][C][/C][C][/C][/ROW]
[ROW][C]Harmonic Mean[/C][C]218459.664513429[/C][C][/C][C][/C][/ROW]
[ROW][C]Quadratic Mean[/C][C]561735.054379064[/C][C][/C][C][/C][/ROW]
[ROW][C]Winsorized Mean ( 1 / 24 )[/C][C]480670.166666667[/C][C]34446.1744974987[/C][C]13.9542394381579[/C][/ROW]
[ROW][C]Winsorized Mean ( 2 / 24 )[/C][C]480117.333333333[/C][C]34333.0821652580[/C][C]13.9841023017493[/C][/ROW]
[ROW][C]Winsorized Mean ( 3 / 24 )[/C][C]479694.75[/C][C]34099.3383035582[/C][C]14.0675676967592[/C][/ROW]
[ROW][C]Winsorized Mean ( 4 / 24 )[/C][C]478024.75[/C][C]33590.2108199443[/C][C]14.2310732303047[/C][/ROW]
[ROW][C]Winsorized Mean ( 5 / 24 )[/C][C]478024.333333333[/C][C]33349.1017158881[/C][C]14.3339493041156[/C][/ROW]
[ROW][C]Winsorized Mean ( 6 / 24 )[/C][C]477209.416666667[/C][C]33202.5445744658[/C][C]14.372676033802[/C][/ROW]
[ROW][C]Winsorized Mean ( 7 / 24 )[/C][C]477188.416666667[/C][C]32548.4906023925[/C][C]14.6608462584618[/C][/ROW]
[ROW][C]Winsorized Mean ( 8 / 24 )[/C][C]472756.75[/C][C]31834.8268976169[/C][C]14.8503006320851[/C][/ROW]
[ROW][C]Winsorized Mean ( 9 / 24 )[/C][C]472787.375[/C][C]31429.2153228992[/C][C]15.0429264664310[/C][/ROW]
[ROW][C]Winsorized Mean ( 10 / 24 )[/C][C]474140.708333333[/C][C]31199.1234377790[/C][C]15.1972445405051[/C][/ROW]
[ROW][C]Winsorized Mean ( 11 / 24 )[/C][C]475676.430555556[/C][C]30948.6781384337[/C][C]15.3698464415136[/C][/ROW]
[ROW][C]Winsorized Mean ( 12 / 24 )[/C][C]477352.430555556[/C][C]30167.5239545905[/C][C]15.8233878018656[/C][/ROW]
[ROW][C]Winsorized Mean ( 13 / 24 )[/C][C]475528.458333333[/C][C]29892.7273438862[/C][C]15.9078311210232[/C][/ROW]
[ROW][C]Winsorized Mean ( 14 / 24 )[/C][C]479393.430555556[/C][C]29288.0433510147[/C][C]16.3682300251357[/C][/ROW]
[ROW][C]Winsorized Mean ( 15 / 24 )[/C][C]483613.638888889[/C][C]28056.2950983075[/C][C]17.2372594882659[/C][/ROW]
[ROW][C]Winsorized Mean ( 16 / 24 )[/C][C]490225.416666667[/C][C]27096.1129984199[/C][C]18.0920937514268[/C][/ROW]
[ROW][C]Winsorized Mean ( 17 / 24 )[/C][C]487909.875[/C][C]26743.4223194634[/C][C]18.2441076228642[/C][/ROW]
[ROW][C]Winsorized Mean ( 18 / 24 )[/C][C]495381.125[/C][C]25720.2385890078[/C][C]19.2603627406363[/C][/ROW]
[ROW][C]Winsorized Mean ( 19 / 24 )[/C][C]492722.444444444[/C][C]23849.9330441091[/C][C]20.6592799876286[/C][/ROW]
[ROW][C]Winsorized Mean ( 20 / 24 )[/C][C]487251.055555556[/C][C]23030.4498530922[/C][C]21.1568188491175[/C][/ROW]
[ROW][C]Winsorized Mean ( 21 / 24 )[/C][C]490127.763888889[/C][C]21860.1420732491[/C][C]22.4210694627037[/C][/ROW]
[ROW][C]Winsorized Mean ( 22 / 24 )[/C][C]487162.652777778[/C][C]21425.477941205[/C][C]22.7375395832304[/C][/ROW]
[ROW][C]Winsorized Mean ( 23 / 24 )[/C][C]480693.263888889[/C][C]19676.0890741705[/C][C]24.4303256646623[/C][/ROW]
[ROW][C]Winsorized Mean ( 24 / 24 )[/C][C]477355.597222222[/C][C]19219.0349824123[/C][C]24.8376465134206[/C][/ROW]
[ROW][C]Trimmed Mean ( 1 / 24 )[/C][C]479765.628571429[/C][C]34116.1607559155[/C][C]14.0627086384051[/C][/ROW]
[ROW][C]Trimmed Mean ( 2 / 24 )[/C][C]478807.882352941[/C][C]33711.3375264401[/C][C]14.2031707278718[/C][/ROW]
[ROW][C]Trimmed Mean ( 3 / 24 )[/C][C]478093.636363636[/C][C]33287.3384999895[/C][C]14.3626272903671[/C][/ROW]
[ROW][C]Trimmed Mean ( 4 / 24 )[/C][C]477493.21875[/C][C]32871.0215184651[/C][C]14.5262665013855[/C][/ROW]
[ROW][C]Trimmed Mean ( 5 / 24 )[/C][C]477338.903225806[/C][C]32536.6960656289[/C][C]14.6707859416020[/C][/ROW]
[ROW][C]Trimmed Mean ( 6 / 24 )[/C][C]477174.4[/C][C]32186.9226691393[/C][C]14.8251016384835[/C][/ROW]
[ROW][C]Trimmed Mean ( 7 / 24 )[/C][C]477167.155172414[/C][C]31782.2067310275[/C][C]15.0136571450395[/C][/ROW]
[ROW][C]Trimmed Mean ( 8 / 24 )[/C][C]477163.25[/C][C]31431.2863702573[/C][C]15.1811556287918[/C][/ROW]
[ROW][C]Trimmed Mean ( 9 / 24 )[/C][C]477897.666666667[/C][C]31140.4494786725[/C][C]15.3465243651660[/C][/ROW]
[ROW][C]Trimmed Mean ( 10 / 24 )[/C][C]478683.865384615[/C][C]30840.5669966032[/C][C]15.5212407553123[/C][/ROW]
[ROW][C]Trimmed Mean ( 11 / 24 )[/C][C]479338.08[/C][C]30485.2102096074[/C][C]15.7236271852551[/C][/ROW]
[ROW][C]Trimmed Mean ( 12 / 24 )[/C][C]479837.395833333[/C][C]30061.0249466899[/C][C]15.9621102967805[/C][/ROW]
[ROW][C]Trimmed Mean ( 13 / 24 )[/C][C]480161.52173913[/C][C]29658.4587987905[/C][C]16.1896990331376[/C][/ROW]
[ROW][C]Trimmed Mean ( 14 / 24 )[/C][C]480744.704545455[/C][C]29165.3646397818[/C][C]16.4834114190952[/C][/ROW]
[ROW][C]Trimmed Mean ( 15 / 24 )[/C][C]480910.166666667[/C][C]28626.0985895912[/C][C]16.7997104167570[/C][/ROW]
[ROW][C]Trimmed Mean ( 16 / 24 )[/C][C]480585.75[/C][C]28157.8685289208[/C][C]17.067547194007[/C][/ROW]
[ROW][C]Trimmed Mean ( 17 / 24 )[/C][C]479444.210526316[/C][C]27704.1151701865[/C][C]17.3058842551400[/C][/ROW]
[ROW][C]Trimmed Mean ( 18 / 24 )[/C][C]478448.25[/C][C]27126.9980484322[/C][C]17.6373459807748[/C][/ROW]
[ROW][C]Trimmed Mean ( 19 / 24 )[/C][C]476456.147058824[/C][C]26527.4203552874[/C][C]17.9608925661653[/C][/ROW]
[ROW][C]Trimmed Mean ( 20 / 24 )[/C][C]474529.875[/C][C]26122.9213416663[/C][C]18.1652683018695[/C][/ROW]
[ROW][C]Trimmed Mean ( 21 / 24 )[/C][C]473003.333333333[/C][C]25698.7858069694[/C][C]18.4056685357118[/C][/ROW]
[ROW][C]Trimmed Mean ( 22 / 24 )[/C][C]470906.464285714[/C][C]25314.8914050176[/C][C]18.6019547448020[/C][/ROW]
[ROW][C]Trimmed Mean ( 23 / 24 )[/C][C]468860.230769231[/C][C]24771.5428385885[/C][C]18.9273729869927[/C][/ROW]
[ROW][C]Trimmed Mean ( 24 / 24 )[/C][C]467316.791666667[/C][C]24437.7836726172[/C][C]19.1227157882693[/C][/ROW]
[ROW][C]Median[/C][C]457276[/C][C][/C][C][/C][/ROW]
[ROW][C]Midrange[/C][C]512199[/C][C][/C][C][/C][/ROW]
[ROW][C]Midmean - Weighted Average at Xnp[/C][C]471527.243243243[/C][C][/C][C][/C][/ROW]
[ROW][C]Midmean - Weighted Average at X(n+1)p[/C][C]478448.25[/C][C][/C][C][/C][/ROW]
[ROW][C]Midmean - Empirical Distribution Function[/C][C]471527.243243243[/C][C][/C][C][/C][/ROW]
[ROW][C]Midmean - Empirical Distribution Function - Averaging[/C][C]478448.25[/C][C][/C][C][/C][/ROW]
[ROW][C]Midmean - Empirical Distribution Function - Interpolation[/C][C]478448.25[/C][C][/C][C][/C][/ROW]
[ROW][C]Midmean - Closest Observation[/C][C]471527.243243243[/C][C][/C][C][/C][/ROW]
[ROW][C]Midmean - True Basic - Statistics Graphics Toolkit[/C][C]478448.25[/C][C][/C][C][/C][/ROW]
[ROW][C]Midmean - MS Excel (old versions)[/C][C]479444.210526316[/C][C][/C][C][/C][/ROW]
[ROW][C]Number of observations[/C][C]72[/C][C][/C][C][/C][/ROW]
[/TABLE]
Source: https://freestatistics.org/blog/index.php?pk=74471&T=1

Globally Unique Identifier (entire table): ba.freestatistics.org/blog/index.php?pk=74471&T=1

As an alternative you can also use a QR Code:  

The GUIDs for individual cells are displayed in the table below:

Central Tendency - Ungrouped Data
MeasureValueS.E.Value/S.E.
Arithmetic Mean480666.55555555634499.6292465513.9325136545814
Geometric Mean358181.737393779
Harmonic Mean218459.664513429
Quadratic Mean561735.054379064
Winsorized Mean ( 1 / 24 )480670.16666666734446.174497498713.9542394381579
Winsorized Mean ( 2 / 24 )480117.33333333334333.082165258013.9841023017493
Winsorized Mean ( 3 / 24 )479694.7534099.338303558214.0675676967592
Winsorized Mean ( 4 / 24 )478024.7533590.210819944314.2310732303047
Winsorized Mean ( 5 / 24 )478024.33333333333349.101715888114.3339493041156
Winsorized Mean ( 6 / 24 )477209.41666666733202.544574465814.372676033802
Winsorized Mean ( 7 / 24 )477188.41666666732548.490602392514.6608462584618
Winsorized Mean ( 8 / 24 )472756.7531834.826897616914.8503006320851
Winsorized Mean ( 9 / 24 )472787.37531429.215322899215.0429264664310
Winsorized Mean ( 10 / 24 )474140.70833333331199.123437779015.1972445405051
Winsorized Mean ( 11 / 24 )475676.43055555630948.678138433715.3698464415136
Winsorized Mean ( 12 / 24 )477352.43055555630167.523954590515.8233878018656
Winsorized Mean ( 13 / 24 )475528.45833333329892.727343886215.9078311210232
Winsorized Mean ( 14 / 24 )479393.43055555629288.043351014716.3682300251357
Winsorized Mean ( 15 / 24 )483613.63888888928056.295098307517.2372594882659
Winsorized Mean ( 16 / 24 )490225.41666666727096.112998419918.0920937514268
Winsorized Mean ( 17 / 24 )487909.87526743.422319463418.2441076228642
Winsorized Mean ( 18 / 24 )495381.12525720.238589007819.2603627406363
Winsorized Mean ( 19 / 24 )492722.44444444423849.933044109120.6592799876286
Winsorized Mean ( 20 / 24 )487251.05555555623030.449853092221.1568188491175
Winsorized Mean ( 21 / 24 )490127.76388888921860.142073249122.4210694627037
Winsorized Mean ( 22 / 24 )487162.65277777821425.47794120522.7375395832304
Winsorized Mean ( 23 / 24 )480693.26388888919676.089074170524.4303256646623
Winsorized Mean ( 24 / 24 )477355.59722222219219.034982412324.8376465134206
Trimmed Mean ( 1 / 24 )479765.62857142934116.160755915514.0627086384051
Trimmed Mean ( 2 / 24 )478807.88235294133711.337526440114.2031707278718
Trimmed Mean ( 3 / 24 )478093.63636363633287.338499989514.3626272903671
Trimmed Mean ( 4 / 24 )477493.2187532871.021518465114.5262665013855
Trimmed Mean ( 5 / 24 )477338.90322580632536.696065628914.6707859416020
Trimmed Mean ( 6 / 24 )477174.432186.922669139314.8251016384835
Trimmed Mean ( 7 / 24 )477167.15517241431782.206731027515.0136571450395
Trimmed Mean ( 8 / 24 )477163.2531431.286370257315.1811556287918
Trimmed Mean ( 9 / 24 )477897.66666666731140.449478672515.3465243651660
Trimmed Mean ( 10 / 24 )478683.86538461530840.566996603215.5212407553123
Trimmed Mean ( 11 / 24 )479338.0830485.210209607415.7236271852551
Trimmed Mean ( 12 / 24 )479837.39583333330061.024946689915.9621102967805
Trimmed Mean ( 13 / 24 )480161.5217391329658.458798790516.1896990331376
Trimmed Mean ( 14 / 24 )480744.70454545529165.364639781816.4834114190952
Trimmed Mean ( 15 / 24 )480910.16666666728626.098589591216.7997104167570
Trimmed Mean ( 16 / 24 )480585.7528157.868528920817.067547194007
Trimmed Mean ( 17 / 24 )479444.21052631627704.115170186517.3058842551400
Trimmed Mean ( 18 / 24 )478448.2527126.998048432217.6373459807748
Trimmed Mean ( 19 / 24 )476456.14705882426527.420355287417.9608925661653
Trimmed Mean ( 20 / 24 )474529.87526122.921341666318.1652683018695
Trimmed Mean ( 21 / 24 )473003.33333333325698.785806969418.4056685357118
Trimmed Mean ( 22 / 24 )470906.46428571425314.891405017618.6019547448020
Trimmed Mean ( 23 / 24 )468860.23076923124771.542838588518.9273729869927
Trimmed Mean ( 24 / 24 )467316.79166666724437.783672617219.1227157882693
Median457276
Midrange512199
Midmean - Weighted Average at Xnp471527.243243243
Midmean - Weighted Average at X(n+1)p478448.25
Midmean - Empirical Distribution Function471527.243243243
Midmean - Empirical Distribution Function - Averaging478448.25
Midmean - Empirical Distribution Function - Interpolation478448.25
Midmean - Closest Observation471527.243243243
Midmean - True Basic - Statistics Graphics Toolkit478448.25
Midmean - MS Excel (old versions)479444.210526316
Number of observations72


Parameters (Session):
Parameters (R input):
R code (references can be found in the software module):
geomean <- function(x) {
return(exp(mean(log(x))))
}
harmean <- function(x) {
return(1/mean(1/x))
}
quamean <- function(x) {
return(sqrt(mean(x*x)))
}
winmean <- function(x) {
x <-sort(x[!is.na(x)])
n<-length(x)
denom <- 3
nodenom <- n/denom
if (nodenom>40) denom <- n/40
sqrtn = sqrt(n)
roundnodenom = floor(nodenom)
win <- array(NA,dim=c(roundnodenom,2))
for (j in 1:roundnodenom) {
win[j,1] <- (j*x[j+1]+sum(x[(j+1):(n-j)])+j*x[n-j])/n
win[j,2] <- sd(c(rep(x[j+1],j),x[(j+1):(n-j)],rep(x[n-j],j)))/sqrtn
}
return(win)
}
trimean <- function(x) {
x <-sort(x[!is.na(x)])
n<-length(x)
denom <- 3
nodenom <- n/denom
if (nodenom>40) denom <- n/40
sqrtn = sqrt(n)
roundnodenom = floor(nodenom)
tri <- array(NA,dim=c(roundnodenom,2))
for (j in 1:roundnodenom) {
tri[j,1] <- mean(x,trim=j/n)
tri[j,2] <- sd(x[(j+1):(n-j)]) / sqrt(n-j*2)
}
return(tri)
}
midrange <- function(x) {
return((max(x)+min(x))/2)
}
q1 <- function(data,n,p,i,f) {
np <- n*p;
i <<- floor(np)
f <<- np - i
qvalue <- (1-f)*data[i] + f*data[i+1]
}
q2 <- function(data,n,p,i,f) {
np <- (n+1)*p
i <<- floor(np)
f <<- np - i
qvalue <- (1-f)*data[i] + f*data[i+1]
}
q3 <- function(data,n,p,i,f) {
np <- n*p
i <<- floor(np)
f <<- np - i
if (f==0) {
qvalue <- data[i]
} else {
qvalue <- data[i+1]
}
}
q4 <- function(data,n,p,i,f) {
np <- n*p
i <<- floor(np)
f <<- np - i
if (f==0) {
qvalue <- (data[i]+data[i+1])/2
} else {
qvalue <- data[i+1]
}
}
q5 <- function(data,n,p,i,f) {
np <- (n-1)*p
i <<- floor(np)
f <<- np - i
if (f==0) {
qvalue <- data[i+1]
} else {
qvalue <- data[i+1] + f*(data[i+2]-data[i+1])
}
}
q6 <- function(data,n,p,i,f) {
np <- n*p+0.5
i <<- floor(np)
f <<- np - i
qvalue <- data[i]
}
q7 <- function(data,n,p,i,f) {
np <- (n+1)*p
i <<- floor(np)
f <<- np - i
if (f==0) {
qvalue <- data[i]
} else {
qvalue <- f*data[i] + (1-f)*data[i+1]
}
}
q8 <- function(data,n,p,i,f) {
np <- (n+1)*p
i <<- floor(np)
f <<- np - i
if (f==0) {
qvalue <- data[i]
} else {
if (f == 0.5) {
qvalue <- (data[i]+data[i+1])/2
} else {
if (f < 0.5) {
qvalue <- data[i]
} else {
qvalue <- data[i+1]
}
}
}
}
midmean <- function(x,def) {
x <-sort(x[!is.na(x)])
n<-length(x)
if (def==1) {
qvalue1 <- q1(x,n,0.25,i,f)
qvalue3 <- q1(x,n,0.75,i,f)
}
if (def==2) {
qvalue1 <- q2(x,n,0.25,i,f)
qvalue3 <- q2(x,n,0.75,i,f)
}
if (def==3) {
qvalue1 <- q3(x,n,0.25,i,f)
qvalue3 <- q3(x,n,0.75,i,f)
}
if (def==4) {
qvalue1 <- q4(x,n,0.25,i,f)
qvalue3 <- q4(x,n,0.75,i,f)
}
if (def==5) {
qvalue1 <- q5(x,n,0.25,i,f)
qvalue3 <- q5(x,n,0.75,i,f)
}
if (def==6) {
qvalue1 <- q6(x,n,0.25,i,f)
qvalue3 <- q6(x,n,0.75,i,f)
}
if (def==7) {
qvalue1 <- q7(x,n,0.25,i,f)
qvalue3 <- q7(x,n,0.75,i,f)
}
if (def==8) {
qvalue1 <- q8(x,n,0.25,i,f)
qvalue3 <- q8(x,n,0.75,i,f)
}
midm <- 0
myn <- 0
roundno4 <- round(n/4)
round3no4 <- round(3*n/4)
for (i in 1:n) {
if ((x[i]>=qvalue1) & (x[i]<=qvalue3)){
midm = midm + x[i]
myn = myn + 1
}
}
midm = midm / myn
return(midm)
}
(arm <- mean(x))
sqrtn <- sqrt(length(x))
(armse <- sd(x) / sqrtn)
(armose <- arm / armse)
(geo <- geomean(x))
(har <- harmean(x))
(qua <- quamean(x))
(win <- winmean(x))
(tri <- trimean(x))
(midr <- midrange(x))
midm <- array(NA,dim=8)
for (j in 1:8) midm[j] <- midmean(x,j)
midm
bitmap(file='test1.png')
lb <- win[,1] - 2*win[,2]
ub <- win[,1] + 2*win[,2]
if ((ylimmin == '') | (ylimmax == '')) plot(win[,1],type='b',main=main, xlab='j', pch=19, ylab='Winsorized Mean(j/n)', ylim=c(min(lb),max(ub))) else plot(win[,1],type='l',main=main, xlab='j', pch=19, ylab='Winsorized Mean(j/n)', ylim=c(ylimmin,ylimmax))
lines(ub,lty=3)
lines(lb,lty=3)
grid()
dev.off()
bitmap(file='test2.png')
lb <- tri[,1] - 2*tri[,2]
ub <- tri[,1] + 2*tri[,2]
if ((ylimmin == '') | (ylimmax == '')) plot(tri[,1],type='b',main=main, xlab='j', pch=19, ylab='Trimmed Mean(j/n)', ylim=c(min(lb),max(ub))) else plot(tri[,1],type='l',main=main, xlab='j', pch=19, ylab='Trimmed Mean(j/n)', ylim=c(ylimmin,ylimmax))
lines(ub,lty=3)
lines(lb,lty=3)
grid()
dev.off()
load(file='createtable')
a<-table.start()
a<-table.row.start(a)
a<-table.element(a,'Central Tendency - Ungrouped Data',4,TRUE)
a<-table.row.end(a)
a<-table.row.start(a)
a<-table.element(a,'Measure',header=TRUE)
a<-table.element(a,'Value',header=TRUE)
a<-table.element(a,'S.E.',header=TRUE)
a<-table.element(a,'Value/S.E.',header=TRUE)
a<-table.row.end(a)
a<-table.row.start(a)
a<-table.element(a,hyperlink('arithmetic_mean.htm', 'Arithmetic Mean', 'click to view the definition of the Arithmetic Mean'),header=TRUE)
a<-table.element(a,arm)
a<-table.element(a,hyperlink('arithmetic_mean_standard_error.htm', armse, 'click to view the definition of the Standard Error of the Arithmetic Mean'))
a<-table.element(a,armose)
a<-table.row.end(a)
a<-table.row.start(a)
a<-table.element(a,hyperlink('geometric_mean.htm', 'Geometric Mean', 'click to view the definition of the Geometric Mean'),header=TRUE)
a<-table.element(a,geo)
a<-table.element(a,'')
a<-table.row.end(a)
a<-table.row.start(a)
a<-table.element(a,hyperlink('harmonic_mean.htm', 'Harmonic Mean', 'click to view the definition of the Harmonic Mean'),header=TRUE)
a<-table.element(a,har)
a<-table.element(a,'')
a<-table.row.end(a)
a<-table.row.start(a)
a<-table.element(a,hyperlink('quadratic_mean.htm', 'Quadratic Mean', 'click to view the definition of the Quadratic Mean'),header=TRUE)
a<-table.element(a,qua)
a<-table.element(a,'')
a<-table.row.end(a)
for (j in 1:length(win[,1])) {
a<-table.row.start(a)
mylabel <- paste('Winsorized Mean (',j)
mylabel <- paste(mylabel,'/')
mylabel <- paste(mylabel,length(win[,1]))
mylabel <- paste(mylabel,')')
a<-table.element(a,hyperlink('winsorized_mean.htm', mylabel, 'click to view the definition of the Winsorized Mean'),header=TRUE)
a<-table.element(a,win[j,1])
a<-table.element(a,win[j,2])
a<-table.element(a,win[j,1]/win[j,2])
a<-table.row.end(a)
}
for (j in 1:length(tri[,1])) {
a<-table.row.start(a)
mylabel <- paste('Trimmed Mean (',j)
mylabel <- paste(mylabel,'/')
mylabel <- paste(mylabel,length(tri[,1]))
mylabel <- paste(mylabel,')')
a<-table.element(a,hyperlink('arithmetic_mean.htm', mylabel, 'click to view the definition of the Trimmed Mean'),header=TRUE)
a<-table.element(a,tri[j,1])
a<-table.element(a,tri[j,2])
a<-table.element(a,tri[j,1]/tri[j,2])
a<-table.row.end(a)
}
a<-table.row.start(a)
a<-table.element(a,hyperlink('median_1.htm', 'Median', 'click to view the definition of the Median'),header=TRUE)
a<-table.element(a,median(x))
a<-table.element(a,'')
a<-table.row.end(a)
a<-table.row.start(a)
a<-table.element(a,hyperlink('midrange.htm', 'Midrange', 'click to view the definition of the Midrange'),header=TRUE)
a<-table.element(a,midr)
a<-table.element(a,'')
a<-table.row.end(a)
a<-table.row.start(a)
mymid <- hyperlink('midmean.htm', 'Midmean', 'click to view the definition of the Midmean')
mylabel <- paste(mymid,hyperlink('method_1.htm','Weighted Average at Xnp',''),sep=' - ')
a<-table.element(a,mylabel,header=TRUE)
a<-table.element(a,midm[1])
a<-table.element(a,'')
a<-table.row.end(a)
a<-table.row.start(a)
mymid <- hyperlink('midmean.htm', 'Midmean', 'click to view the definition of the Midmean')
mylabel <- paste(mymid,hyperlink('method_2.htm','Weighted Average at X(n+1)p',''),sep=' - ')
a<-table.element(a,mylabel,header=TRUE)
a<-table.element(a,midm[2])
a<-table.element(a,'')
a<-table.row.end(a)
a<-table.row.start(a)
mymid <- hyperlink('midmean.htm', 'Midmean', 'click to view the definition of the Midmean')
mylabel <- paste(mymid,hyperlink('method_3.htm','Empirical Distribution Function',''),sep=' - ')
a<-table.element(a,mylabel,header=TRUE)
a<-table.element(a,midm[3])
a<-table.element(a,'')
a<-table.row.end(a)
a<-table.row.start(a)
mymid <- hyperlink('midmean.htm', 'Midmean', 'click to view the definition of the Midmean')
mylabel <- paste(mymid,hyperlink('method_4.htm','Empirical Distribution Function - Averaging',''),sep=' - ')
a<-table.element(a,mylabel,header=TRUE)
a<-table.element(a,midm[4])
a<-table.element(a,'')
a<-table.row.end(a)
a<-table.row.start(a)
mymid <- hyperlink('midmean.htm', 'Midmean', 'click to view the definition of the Midmean')
mylabel <- paste(mymid,hyperlink('method_5.htm','Empirical Distribution Function - Interpolation',''),sep=' - ')
a<-table.element(a,mylabel,header=TRUE)
a<-table.element(a,midm[5])
a<-table.element(a,'')
a<-table.row.end(a)
a<-table.row.start(a)
mymid <- hyperlink('midmean.htm', 'Midmean', 'click to view the definition of the Midmean')
mylabel <- paste(mymid,hyperlink('method_6.htm','Closest Observation',''),sep=' - ')
a<-table.element(a,mylabel,header=TRUE)
a<-table.element(a,midm[6])
a<-table.element(a,'')
a<-table.row.end(a)
a<-table.row.start(a)
mymid <- hyperlink('midmean.htm', 'Midmean', 'click to view the definition of the Midmean')
mylabel <- paste(mymid,hyperlink('method_7.htm','True Basic - Statistics Graphics Toolkit',''),sep=' - ')
a<-table.element(a,mylabel,header=TRUE)
a<-table.element(a,midm[7])
a<-table.element(a,'')
a<-table.row.end(a)
a<-table.row.start(a)
mymid <- hyperlink('midmean.htm', 'Midmean', 'click to view the definition of the Midmean')
mylabel <- paste(mymid,hyperlink('method_8.htm','MS Excel (old versions)',''),sep=' - ')
a<-table.element(a,mylabel,header=TRUE)
a<-table.element(a,midm[8])
a<-table.element(a,'')
a<-table.row.end(a)
a<-table.row.start(a)
a<-table.element(a,'Number of observations',header=TRUE)
a<-table.element(a,length(x))
a<-table.element(a,'')
a<-table.row.end(a)
a<-table.end(a)
table.save(a,file='mytable.tab')