Free Statistics

of Irreproducible Research!

Author's title

Author*Unverified author*
R Software Modulerwasp_meanversusmedian.wasp
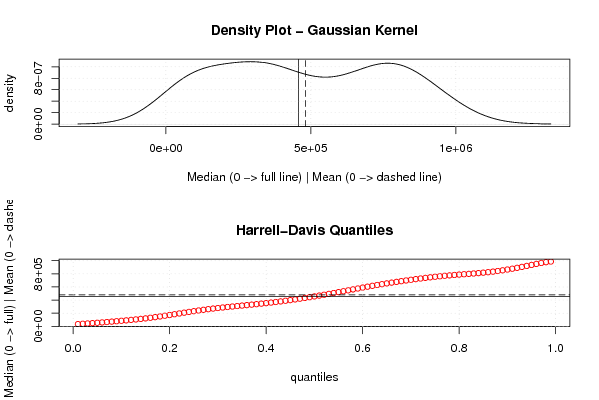
Title produced by softwareMean versus Median
Date of computationTue, 16 Mar 2010 12:01:40 -0600
Cite this page as followsStatistical Computations at FreeStatistics.org, Office for Research Development and Education, URL https://freestatistics.org/blog/index.php?v=date/2010/Mar/16/t1268762833h0gs32vevps8lkj.htm/, Retrieved Thu, 25 Apr 2024 10:05:23 +0000
Statistical Computations at FreeStatistics.org, Office for Research Development and Education, URL https://freestatistics.org/blog/index.php?pk=74473, Retrieved Thu, 25 Apr 2024 10:05:23 +0000
QR Codes:

Original text written by user:
IsPrivate?No (this computation is public)
User-defined keywordsKDGP1W52
Estimated Impact200
Family? (F = Feedback message, R = changed R code, M = changed R Module, P = changed Parameters, D = changed Data)
-       [Mean versus Median] [Vergelijk leninge...] [2010-03-16 18:01:40] [819ef9efcbdcdc4b312cf90f12d3a4d4] [Current]
Feedback Forum

Post a new message
Dataseries X:
792108
472123
272128
992139
642162
352145
492169
92174
462193
92207
792222
72225
782230
52241
332266
902266
402287
812304
532313
802330
342322
222320
42314
252298
892323
392342
772330
982344
592342
662360
882362
942373
222371
632404
782475
372472
822461
142441
142435
742425
672393
302390
862379
772372
302370
452359
112353
442320
512322
192322
292303
962280
322321
362301
62288
812271
32259
72407
332399
712416
162432
652423
272420
642433
512435
722436
292453
812469
102444
122438
42476
702562


Summary of computational transaction
Raw Inputview raw input (R code)
Raw Outputview raw output of R engine
Computing time2 seconds
R Server'Gwilym Jenkins' @ 72.249.127.135

\begin{tabular}{lllllllll}
\hline
Summary of computational transaction \tabularnewline
Raw Input & view raw input (R code)  \tabularnewline
Raw Output & view raw output of R engine  \tabularnewline
Computing time & 2 seconds \tabularnewline
R Server & 'Gwilym Jenkins' @ 72.249.127.135 \tabularnewline
\hline
\end{tabular}
%Source: https://freestatistics.org/blog/index.php?pk=74473&T=0

[TABLE]
[ROW][C]Summary of computational transaction[/C][/ROW]
[ROW][C]Raw Input[/C][C]view raw input (R code) [/C][/ROW]
[ROW][C]Raw Output[/C][C]view raw output of R engine [/C][/ROW]
[ROW][C]Computing time[/C][C]2 seconds[/C][/ROW]
[ROW][C]R Server[/C][C]'Gwilym Jenkins' @ 72.249.127.135[/C][/ROW]
[/TABLE]
Source: https://freestatistics.org/blog/index.php?pk=74473&T=0

Globally Unique Identifier (entire table): ba.freestatistics.org/blog/index.php?pk=74473&T=0

As an alternative you can also use a QR Code:  

The GUIDs for individual cells are displayed in the table below:

Summary of computational transaction
Raw Inputview raw input (R code)
Raw Outputview raw output of R engine
Computing time2 seconds
R Server'Gwilym Jenkins' @ 72.249.127.135


Median versus Mean
mean480666.555555556
median457276

\begin{tabular}{lllllllll}
\hline
Median versus Mean \tabularnewline
mean & 480666.555555556 \tabularnewline
median & 457276 \tabularnewline
\hline
\end{tabular}
%Source: https://freestatistics.org/blog/index.php?pk=74473&T=1

[TABLE]
[ROW][C]Median versus Mean[/C][/ROW]
[ROW][C]mean[/C][C]480666.555555556[/C][/ROW]
[ROW][C]median[/C][C]457276[/C][/ROW]
[/TABLE]
Source: https://freestatistics.org/blog/index.php?pk=74473&T=1

Globally Unique Identifier (entire table): ba.freestatistics.org/blog/index.php?pk=74473&T=1

As an alternative you can also use a QR Code:  

The GUIDs for individual cells are displayed in the table below:

Median versus Mean
mean480666.555555556
median457276


Parameters (Session):
Parameters (R input):
R code (references can be found in the software module):
library(Hmisc)
m <- mean(x)
e <- median(x)
bitmap(file='test1.png')
op <- par(mfrow=c(2,1))
mydensity1 <- density(x,kernel='gaussian',na.rm=TRUE)
plot(mydensity1,main='Density Plot - Gaussian Kernel',xlab='Median (0 -> full line) | Mean (0 -> dashed line)',ylab='density')
abline(v=e,lty=1)
abline(v=m,lty=5)
grid()
myseq <- seq(0.01, 0.99, 0.01)
hd <- hdquantile(x, probs = myseq, se = TRUE, na.rm = FALSE, names = TRUE, weights=FALSE)
plot(myseq,hd,col=2,main='Harrell-Davis Quantiles',xlab='quantiles',ylab='Median (0 -> full) | Mean (0 -> dashed)')
abline(h=m,lty=5)
abline(h=e,lty=1)
grid()
par(op)
dev.off()
load(file='createtable')
a<-table.start()
a<-table.row.start(a)
a<-table.element(a,'Median versus Mean',2,TRUE)
a<-table.row.end(a)
a<-table.row.start(a)
a<-table.element(a,'mean',header=TRUE)
a<-table.element(a,mean(x))
a<-table.row.end(a)
a<-table.row.start(a)
a<-table.element(a,'median',header=TRUE)
a<-table.element(a,median(x))
a<-table.row.end(a)
a<-table.end(a)
table.save(a,file='mytable.tab')