Free Statistics

of Irreproducible Research!

Author's title

Author*Unverified author*
R Software Modulerwasp_autocorrelation.wasp
Title produced by software(Partial) Autocorrelation Function
Date of computationMon, 03 May 2010 18:13:08 +0000
Cite this page as followsStatistical Computations at FreeStatistics.org, Office for Research Development and Education, URL https://freestatistics.org/blog/index.php?v=date/2010/May/03/t1272910422nhvd05hwncf64rp.htm/, Retrieved Fri, 19 Apr 2024 06:48:29 +0000
Statistical Computations at FreeStatistics.org, Office for Research Development and Education, URL https://freestatistics.org/blog/index.php?pk=75284, Retrieved Fri, 19 Apr 2024 06:48:29 +0000
QR Codes:

Original text written by user:
IsPrivate?No (this computation is public)
User-defined keywordsKDGP2W21
Estimated Impact178
Family? (F = Feedback message, R = changed R code, M = changed R Module, P = changed Parameters, D = changed Data)
-     [Histogram] [Datareeks-Inschri...] [2010-02-08 14:03:15] [c656187b38b4f6e6948d94f8dfe6ded2]
- RMP   [Harrell-Davis Quantiles] [Datareeks-Opdrach...] [2010-03-08 17:35:01] [1f3241a8f2363a866734862cbbf73252]
- RMPD    [Mean Plot] [Opgave 6 oefening...] [2010-04-26 21:57:04] [1f3241a8f2363a866734862cbbf73252]
- RMPD      [(Partial) Autocorrelation Function] [Opgave 6 BIS oefe...] [2010-05-03 18:06:05] [1f3241a8f2363a866734862cbbf73252]
-   P           [(Partial) Autocorrelation Function] [Opgave 6 BIS oefe...] [2010-05-03 18:13:08] [8c87877ca0a068b5d9f0f8fa9cf6c0e7] [Current]
Feedback Forum

Post a new message
Dataseries X:
41086
39690
43129
37863
35953
29133
24693
22205
21725
27192
21790
13253
37702
30364
32609
30212
29965
28352
25814
22414
20506
28806
22228
13971
36845
35338
35022
34777
26887
23970
22780
17351
21382
24561
17409
11514
31514
27071
29462
26105
22397
23843
21705
18089
20764
25316
17704
15548
28029
29383
36438
32034
22679
24319
18004
17537
20366
22782
19169
13807
29743
25591
29096
26482
22405
27044
17970
18730
19684
19785
18479
10698
31956
29506
34506
27165
26736
23691
18157
17328
18205
20995
17382
9367
31124
26551
30651
25859
25100
25778
20418
18688
20424
24776
19814
12738
31566
30111
30019
31934
25826
26835
20205
17789
20520
22518
15572
11509
25447
24090
27786
26195
20516
22759
19028
16971
20036
22485
18730
14538


Summary of computational transaction
Raw Inputview raw input (R code)
Raw Outputview raw output of R engine
Computing time1 seconds
R Server'George Udny Yule' @ 72.249.76.132

\begin{tabular}{lllllllll}
\hline
Summary of computational transaction \tabularnewline
Raw Input & view raw input (R code)  \tabularnewline
Raw Output & view raw output of R engine  \tabularnewline
Computing time & 1 seconds \tabularnewline
R Server & 'George Udny Yule' @ 72.249.76.132 \tabularnewline
\hline
\end{tabular}
%Source: https://freestatistics.org/blog/index.php?pk=75284&T=0

[TABLE]
[ROW][C]Summary of computational transaction[/C][/ROW]
[ROW][C]Raw Input[/C][C]view raw input (R code) [/C][/ROW]
[ROW][C]Raw Output[/C][C]view raw output of R engine [/C][/ROW]
[ROW][C]Computing time[/C][C]1 seconds[/C][/ROW]
[ROW][C]R Server[/C][C]'George Udny Yule' @ 72.249.76.132[/C][/ROW]
[/TABLE]
Source: https://freestatistics.org/blog/index.php?pk=75284&T=0

Globally Unique Identifier (entire table): ba.freestatistics.org/blog/index.php?pk=75284&T=0

As an alternative you can also use a QR Code:  

The GUIDs for individual cells are displayed in the table below:

Summary of computational transaction
Raw Inputview raw input (R code)
Raw Outputview raw output of R engine
Computing time1 seconds
R Server'George Udny Yule' @ 72.249.76.132


Autocorrelation Function
Time lag kACF(k)T-STATP-value
1-0.315496-3.44170.000399
2-0.08603-0.93850.174951
30.0712490.77720.219283
4-0.085986-0.9380.175073
50.0514470.56120.287853
6-0.193569-2.11160.018407
7-0.00856-0.09340.462878
8-0.019607-0.21390.415499
90.0489350.53380.297231
10-0.105943-1.15570.125058
11-0.248522-2.71110.00385
120.7944868.66680
13-0.250211-2.72950.003653
14-0.061976-0.67610.25015
150.0713890.77880.218832
16-0.113798-1.24140.108451
170.0933311.01810.155343
18-0.193299-2.10860.018536
19-0.019853-0.21660.414458
200.0187810.20490.419007
21-0.010362-0.1130.455096
22-0.096649-1.05430.146937
23-0.154402-1.68430.047369
240.6449217.03530
25-0.186977-2.03970.021798
26-0.032284-0.35220.362664
270.022990.25080.401203
28-0.086604-0.94470.173353
290.1074381.1720.121767
30-0.209948-2.29030.011884
310.0185860.20280.419837
320.0078050.08510.466147
33-0.023287-0.2540.399954
34-0.050248-0.54810.292311
35-0.14913-1.62680.05321
360.5144725.61220
37-0.141644-1.54520.062482
38-0.032128-0.35050.363302
390.0211010.23020.409171
40-0.062571-0.68260.248104
410.073010.79640.21368
42-0.178444-1.94660.02697
430.0407340.44440.328797
44-0.012285-0.1340.446811
45-0.040101-0.43750.331287
46-0.015265-0.16650.434014
47-0.157252-1.71540.044436
480.4736475.16690

\begin{tabular}{lllllllll}
\hline
Autocorrelation Function \tabularnewline
Time lag k & ACF(k) & T-STAT & P-value \tabularnewline
1 & -0.315496 & -3.4417 & 0.000399 \tabularnewline
2 & -0.08603 & -0.9385 & 0.174951 \tabularnewline
3 & 0.071249 & 0.7772 & 0.219283 \tabularnewline
4 & -0.085986 & -0.938 & 0.175073 \tabularnewline
5 & 0.051447 & 0.5612 & 0.287853 \tabularnewline
6 & -0.193569 & -2.1116 & 0.018407 \tabularnewline
7 & -0.00856 & -0.0934 & 0.462878 \tabularnewline
8 & -0.019607 & -0.2139 & 0.415499 \tabularnewline
9 & 0.048935 & 0.5338 & 0.297231 \tabularnewline
10 & -0.105943 & -1.1557 & 0.125058 \tabularnewline
11 & -0.248522 & -2.7111 & 0.00385 \tabularnewline
12 & 0.794486 & 8.6668 & 0 \tabularnewline
13 & -0.250211 & -2.7295 & 0.003653 \tabularnewline
14 & -0.061976 & -0.6761 & 0.25015 \tabularnewline
15 & 0.071389 & 0.7788 & 0.218832 \tabularnewline
16 & -0.113798 & -1.2414 & 0.108451 \tabularnewline
17 & 0.093331 & 1.0181 & 0.155343 \tabularnewline
18 & -0.193299 & -2.1086 & 0.018536 \tabularnewline
19 & -0.019853 & -0.2166 & 0.414458 \tabularnewline
20 & 0.018781 & 0.2049 & 0.419007 \tabularnewline
21 & -0.010362 & -0.113 & 0.455096 \tabularnewline
22 & -0.096649 & -1.0543 & 0.146937 \tabularnewline
23 & -0.154402 & -1.6843 & 0.047369 \tabularnewline
24 & 0.644921 & 7.0353 & 0 \tabularnewline
25 & -0.186977 & -2.0397 & 0.021798 \tabularnewline
26 & -0.032284 & -0.3522 & 0.362664 \tabularnewline
27 & 0.02299 & 0.2508 & 0.401203 \tabularnewline
28 & -0.086604 & -0.9447 & 0.173353 \tabularnewline
29 & 0.107438 & 1.172 & 0.121767 \tabularnewline
30 & -0.209948 & -2.2903 & 0.011884 \tabularnewline
31 & 0.018586 & 0.2028 & 0.419837 \tabularnewline
32 & 0.007805 & 0.0851 & 0.466147 \tabularnewline
33 & -0.023287 & -0.254 & 0.399954 \tabularnewline
34 & -0.050248 & -0.5481 & 0.292311 \tabularnewline
35 & -0.14913 & -1.6268 & 0.05321 \tabularnewline
36 & 0.514472 & 5.6122 & 0 \tabularnewline
37 & -0.141644 & -1.5452 & 0.062482 \tabularnewline
38 & -0.032128 & -0.3505 & 0.363302 \tabularnewline
39 & 0.021101 & 0.2302 & 0.409171 \tabularnewline
40 & -0.062571 & -0.6826 & 0.248104 \tabularnewline
41 & 0.07301 & 0.7964 & 0.21368 \tabularnewline
42 & -0.178444 & -1.9466 & 0.02697 \tabularnewline
43 & 0.040734 & 0.4444 & 0.328797 \tabularnewline
44 & -0.012285 & -0.134 & 0.446811 \tabularnewline
45 & -0.040101 & -0.4375 & 0.331287 \tabularnewline
46 & -0.015265 & -0.1665 & 0.434014 \tabularnewline
47 & -0.157252 & -1.7154 & 0.044436 \tabularnewline
48 & 0.473647 & 5.1669 & 0 \tabularnewline
\hline
\end{tabular}
%Source: https://freestatistics.org/blog/index.php?pk=75284&T=1

[TABLE]
[ROW][C]Autocorrelation Function[/C][/ROW]
[ROW][C]Time lag k[/C][C]ACF(k)[/C][C]T-STAT[/C][C]P-value[/C][/ROW]
[ROW][C]1[/C][C]-0.315496[/C][C]-3.4417[/C][C]0.000399[/C][/ROW]
[ROW][C]2[/C][C]-0.08603[/C][C]-0.9385[/C][C]0.174951[/C][/ROW]
[ROW][C]3[/C][C]0.071249[/C][C]0.7772[/C][C]0.219283[/C][/ROW]
[ROW][C]4[/C][C]-0.085986[/C][C]-0.938[/C][C]0.175073[/C][/ROW]
[ROW][C]5[/C][C]0.051447[/C][C]0.5612[/C][C]0.287853[/C][/ROW]
[ROW][C]6[/C][C]-0.193569[/C][C]-2.1116[/C][C]0.018407[/C][/ROW]
[ROW][C]7[/C][C]-0.00856[/C][C]-0.0934[/C][C]0.462878[/C][/ROW]
[ROW][C]8[/C][C]-0.019607[/C][C]-0.2139[/C][C]0.415499[/C][/ROW]
[ROW][C]9[/C][C]0.048935[/C][C]0.5338[/C][C]0.297231[/C][/ROW]
[ROW][C]10[/C][C]-0.105943[/C][C]-1.1557[/C][C]0.125058[/C][/ROW]
[ROW][C]11[/C][C]-0.248522[/C][C]-2.7111[/C][C]0.00385[/C][/ROW]
[ROW][C]12[/C][C]0.794486[/C][C]8.6668[/C][C]0[/C][/ROW]
[ROW][C]13[/C][C]-0.250211[/C][C]-2.7295[/C][C]0.003653[/C][/ROW]
[ROW][C]14[/C][C]-0.061976[/C][C]-0.6761[/C][C]0.25015[/C][/ROW]
[ROW][C]15[/C][C]0.071389[/C][C]0.7788[/C][C]0.218832[/C][/ROW]
[ROW][C]16[/C][C]-0.113798[/C][C]-1.2414[/C][C]0.108451[/C][/ROW]
[ROW][C]17[/C][C]0.093331[/C][C]1.0181[/C][C]0.155343[/C][/ROW]
[ROW][C]18[/C][C]-0.193299[/C][C]-2.1086[/C][C]0.018536[/C][/ROW]
[ROW][C]19[/C][C]-0.019853[/C][C]-0.2166[/C][C]0.414458[/C][/ROW]
[ROW][C]20[/C][C]0.018781[/C][C]0.2049[/C][C]0.419007[/C][/ROW]
[ROW][C]21[/C][C]-0.010362[/C][C]-0.113[/C][C]0.455096[/C][/ROW]
[ROW][C]22[/C][C]-0.096649[/C][C]-1.0543[/C][C]0.146937[/C][/ROW]
[ROW][C]23[/C][C]-0.154402[/C][C]-1.6843[/C][C]0.047369[/C][/ROW]
[ROW][C]24[/C][C]0.644921[/C][C]7.0353[/C][C]0[/C][/ROW]
[ROW][C]25[/C][C]-0.186977[/C][C]-2.0397[/C][C]0.021798[/C][/ROW]
[ROW][C]26[/C][C]-0.032284[/C][C]-0.3522[/C][C]0.362664[/C][/ROW]
[ROW][C]27[/C][C]0.02299[/C][C]0.2508[/C][C]0.401203[/C][/ROW]
[ROW][C]28[/C][C]-0.086604[/C][C]-0.9447[/C][C]0.173353[/C][/ROW]
[ROW][C]29[/C][C]0.107438[/C][C]1.172[/C][C]0.121767[/C][/ROW]
[ROW][C]30[/C][C]-0.209948[/C][C]-2.2903[/C][C]0.011884[/C][/ROW]
[ROW][C]31[/C][C]0.018586[/C][C]0.2028[/C][C]0.419837[/C][/ROW]
[ROW][C]32[/C][C]0.007805[/C][C]0.0851[/C][C]0.466147[/C][/ROW]
[ROW][C]33[/C][C]-0.023287[/C][C]-0.254[/C][C]0.399954[/C][/ROW]
[ROW][C]34[/C][C]-0.050248[/C][C]-0.5481[/C][C]0.292311[/C][/ROW]
[ROW][C]35[/C][C]-0.14913[/C][C]-1.6268[/C][C]0.05321[/C][/ROW]
[ROW][C]36[/C][C]0.514472[/C][C]5.6122[/C][C]0[/C][/ROW]
[ROW][C]37[/C][C]-0.141644[/C][C]-1.5452[/C][C]0.062482[/C][/ROW]
[ROW][C]38[/C][C]-0.032128[/C][C]-0.3505[/C][C]0.363302[/C][/ROW]
[ROW][C]39[/C][C]0.021101[/C][C]0.2302[/C][C]0.409171[/C][/ROW]
[ROW][C]40[/C][C]-0.062571[/C][C]-0.6826[/C][C]0.248104[/C][/ROW]
[ROW][C]41[/C][C]0.07301[/C][C]0.7964[/C][C]0.21368[/C][/ROW]
[ROW][C]42[/C][C]-0.178444[/C][C]-1.9466[/C][C]0.02697[/C][/ROW]
[ROW][C]43[/C][C]0.040734[/C][C]0.4444[/C][C]0.328797[/C][/ROW]
[ROW][C]44[/C][C]-0.012285[/C][C]-0.134[/C][C]0.446811[/C][/ROW]
[ROW][C]45[/C][C]-0.040101[/C][C]-0.4375[/C][C]0.331287[/C][/ROW]
[ROW][C]46[/C][C]-0.015265[/C][C]-0.1665[/C][C]0.434014[/C][/ROW]
[ROW][C]47[/C][C]-0.157252[/C][C]-1.7154[/C][C]0.044436[/C][/ROW]
[ROW][C]48[/C][C]0.473647[/C][C]5.1669[/C][C]0[/C][/ROW]
[/TABLE]
Source: https://freestatistics.org/blog/index.php?pk=75284&T=1

Globally Unique Identifier (entire table): ba.freestatistics.org/blog/index.php?pk=75284&T=1

As an alternative you can also use a QR Code:  

The GUIDs for individual cells are displayed in the table below:

Autocorrelation Function
Time lag kACF(k)T-STATP-value
1-0.315496-3.44170.000399
2-0.08603-0.93850.174951
30.0712490.77720.219283
4-0.085986-0.9380.175073
50.0514470.56120.287853
6-0.193569-2.11160.018407
7-0.00856-0.09340.462878
8-0.019607-0.21390.415499
90.0489350.53380.297231
10-0.105943-1.15570.125058
11-0.248522-2.71110.00385
120.7944868.66680
13-0.250211-2.72950.003653
14-0.061976-0.67610.25015
150.0713890.77880.218832
16-0.113798-1.24140.108451
170.0933311.01810.155343
18-0.193299-2.10860.018536
19-0.019853-0.21660.414458
200.0187810.20490.419007
21-0.010362-0.1130.455096
22-0.096649-1.05430.146937
23-0.154402-1.68430.047369
240.6449217.03530
25-0.186977-2.03970.021798
26-0.032284-0.35220.362664
270.022990.25080.401203
28-0.086604-0.94470.173353
290.1074381.1720.121767
30-0.209948-2.29030.011884
310.0185860.20280.419837
320.0078050.08510.466147
33-0.023287-0.2540.399954
34-0.050248-0.54810.292311
35-0.14913-1.62680.05321
360.5144725.61220
37-0.141644-1.54520.062482
38-0.032128-0.35050.363302
390.0211010.23020.409171
40-0.062571-0.68260.248104
410.073010.79640.21368
42-0.178444-1.94660.02697
430.0407340.44440.328797
44-0.012285-0.1340.446811
45-0.040101-0.43750.331287
46-0.015265-0.16650.434014
47-0.157252-1.71540.044436
480.4736475.16690


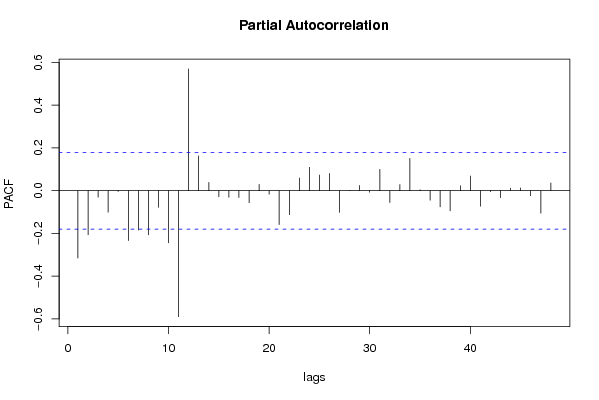
Partial Autocorrelation Function
Time lag kPACF(k)T-STATP-value
1-0.315496-3.44170.000399
2-0.20608-2.24810.013207
3-0.03074-0.33530.368984
4-0.100832-1.09990.136788
5-0.003301-0.0360.485666
6-0.233306-2.54510.006102
7-0.184346-2.0110.023294
8-0.206716-2.2550.012981
9-0.077684-0.84740.199228
10-0.24386-2.66020.004443
11-0.589307-6.42860
120.5694886.21240
130.1627811.77570.039167
140.0388510.42380.336234
15-0.028177-0.30740.379549
16-0.031007-0.33820.367888
17-0.031747-0.34630.364858
18-0.05627-0.61380.270247
190.0294450.32120.37431
20-0.016666-0.18180.428023
21-0.158258-1.72640.043436
22-0.112501-1.22720.111077
230.0588970.64250.260894
240.1093111.19240.117731
250.073030.79670.213615
260.0805490.87870.190671
27-0.101972-1.11240.134108
280.0018630.02030.491909
290.0247720.27020.393725
30-0.00722-0.07880.468676
310.099721.08780.139437
32-0.055553-0.6060.272829
330.0285960.3120.377812
340.1510051.64730.051071
350.0041430.04520.482015
36-0.044221-0.48240.315207
37-0.075666-0.82540.205392
38-0.094216-1.02780.153071
390.0227530.24820.402202
400.0684180.74630.228464
41-0.072426-0.79010.215529
42-0.004886-0.05330.47879
43-0.032712-0.35680.360919
440.0115190.12570.450106
450.0130940.14280.443331
46-0.023444-0.25570.399295
47-0.105569-1.15160.125892
480.036130.39410.347094

\begin{tabular}{lllllllll}
\hline
Partial Autocorrelation Function \tabularnewline
Time lag k & PACF(k) & T-STAT & P-value \tabularnewline
1 & -0.315496 & -3.4417 & 0.000399 \tabularnewline
2 & -0.20608 & -2.2481 & 0.013207 \tabularnewline
3 & -0.03074 & -0.3353 & 0.368984 \tabularnewline
4 & -0.100832 & -1.0999 & 0.136788 \tabularnewline
5 & -0.003301 & -0.036 & 0.485666 \tabularnewline
6 & -0.233306 & -2.5451 & 0.006102 \tabularnewline
7 & -0.184346 & -2.011 & 0.023294 \tabularnewline
8 & -0.206716 & -2.255 & 0.012981 \tabularnewline
9 & -0.077684 & -0.8474 & 0.199228 \tabularnewline
10 & -0.24386 & -2.6602 & 0.004443 \tabularnewline
11 & -0.589307 & -6.4286 & 0 \tabularnewline
12 & 0.569488 & 6.2124 & 0 \tabularnewline
13 & 0.162781 & 1.7757 & 0.039167 \tabularnewline
14 & 0.038851 & 0.4238 & 0.336234 \tabularnewline
15 & -0.028177 & -0.3074 & 0.379549 \tabularnewline
16 & -0.031007 & -0.3382 & 0.367888 \tabularnewline
17 & -0.031747 & -0.3463 & 0.364858 \tabularnewline
18 & -0.05627 & -0.6138 & 0.270247 \tabularnewline
19 & 0.029445 & 0.3212 & 0.37431 \tabularnewline
20 & -0.016666 & -0.1818 & 0.428023 \tabularnewline
21 & -0.158258 & -1.7264 & 0.043436 \tabularnewline
22 & -0.112501 & -1.2272 & 0.111077 \tabularnewline
23 & 0.058897 & 0.6425 & 0.260894 \tabularnewline
24 & 0.109311 & 1.1924 & 0.117731 \tabularnewline
25 & 0.07303 & 0.7967 & 0.213615 \tabularnewline
26 & 0.080549 & 0.8787 & 0.190671 \tabularnewline
27 & -0.101972 & -1.1124 & 0.134108 \tabularnewline
28 & 0.001863 & 0.0203 & 0.491909 \tabularnewline
29 & 0.024772 & 0.2702 & 0.393725 \tabularnewline
30 & -0.00722 & -0.0788 & 0.468676 \tabularnewline
31 & 0.09972 & 1.0878 & 0.139437 \tabularnewline
32 & -0.055553 & -0.606 & 0.272829 \tabularnewline
33 & 0.028596 & 0.312 & 0.377812 \tabularnewline
34 & 0.151005 & 1.6473 & 0.051071 \tabularnewline
35 & 0.004143 & 0.0452 & 0.482015 \tabularnewline
36 & -0.044221 & -0.4824 & 0.315207 \tabularnewline
37 & -0.075666 & -0.8254 & 0.205392 \tabularnewline
38 & -0.094216 & -1.0278 & 0.153071 \tabularnewline
39 & 0.022753 & 0.2482 & 0.402202 \tabularnewline
40 & 0.068418 & 0.7463 & 0.228464 \tabularnewline
41 & -0.072426 & -0.7901 & 0.215529 \tabularnewline
42 & -0.004886 & -0.0533 & 0.47879 \tabularnewline
43 & -0.032712 & -0.3568 & 0.360919 \tabularnewline
44 & 0.011519 & 0.1257 & 0.450106 \tabularnewline
45 & 0.013094 & 0.1428 & 0.443331 \tabularnewline
46 & -0.023444 & -0.2557 & 0.399295 \tabularnewline
47 & -0.105569 & -1.1516 & 0.125892 \tabularnewline
48 & 0.03613 & 0.3941 & 0.347094 \tabularnewline
\hline
\end{tabular}
%Source: https://freestatistics.org/blog/index.php?pk=75284&T=2

[TABLE]
[ROW][C]Partial Autocorrelation Function[/C][/ROW]
[ROW][C]Time lag k[/C][C]PACF(k)[/C][C]T-STAT[/C][C]P-value[/C][/ROW]
[ROW][C]1[/C][C]-0.315496[/C][C]-3.4417[/C][C]0.000399[/C][/ROW]
[ROW][C]2[/C][C]-0.20608[/C][C]-2.2481[/C][C]0.013207[/C][/ROW]
[ROW][C]3[/C][C]-0.03074[/C][C]-0.3353[/C][C]0.368984[/C][/ROW]
[ROW][C]4[/C][C]-0.100832[/C][C]-1.0999[/C][C]0.136788[/C][/ROW]
[ROW][C]5[/C][C]-0.003301[/C][C]-0.036[/C][C]0.485666[/C][/ROW]
[ROW][C]6[/C][C]-0.233306[/C][C]-2.5451[/C][C]0.006102[/C][/ROW]
[ROW][C]7[/C][C]-0.184346[/C][C]-2.011[/C][C]0.023294[/C][/ROW]
[ROW][C]8[/C][C]-0.206716[/C][C]-2.255[/C][C]0.012981[/C][/ROW]
[ROW][C]9[/C][C]-0.077684[/C][C]-0.8474[/C][C]0.199228[/C][/ROW]
[ROW][C]10[/C][C]-0.24386[/C][C]-2.6602[/C][C]0.004443[/C][/ROW]
[ROW][C]11[/C][C]-0.589307[/C][C]-6.4286[/C][C]0[/C][/ROW]
[ROW][C]12[/C][C]0.569488[/C][C]6.2124[/C][C]0[/C][/ROW]
[ROW][C]13[/C][C]0.162781[/C][C]1.7757[/C][C]0.039167[/C][/ROW]
[ROW][C]14[/C][C]0.038851[/C][C]0.4238[/C][C]0.336234[/C][/ROW]
[ROW][C]15[/C][C]-0.028177[/C][C]-0.3074[/C][C]0.379549[/C][/ROW]
[ROW][C]16[/C][C]-0.031007[/C][C]-0.3382[/C][C]0.367888[/C][/ROW]
[ROW][C]17[/C][C]-0.031747[/C][C]-0.3463[/C][C]0.364858[/C][/ROW]
[ROW][C]18[/C][C]-0.05627[/C][C]-0.6138[/C][C]0.270247[/C][/ROW]
[ROW][C]19[/C][C]0.029445[/C][C]0.3212[/C][C]0.37431[/C][/ROW]
[ROW][C]20[/C][C]-0.016666[/C][C]-0.1818[/C][C]0.428023[/C][/ROW]
[ROW][C]21[/C][C]-0.158258[/C][C]-1.7264[/C][C]0.043436[/C][/ROW]
[ROW][C]22[/C][C]-0.112501[/C][C]-1.2272[/C][C]0.111077[/C][/ROW]
[ROW][C]23[/C][C]0.058897[/C][C]0.6425[/C][C]0.260894[/C][/ROW]
[ROW][C]24[/C][C]0.109311[/C][C]1.1924[/C][C]0.117731[/C][/ROW]
[ROW][C]25[/C][C]0.07303[/C][C]0.7967[/C][C]0.213615[/C][/ROW]
[ROW][C]26[/C][C]0.080549[/C][C]0.8787[/C][C]0.190671[/C][/ROW]
[ROW][C]27[/C][C]-0.101972[/C][C]-1.1124[/C][C]0.134108[/C][/ROW]
[ROW][C]28[/C][C]0.001863[/C][C]0.0203[/C][C]0.491909[/C][/ROW]
[ROW][C]29[/C][C]0.024772[/C][C]0.2702[/C][C]0.393725[/C][/ROW]
[ROW][C]30[/C][C]-0.00722[/C][C]-0.0788[/C][C]0.468676[/C][/ROW]
[ROW][C]31[/C][C]0.09972[/C][C]1.0878[/C][C]0.139437[/C][/ROW]
[ROW][C]32[/C][C]-0.055553[/C][C]-0.606[/C][C]0.272829[/C][/ROW]
[ROW][C]33[/C][C]0.028596[/C][C]0.312[/C][C]0.377812[/C][/ROW]
[ROW][C]34[/C][C]0.151005[/C][C]1.6473[/C][C]0.051071[/C][/ROW]
[ROW][C]35[/C][C]0.004143[/C][C]0.0452[/C][C]0.482015[/C][/ROW]
[ROW][C]36[/C][C]-0.044221[/C][C]-0.4824[/C][C]0.315207[/C][/ROW]
[ROW][C]37[/C][C]-0.075666[/C][C]-0.8254[/C][C]0.205392[/C][/ROW]
[ROW][C]38[/C][C]-0.094216[/C][C]-1.0278[/C][C]0.153071[/C][/ROW]
[ROW][C]39[/C][C]0.022753[/C][C]0.2482[/C][C]0.402202[/C][/ROW]
[ROW][C]40[/C][C]0.068418[/C][C]0.7463[/C][C]0.228464[/C][/ROW]
[ROW][C]41[/C][C]-0.072426[/C][C]-0.7901[/C][C]0.215529[/C][/ROW]
[ROW][C]42[/C][C]-0.004886[/C][C]-0.0533[/C][C]0.47879[/C][/ROW]
[ROW][C]43[/C][C]-0.032712[/C][C]-0.3568[/C][C]0.360919[/C][/ROW]
[ROW][C]44[/C][C]0.011519[/C][C]0.1257[/C][C]0.450106[/C][/ROW]
[ROW][C]45[/C][C]0.013094[/C][C]0.1428[/C][C]0.443331[/C][/ROW]
[ROW][C]46[/C][C]-0.023444[/C][C]-0.2557[/C][C]0.399295[/C][/ROW]
[ROW][C]47[/C][C]-0.105569[/C][C]-1.1516[/C][C]0.125892[/C][/ROW]
[ROW][C]48[/C][C]0.03613[/C][C]0.3941[/C][C]0.347094[/C][/ROW]
[/TABLE]
Source: https://freestatistics.org/blog/index.php?pk=75284&T=2

Globally Unique Identifier (entire table): ba.freestatistics.org/blog/index.php?pk=75284&T=2

As an alternative you can also use a QR Code:  

The GUIDs for individual cells are displayed in the table below:

Partial Autocorrelation Function
Time lag kPACF(k)T-STATP-value
1-0.315496-3.44170.000399
2-0.20608-2.24810.013207
3-0.03074-0.33530.368984
4-0.100832-1.09990.136788
5-0.003301-0.0360.485666
6-0.233306-2.54510.006102
7-0.184346-2.0110.023294
8-0.206716-2.2550.012981
9-0.077684-0.84740.199228
10-0.24386-2.66020.004443
11-0.589307-6.42860
120.5694886.21240
130.1627811.77570.039167
140.0388510.42380.336234
15-0.028177-0.30740.379549
16-0.031007-0.33820.367888
17-0.031747-0.34630.364858
18-0.05627-0.61380.270247
190.0294450.32120.37431
20-0.016666-0.18180.428023
21-0.158258-1.72640.043436
22-0.112501-1.22720.111077
230.0588970.64250.260894
240.1093111.19240.117731
250.073030.79670.213615
260.0805490.87870.190671
27-0.101972-1.11240.134108
280.0018630.02030.491909
290.0247720.27020.393725
30-0.00722-0.07880.468676
310.099721.08780.139437
32-0.055553-0.6060.272829
330.0285960.3120.377812
340.1510051.64730.051071
350.0041430.04520.482015
36-0.044221-0.48240.315207
37-0.075666-0.82540.205392
38-0.094216-1.02780.153071
390.0227530.24820.402202
400.0684180.74630.228464
41-0.072426-0.79010.215529
42-0.004886-0.05330.47879
43-0.032712-0.35680.360919
440.0115190.12570.450106
450.0130940.14280.443331
46-0.023444-0.25570.399295
47-0.105569-1.15160.125892
480.036130.39410.347094


Parameters (Session):
par1 = 48 ; par2 = 1 ; par3 = 1 ; par4 = 0 ; par5 = 12 ; par6 = White Noise ; par7 = 0.95 ;
Parameters (R input):
par1 = 48 ; par2 = 1 ; par3 = 1 ; par4 = 0 ; par5 = 12 ; par6 = White Noise ; par7 = 0.95 ;
R code (references can be found in the software module):
if (par1 == 'Default') {
par1 = 10*log10(length(x))
} else {
par1 <- as.numeric(par1)
}
par2 <- as.numeric(par2)
par3 <- as.numeric(par3)
par4 <- as.numeric(par4)
par5 <- as.numeric(par5)
if (par6 == 'White Noise') par6 <- 'white' else par6 <- 'ma'
par7 <- as.numeric(par7)
if (par2 == 0) {
x <- log(x)
} else {
x <- (x ^ par2 - 1) / par2
}
if (par3 > 0) x <- diff(x,lag=1,difference=par3)
if (par4 > 0) x <- diff(x,lag=par5,difference=par4)
bitmap(file='pic1.png')
racf <- acf(x, par1, main='Autocorrelation', xlab='time lag', ylab='ACF', ci.type=par6, ci=par7, sub=paste('(lambda=',par2,', d=',par3,', D=',par4,', CI=', par7, ', CI type=',par6,')',sep=''))
dev.off()
bitmap(file='pic2.png')
rpacf <- pacf(x,par1,main='Partial Autocorrelation',xlab='lags',ylab='PACF')
dev.off()
(myacf <- c(racf$acf))
(mypacf <- c(rpacf$acf))
lengthx <- length(x)
sqrtn <- sqrt(lengthx)
load(file='createtable')
a<-table.start()
a<-table.row.start(a)
a<-table.element(a,'Autocorrelation Function',4,TRUE)
a<-table.row.end(a)
a<-table.row.start(a)
a<-table.element(a,'Time lag k',header=TRUE)
a<-table.element(a,hyperlink('basics.htm','ACF(k)','click here for more information about the Autocorrelation Function'),header=TRUE)
a<-table.element(a,'T-STAT',header=TRUE)
a<-table.element(a,'P-value',header=TRUE)
a<-table.row.end(a)
for (i in 2:(par1+1)) {
a<-table.row.start(a)
a<-table.element(a,i-1,header=TRUE)
a<-table.element(a,round(myacf[i],6))
mytstat <- myacf[i]*sqrtn
a<-table.element(a,round(mytstat,4))
a<-table.element(a,round(1-pt(abs(mytstat),lengthx),6))
a<-table.row.end(a)
}
a<-table.end(a)
table.save(a,file='mytable.tab')
a<-table.start()
a<-table.row.start(a)
a<-table.element(a,'Partial Autocorrelation Function',4,TRUE)
a<-table.row.end(a)
a<-table.row.start(a)
a<-table.element(a,'Time lag k',header=TRUE)
a<-table.element(a,hyperlink('basics.htm','PACF(k)','click here for more information about the Partial Autocorrelation Function'),header=TRUE)
a<-table.element(a,'T-STAT',header=TRUE)
a<-table.element(a,'P-value',header=TRUE)
a<-table.row.end(a)
for (i in 1:par1) {
a<-table.row.start(a)
a<-table.element(a,i,header=TRUE)
a<-table.element(a,round(mypacf[i],6))
mytstat <- mypacf[i]*sqrtn
a<-table.element(a,round(mytstat,4))
a<-table.element(a,round(1-pt(abs(mytstat),lengthx),6))
a<-table.row.end(a)
}
a<-table.end(a)
table.save(a,file='mytable1.tab')