| Multiple Linear Regression - Estimated Regression Equation |
| HIV_Risk[t] = + 19.428 -0.00285669Per_Capita_Income[t] + 21.1227Prop_Population_on_Farms[t] + e[t] |
| Warning: you did not specify the column number of the endogenous series! The first column was selected by default. |
| Multiple Linear Regression - Ordinary Least Squares | |||||
| Variable | Parameter | S.D. | T-STAT H0: parameter = 0 | 2-tail p-value | 1-tail p-value |
| (Intercept) | +19.43 | 7.867 | +2.4700e+00 | 0.02014 | 0.01007 |
| Per_Capita_Income | -0.002857 | 0.006518 | -4.3830e-01 | 0.6647 | 0.3323 |
| Prop_Population_on_Farms | +21.12 | 14.43 | +1.4640e+00 | 0.1548 | 0.07742 |
| Multiple Linear Regression - Regression Statistics | |
| Multiple R | 0.486 |
| R-squared | 0.2362 |
| Adjusted R-squared | 0.1797 |
| F-TEST (value) | 4.176 |
| F-TEST (DF numerator) | 2 |
| F-TEST (DF denominator) | 27 |
| p-value | 0.0263 |
| Multiple Linear Regression - Residual Statistics | |
| Residual Standard Deviation | 8.675 |
| Sum Squared Residuals | 2032 |
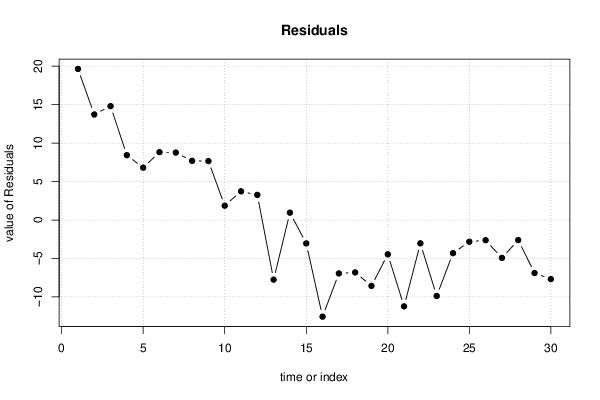
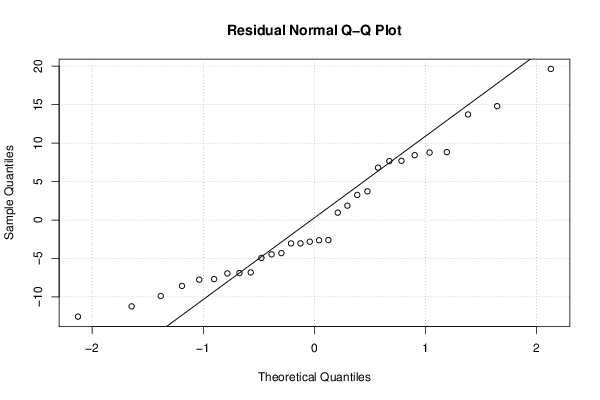
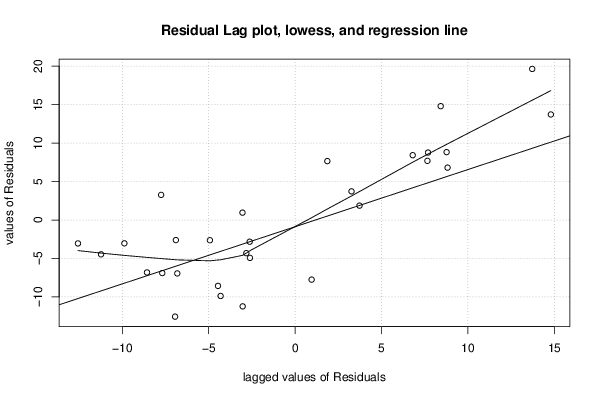
| Multiple Linear Regression - Actuals, Interpolation, and Residuals | |||
| Time or Index | Actuals | Interpolation Forecast | Residuals Prediction Error |
| 1 | 46.4 | 26.76 | 19.64 |
| 2 | 45.7 | 31.98 | 13.72 |
| 3 | 45.3 | 30.5 | 14.8 |
| 4 | 38.6 | 30.17 | 8.428 |
| 5 | 37.2 | 30.39 | 6.808 |
| 6 | 35 | 26.18 | 8.825 |
| 7 | 34 | 25.23 | 8.769 |
| 8 | 28.3 | 20.6 | 7.695 |
| 9 | 24.7 | 17.04 | 7.659 |
| 10 | 24.7 | 22.83 | 1.867 |
| 11 | 24.4 | 20.67 | 3.73 |
| 12 | 22.7 | 19.43 | 3.265 |
| 13 | 22.3 | 30.05 | -7.752 |
| 14 | 21.7 | 20.74 | 0.9574 |
| 15 | 21.6 | 24.64 | -3.044 |
| 16 | 21.3 | 33.87 | -12.57 |
| 17 | 21.2 | 28.14 | -6.944 |
| 18 | 20.8 | 27.62 | -6.817 |
| 19 | 20.3 | 28.87 | -8.57 |
| 20 | 18.9 | 23.36 | -4.46 |
| 21 | 18.8 | 30.03 | -11.23 |
| 22 | 18.6 | 21.63 | -3.033 |
| 23 | 18 | 27.88 | -9.879 |
| 24 | 17.6 | 21.91 | -4.309 |
| 25 | 17 | 19.82 | -2.822 |
| 26 | 16.7 | 19.33 | -2.626 |
| 27 | 15.9 | 20.83 | -4.928 |
| 28 | 15.3 | 17.91 | -2.61 |
| 29 | 15 | 21.9 | -6.898 |
| 30 | 14.8 | 22.49 | -7.687 |
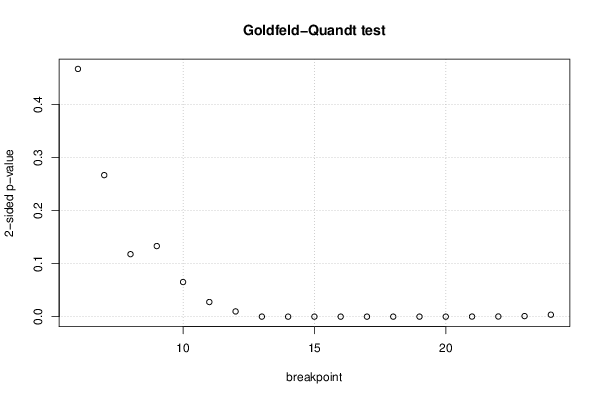
| Goldfeld-Quandt test for Heteroskedasticity | |||
| p-values | Alternative Hypothesis | ||
| breakpoint index | greater | 2-sided | less |
| 6 | 0.7667 | 0.4667 | 0.2333 |
| 7 | 0.8667 | 0.2666 | 0.1333 |
| 8 | 0.9412 | 0.1177 | 0.05885 |
| 9 | 0.9335 | 0.133 | 0.0665 |
| 10 | 0.9674 | 0.06522 | 0.03261 |
| 11 | 0.9862 | 0.02757 | 0.01378 |
| 12 | 0.9951 | 0.009866 | 0.004933 |
| 13 | 1 | 5.651e-05 | 2.825e-05 |
| 14 | 1 | 1.131e-05 | 5.657e-06 |
| 15 | 1 | 3.143e-06 | 1.571e-06 |
| 16 | 1 | 1.357e-06 | 6.783e-07 |
| 17 | 1 | 2.577e-06 | 1.289e-06 |
| 18 | 1 | 4.68e-06 | 2.34e-06 |
| 19 | 1 | 1.242e-05 | 6.212e-06 |
| 20 | 1 | 3.293e-05 | 1.646e-05 |
| 21 | 0.9999 | 0.000163 | 8.151e-05 |
| 22 | 0.9999 | 0.0002887 | 0.0001444 |
| 23 | 0.9995 | 0.001037 | 0.0005185 |
| 24 | 0.9982 | 0.0036 | 0.0018 |
| Meta Analysis of Goldfeld-Quandt test for Heteroskedasticity | |||
| Description | # significant tests | % significant tests | OK/NOK |
| 1% type I error level | 13 | 0.6842 | NOK |
| 5% type I error level | 14 | 0.736842 | NOK |
| 10% type I error level | 15 | 0.789474 | NOK |