| Multiple Linear Regression - Estimated Regression Equation |
| Y(t)[t] = + 498.427859024053 + 0.130784812235800`Y(t-1)`[t] + 0.0162915608389134`Y(t-2)`[t] + 0.263994243417347`Y(t-3)`[t] -0.219932791022093`Y(t-4)`[t] + 59.7224027781905X[t] + 47.4989221017373M1[t] + 150.105502994404M2[t] -201.549014116771M3[t] -255.564897907489M4[t] + 196.293610116600M5[t] + 211.074911954083M6[t] + 48.6418087775556M7[t] -47.9260020233859M8[t] + 65.6461246792301M9[t] + 32.5833805008135M10[t] + 89.4593062550886M11[t] -0.262984632943971t + e[t] |
| Multiple Linear Regression - Ordinary Least Squares | |||||
| Variable | Parameter | S.D. | T-STAT H0: parameter = 0 | 2-tail p-value | 1-tail p-value |
| (Intercept) | 498.427859024053 | 216.524119 | 2.302 | 0.026911 | 0.013456 |
| `Y(t-1)` | 0.130784812235800 | 0.166603 | 0.785 | 0.437315 | 0.218657 |
| `Y(t-2)` | 0.0162915608389134 | 0.159149 | 0.1024 | 0.919004 | 0.459502 |
| `Y(t-3)` | 0.263994243417347 | 0.167897 | 1.5724 | 0.124158 | 0.062079 |
| `Y(t-4)` | -0.219932791022093 | 0.171296 | -1.2839 | 0.206939 | 0.103469 |
| X | 59.7224027781905 | 31.475611 | 1.8974 | 0.065391 | 0.032695 |
| M1 | 47.4989221017373 | 41.654504 | 1.1403 | 0.261295 | 0.130647 |
| M2 | 150.105502994404 | 37.212849 | 4.0337 | 0.000255 | 0.000128 |
| M3 | -201.549014116771 | 40.935964 | -4.9235 | 1.7e-05 | 8e-06 |
| M4 | -255.564897907489 | 67.716821 | -3.774 | 0.000549 | 0.000274 |
| M5 | 196.293610116600 | 78.488621 | 2.5009 | 0.016816 | 0.008408 |
| M6 | 211.074911954083 | 75.453002 | 2.7974 | 0.008041 | 0.004021 |
| M7 | 48.6418087775556 | 82.446848 | 0.59 | 0.558698 | 0.279349 |
| M8 | -47.9260020233859 | 65.654753 | -0.73 | 0.469885 | 0.234942 |
| M9 | 65.6461246792301 | 47.533881 | 1.381 | 0.175335 | 0.087668 |
| M10 | 32.5833805008135 | 41.874409 | 0.7781 | 0.441316 | 0.220658 |
| M11 | 89.4593062550886 | 40.880254 | 2.1883 | 0.034864 | 0.017432 |
| t | -0.262984632943971 | 0.709166 | -0.3708 | 0.712819 | 0.356409 |
| Multiple Linear Regression - Regression Statistics | |
| Multiple R | 0.955072487884467 |
| R-squared | 0.912163457113825 |
| Adjusted R-squared | 0.872868161612115 |
| F-TEST (value) | 23.2130448560728 |
| F-TEST (DF numerator) | 17 |
| F-TEST (DF denominator) | 38 |
| p-value | 5.32907051820075e-15 |
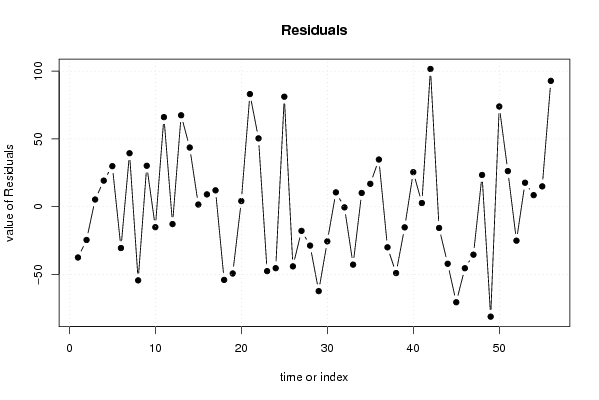
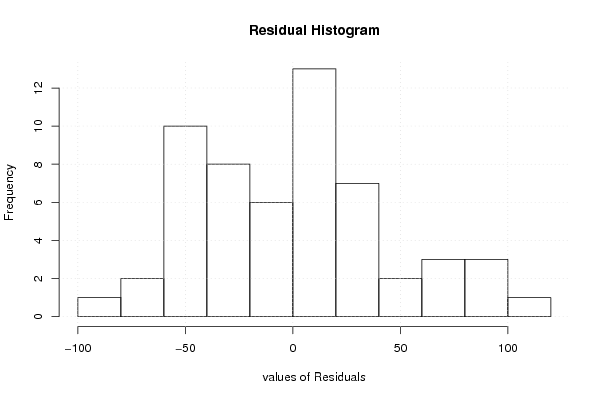
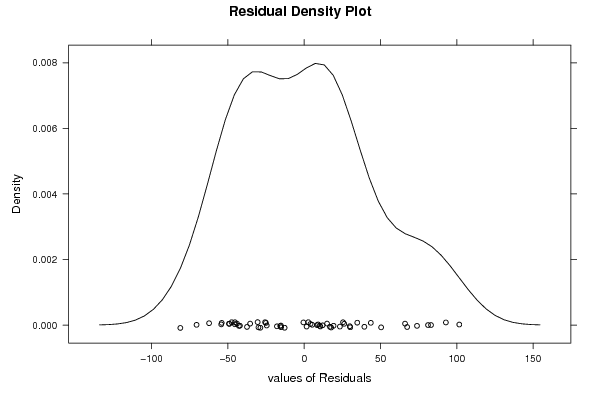
| Multiple Linear Regression - Residual Statistics | |
| Residual Standard Deviation | 52.8072951092583 |
| Sum Squared Residuals | 105967.195836739 |
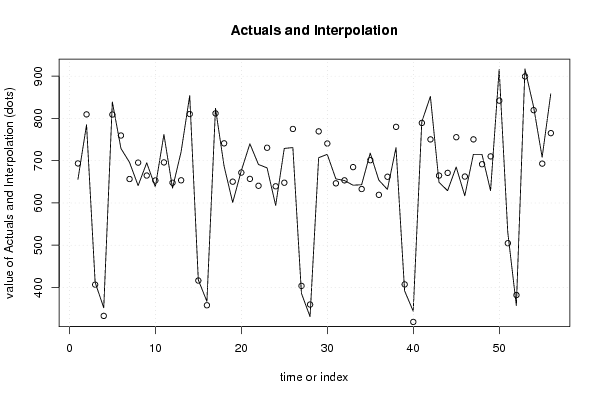
| Multiple Linear Regression - Actuals, Interpolation, and Residuals | |||
| Time or Index | Actuals | Interpolation Forecast | Residuals Prediction Error |
| 1 | 656 | 693.487785516207 | -37.4877855162073 |
| 2 | 785 | 809.553644535133 | -24.5536445351328 |
| 3 | 412 | 406.722782724199 | 5.27721727580146 |
| 4 | 352 | 332.768964644308 | 19.2310353556923 |
| 5 | 839 | 809.114493120692 | 29.885506879308 |
| 6 | 729 | 759.50633739721 | -30.5063373972103 |
| 7 | 696 | 656.553186816552 | 39.4468131834482 |
| 8 | 641 | 695.375584892178 | -54.3755848921782 |
| 9 | 695 | 664.80730477753 | 30.1926952224705 |
| 10 | 638 | 653.12871696042 | -15.1287169604194 |
| 11 | 762 | 695.904766785386 | 66.0952332146137 |
| 12 | 635 | 647.823166297527 | -12.8231662975268 |
| 13 | 721 | 653.545543566417 | 67.454456433583 |
| 14 | 854 | 810.339060723886 | 43.6609392761136 |
| 15 | 418 | 416.418078238534 | 1.58192176146643 |
| 16 | 367 | 357.918778665335 | 9.08122133466464 |
| 17 | 824 | 811.938170453296 | 12.0618295467042 |
| 18 | 687 | 741.041725910909 | -54.0417259109090 |
| 19 | 601 | 650.300352599864 | -49.3003525998645 |
| 20 | 676 | 671.852061062623 | 4.14793893737662 |
| 21 | 740 | 656.892492972561 | 83.1075070274392 |
| 22 | 691 | 640.586146643345 | 50.4138533566552 |
| 23 | 683 | 730.547080143013 | -47.5470801430132 |
| 24 | 594 | 639.380896528041 | -45.3808965280408 |
| 25 | 729 | 647.835236668273 | 81.1647633317275 |
| 26 | 731 | 775.049586477908 | -44.0495864779083 |
| 27 | 386 | 403.856989735548 | -17.8569897355479 |
| 28 | 331 | 359.70318547452 | -28.7031854745202 |
| 29 | 707 | 769.322017402124 | -62.3220174021237 |
| 30 | 715 | 740.601508600154 | -25.6015086001542 |
| 31 | 657 | 646.434455678669 | 10.5655443213312 |
| 32 | 653 | 653.506612652956 | -0.506612652955813 |
| 33 | 642 | 684.76492946806 | -42.7649294680594 |
| 34 | 643 | 632.864273032367 | 10.1357269676335 |
| 35 | 718 | 701.128916702317 | 16.8710832976826 |
| 36 | 654 | 619.207572779306 | 34.7924272206937 |
| 37 | 632 | 661.978404272587 | -29.9784042725873 |
| 38 | 731 | 779.98171023471 | -48.9817102347105 |
| 39 | 392 | 407.262899658113 | -15.2628996581132 |
| 40 | 344 | 318.528669679799 | 25.4713303202008 |
| 41 | 792 | 789.297634460038 | 2.70236553996208 |
| 42 | 852 | 750.35815779628 | 101.641842203721 |
| 43 | 649 | 664.693270449246 | -15.6932704492463 |
| 44 | 629 | 671.11684680186 | -42.1168468018602 |
| 45 | 685 | 755.53527278185 | -70.5352727818503 |
| 46 | 617 | 662.42086336387 | -45.4208633638693 |
| 47 | 715 | 750.419236369283 | -35.4192363692831 |
| 48 | 715 | 691.588364395126 | 23.4116356048739 |
| 49 | 629 | 710.153029976516 | -81.1530299765161 |
| 50 | 916 | 842.075998028362 | 73.924001971638 |
| 51 | 531 | 504.739249643607 | 26.2607503563933 |
| 52 | 357 | 382.080401536038 | -25.0804015360375 |
| 53 | 917 | 899.32768456385 | 17.6723154361493 |
| 54 | 828 | 819.492270295447 | 8.50772970455288 |
| 55 | 708 | 693.018734455669 | 14.9812655443313 |
| 56 | 858 | 765.148894590382 | 92.8511054096175 |
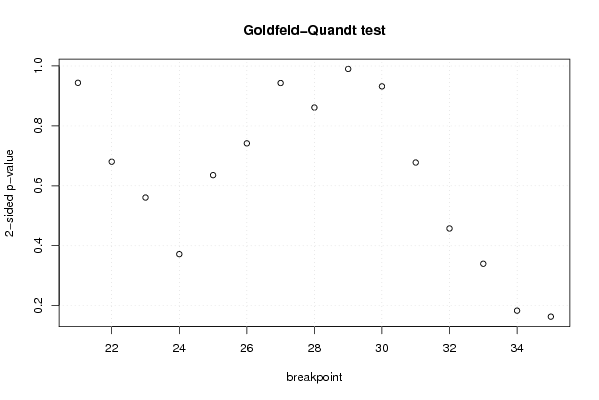
| Goldfeld-Quandt test for Heteroskedasticity | |||
| p-values | Alternative Hypothesis | ||
| breakpoint index | greater | 2-sided | less |
| 21 | 0.471905859998609 | 0.943811719997218 | 0.528094140001391 |
| 22 | 0.340217032930881 | 0.680434065861762 | 0.659782967069119 |
| 23 | 0.280392888246322 | 0.560785776492643 | 0.719607111753678 |
| 24 | 0.185921447974251 | 0.371842895948501 | 0.81407855202575 |
| 25 | 0.317779027795748 | 0.635558055591497 | 0.682220972204252 |
| 26 | 0.629153389950879 | 0.741693220098243 | 0.370846610049121 |
| 27 | 0.528467146690236 | 0.943065706619529 | 0.471532853309764 |
| 28 | 0.430621900210985 | 0.86124380042197 | 0.569378099789015 |
| 29 | 0.495048703451873 | 0.990097406903746 | 0.504951296548127 |
| 30 | 0.465944415781926 | 0.931888831563851 | 0.534055584218074 |
| 31 | 0.338859073490985 | 0.677718146981971 | 0.661140926509015 |
| 32 | 0.228766218526325 | 0.45753243705265 | 0.771233781473675 |
| 33 | 0.169889857489507 | 0.339779714979013 | 0.830110142510493 |
| 34 | 0.0916101058331298 | 0.183220211666260 | 0.90838989416687 |
| 35 | 0.0815887870019564 | 0.163177574003913 | 0.918411212998044 |
| Meta Analysis of Goldfeld-Quandt test for Heteroskedasticity | |||
| Description | # significant tests | % significant tests | OK/NOK |
| 1% type I error level | 0 | 0 | OK |
| 5% type I error level | 0 | 0 | OK |
| 10% type I error level | 0 | 0 | OK |