| Multiple Linear Regression - Estimated Regression Equation |
| Y(t)[t] = + 545.186455397854 + 0.141348092963167`Y(t-1)`[t] + 0.00880922248867556`Y(t-2)`[t] + 71.4208577566432X[t] + 98.2230519212738M1[t] + 1.62679385532139M2[t] + 32.0269502909186M3[t] + 160.81742550343M4[t] -232.68270559757M5[t] -257.700350126129M6[t] + 222.814216532563M7[t] + 104.723350792037M8[t] + 8.83524526213836M9[t] + 53.2794395618514M10[t] + 48.363914887757M11[t] -0.637210678003292t + e[t] |
| Multiple Linear Regression - Ordinary Least Squares | |||||
| Variable | Parameter | S.D. | T-STAT H0: parameter = 0 | 2-tail p-value | 1-tail p-value |
| (Intercept) | 545.186455397854 | 149.255417 | 3.6527 | 0.000714 | 0.000357 |
| `Y(t-1)` | 0.141348092963167 | 0.16342 | 0.8649 | 0.391987 | 0.195993 |
| `Y(t-2)` | 0.00880922248867556 | 0.160074 | 0.055 | 0.956374 | 0.478187 |
| X | 71.4208577566432 | 28.221974 | 2.5307 | 0.015219 | 0.007609 |
| M1 | 98.2230519212738 | 37.66051 | 2.6081 | 0.012554 | 0.006277 |
| M2 | 1.62679385532139 | 37.747257 | 0.0431 | 0.965828 | 0.482914 |
| M3 | 32.0269502909186 | 40.301539 | 0.7947 | 0.431266 | 0.215633 |
| M4 | 160.81742550343 | 36.947052 | 4.3526 | 8.4e-05 | 4.2e-05 |
| M5 | -232.68270559757 | 41.349124 | -5.6273 | 1e-06 | 1e-06 |
| M6 | -257.700350126129 | 63.495252 | -4.0586 | 0.00021 | 0.000105 |
| M7 | 222.814216532563 | 71.811288 | 3.1028 | 0.003423 | 0.001711 |
| M8 | 104.723350792037 | 65.462672 | 1.5997 | 0.117152 | 0.058576 |
| M9 | 8.83524526213836 | 46.796198 | 0.1888 | 0.851157 | 0.425578 |
| M10 | 53.2794395618514 | 41.860811 | 1.2728 | 0.210098 | 0.105049 |
| M11 | 48.363914887757 | 39.410049 | 1.2272 | 0.226583 | 0.113291 |
| t | -0.637210678003292 | 0.641103 | -0.9939 | 0.32595 | 0.162975 |
| Multiple Linear Regression - Regression Statistics | |
| Multiple R | 0.947365382278292 |
| R-squared | 0.897501167539294 |
| Adjusted R-squared | 0.860894441660471 |
| F-TEST (value) | 24.5173843328744 |
| F-TEST (DF numerator) | 15 |
| F-TEST (DF denominator) | 42 |
| p-value | 4.44089209850063e-16 |
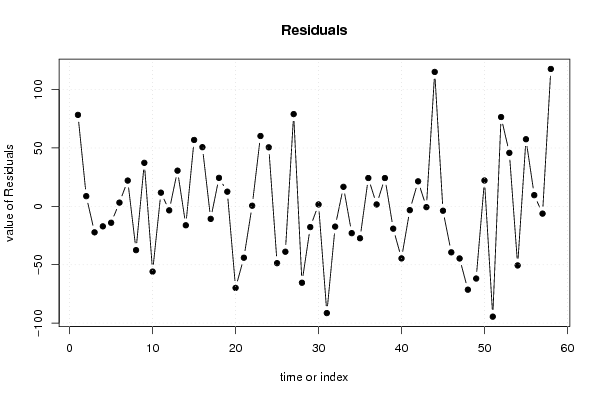
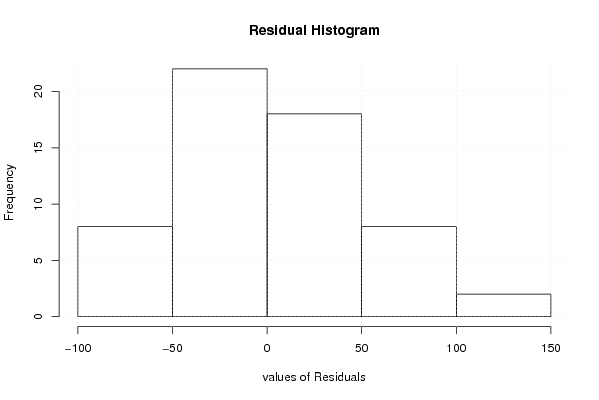
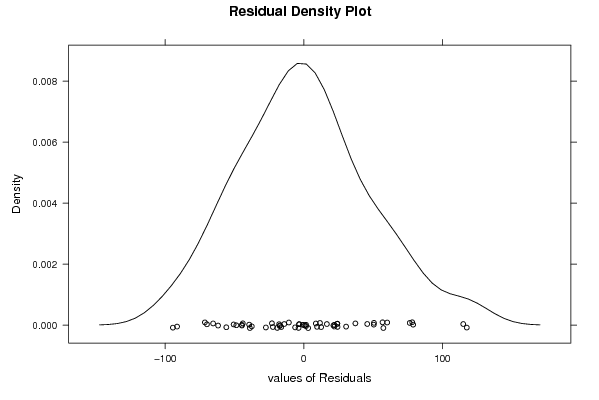
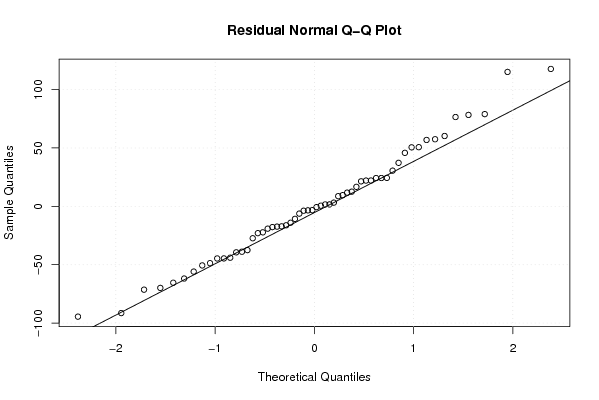
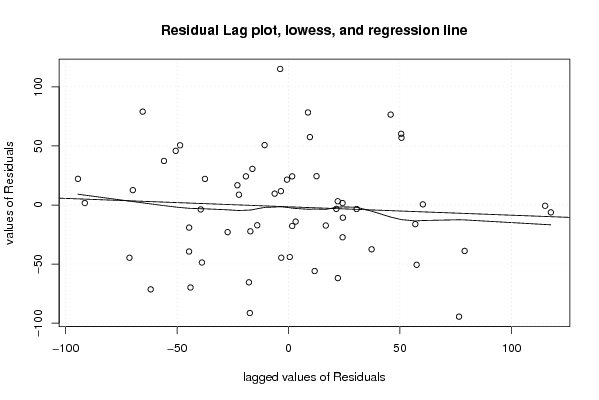
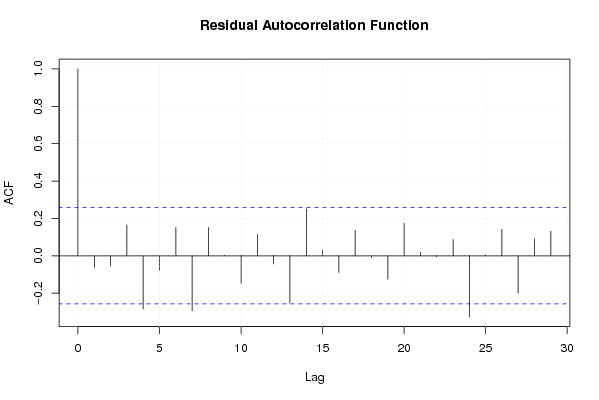
| Multiple Linear Regression - Residual Statistics | |
| Residual Standard Deviation | 54.8915474089605 |
| Sum Squared Residuals | 126549.443031907 |
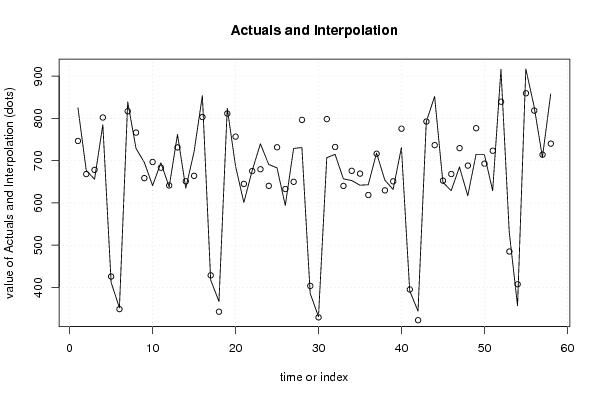
| Multiple Linear Regression - Actuals, Interpolation, and Residuals | |||
| Time or Index | Actuals | Interpolation Forecast | Residuals Prediction Error |
| 1 | 825 | 746.673951843892 | 78.3260481561084 |
| 2 | 677 | 668.2822234439 | 8.71777655609997 |
| 3 | 656 | 678.262041143984 | -22.2620411439842 |
| 4 | 785 | 802.143230797942 | -17.1432307979421 |
| 5 | 412 | 426.054799338925 | -14.0547993389251 |
| 6 | 352 | 348.813495158141 | 3.18650484185928 |
| 7 | 839 | 816.924125572763 | 22.0758744272371 |
| 8 | 729 | 766.504017077975 | -37.5040170779754 |
| 9 | 696 | 658.72050199611 | 37.2794980038895 |
| 10 | 641 | 696.893984076281 | -55.8939840762814 |
| 11 | 695 | 683.276399269083 | 11.7236007309167 |
| 12 | 638 | 641.423563486457 | -3.42356348645686 |
| 13 | 762 | 731.428261445215 | 30.5717385547847 |
| 14 | 635 | 651.219830546838 | -16.2198305468378 |
| 15 | 721 | 664.123912086705 | 56.8760879132948 |
| 16 | 854 | 803.314341359984 | 50.6856586400158 |
| 17 | 418 | 428.733889079108 | -10.7338890791081 |
| 18 | 367 | 342.622891931599 | 24.3771080684011 |
| 19 | 824 | 811.450674166103 | 12.5493258338969 |
| 20 | 687 | 756.869405884819 | -69.8694058848186 |
| 21 | 601 | 645.005215618288 | -44.0052156182879 |
| 22 | 676 | 675.449399764217 | 0.550600235783341 |
| 23 | 740 | 679.74017825033 | 60.2598217496695 |
| 24 | 691 | 640.446022320863 | 50.5539776791365 |
| 25 | 683 | 731.669597248214 | -48.6695972482141 |
| 26 | 594 | 632.873691858608 | -38.8736918586079 |
| 27 | 729 | 649.986183562570 | 79.0138164374295 |
| 28 | 731 | 796.437419845614 | -65.4374198456143 |
| 29 | 386 | 403.772019288508 | -17.7720192885085 |
| 30 | 331 | 329.369690454631 | 1.63030954536914 |
| 31 | 707 | 798.433719563752 | -91.433719563752 |
| 32 | 715 | 732.368018862496 | -17.3680188624962 |
| 33 | 657 | 640.285755054042 | 16.7142449459580 |
| 34 | 653 | 675.965023063797 | -22.9650230637974 |
| 35 | 642 | 669.335960435504 | -27.3359604355040 |
| 36 | 643 | 618.744768957194 | 24.2552310428059 |
| 37 | 718 | 716.375056846052 | 1.62494315394763 |
| 38 | 654 | 629.751504296823 | 24.2484957031771 |
| 39 | 632 | 651.128863791425 | -19.1288637914246 |
| 40 | 731 | 775.608680041468 | -44.6086800414681 |
| 41 | 392 | 395.270996571067 | -3.27099657106742 |
| 42 | 344 | 322.571250876370 | 21.4287491236296 |
| 43 | 792 | 792.677571971166 | -0.677571971165651 |
| 44 | 852 | 736.850598520679 | 115.149401479321 |
| 45 | 649 | 652.752699565494 | -3.75269956549375 |
| 46 | 629 | 668.394573665001 | -39.3945736650011 |
| 47 | 685 | 729.647462045082 | -44.6474620450822 |
| 48 | 617 | 688.385645235486 | -71.3856452354857 |
| 49 | 715 | 776.853132616627 | -61.8531326166267 |
| 50 | 715 | 692.872749853831 | 22.1272501461686 |
| 51 | 629 | 723.498999415316 | -94.4989994153155 |
| 52 | 916 | 839.496327954991 | 76.5036720450085 |
| 53 | 531 | 485.168295722391 | 45.8317042776090 |
| 54 | 357 | 407.622671579259 | -50.6226715792592 |
| 55 | 917 | 859.513908726216 | 57.4860912737836 |
| 56 | 828 | 818.407959654031 | 9.5920403459689 |
| 57 | 708 | 714.235827766066 | -6.2358277660659 |
| 58 | 858 | 740.297019430703 | 117.702980569297 |
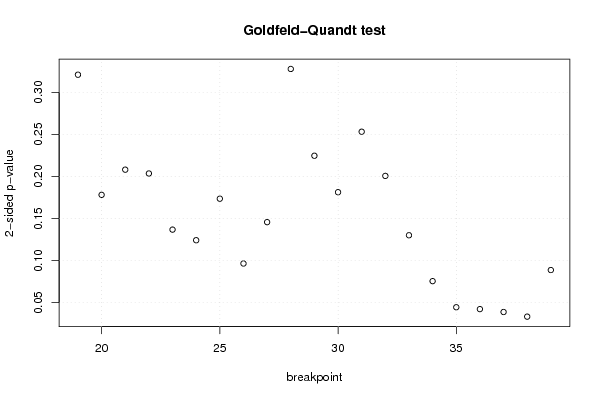
| Goldfeld-Quandt test for Heteroskedasticity | |||
| p-values | Alternative Hypothesis | ||
| breakpoint index | greater | 2-sided | less |
| 19 | 0.160472088312954 | 0.320944176625908 | 0.839527911687046 |
| 20 | 0.0890915812943671 | 0.178183162588734 | 0.910908418705633 |
| 21 | 0.104043000923623 | 0.208086001847245 | 0.895956999076377 |
| 22 | 0.101778455909412 | 0.203556911818825 | 0.898221544090588 |
| 23 | 0.0684107915563523 | 0.136821583112705 | 0.931589208443648 |
| 24 | 0.0621117408361102 | 0.124223481672220 | 0.93788825916389 |
| 25 | 0.086790776011397 | 0.173581552022794 | 0.913209223988603 |
| 26 | 0.0482692594987604 | 0.0965385189975209 | 0.95173074050124 |
| 27 | 0.0728619904109107 | 0.145723980821821 | 0.92713800958909 |
| 28 | 0.163902627187174 | 0.327805254374349 | 0.836097372812826 |
| 29 | 0.112319101252584 | 0.224638202505168 | 0.887680898747416 |
| 30 | 0.0906570419370884 | 0.181314083874177 | 0.909342958062912 |
| 31 | 0.126593682121304 | 0.253187364242607 | 0.873406317878696 |
| 32 | 0.100344935163260 | 0.200689870326521 | 0.89965506483674 |
| 33 | 0.065065180386309 | 0.130130360772618 | 0.934934819613691 |
| 34 | 0.0377912551585088 | 0.0755825103170175 | 0.962208744841491 |
| 35 | 0.022281210201172 | 0.044562420402344 | 0.977718789798828 |
| 36 | 0.0211728285160158 | 0.0423456570320317 | 0.978827171483984 |
| 37 | 0.0194530017455784 | 0.0389060034911567 | 0.980546998254422 |
| 38 | 0.0166909044764902 | 0.0333818089529804 | 0.98330909552351 |
| 39 | 0.0443883366874526 | 0.0887766733749053 | 0.955611663312547 |
| Meta Analysis of Goldfeld-Quandt test for Heteroskedasticity | |||
| Description | # significant tests | % significant tests | OK/NOK |
| 1% type I error level | 0 | 0 | OK |
| 5% type I error level | 4 | 0.190476190476190 | NOK |
| 10% type I error level | 7 | 0.333333333333333 | NOK |