| Multiple Linear Regression - Estimated Regression Equation |
| Y[t] = + 613.891833030853 + 39.7441016333939X[t] -8.82574107682971M1[t] -4.33714458560193M2[t] -6.24854809437387M3[t] -12.7599516031458M4[t] -15.4713551119177M5[t] -24.3827586206896M6[t] -19.8941621294616M7[t] + 25.6456140350877M8[t] + 35.9342105263158M9[t] + 25.8228070175439M10[t] + 9.71140350877195M11[t] -2.28859649122807t + e[t] |
| Multiple Linear Regression - Ordinary Least Squares | |||||
| Variable | Parameter | S.D. | T-STAT H0: parameter = 0 | 2-tail p-value | 1-tail p-value |
| (Intercept) | 613.891833030853 | 14.483353 | 42.386 | 0 | 0 |
| X | 39.7441016333939 | 12.381497 | 3.21 | 0.002422 | 0.001211 |
| M1 | -8.82574107682971 | 16.928193 | -0.5214 | 0.604615 | 0.302307 |
| M2 | -4.33714458560193 | 16.900815 | -0.2566 | 0.798614 | 0.399307 |
| M3 | -6.24854809437387 | 16.879489 | -0.3702 | 0.712943 | 0.356472 |
| M4 | -12.7599516031458 | 16.86424 | -0.7566 | 0.453131 | 0.226565 |
| M5 | -15.4713551119177 | 16.855085 | -0.9179 | 0.363457 | 0.181728 |
| M6 | -24.3827586206896 | 16.852031 | -1.4469 | 0.154713 | 0.077356 |
| M7 | -19.8941621294616 | 16.855085 | -1.1803 | 0.243946 | 0.121973 |
| M8 | 25.6456140350877 | 16.828852 | 1.5239 | 0.134378 | 0.067189 |
| M9 | 35.9342105263158 | 16.807435 | 2.138 | 0.037863 | 0.018931 |
| M10 | 25.8228070175439 | 16.792121 | 1.5378 | 0.13095 | 0.065475 |
| M11 | 9.71140350877195 | 16.782926 | 0.5786 | 0.565649 | 0.282825 |
| t | -2.28859649122807 | 0.320797 | -7.1341 | 0 | 0 |
| Multiple Linear Regression - Regression Statistics | |
| Multiple R | 0.81979497633176 |
| R-squared | 0.67206380321879 |
| Adjusted R-squared | 0.579386182389317 |
| F-TEST (value) | 7.25162986710019 |
| F-TEST (DF numerator) | 13 |
| F-TEST (DF denominator) | 46 |
| p-value | 2.02201098531418e-07 |
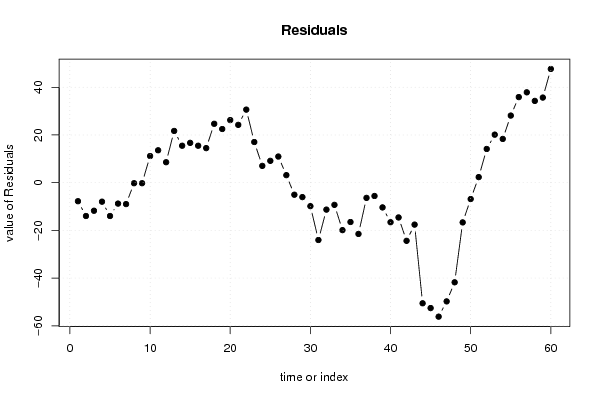
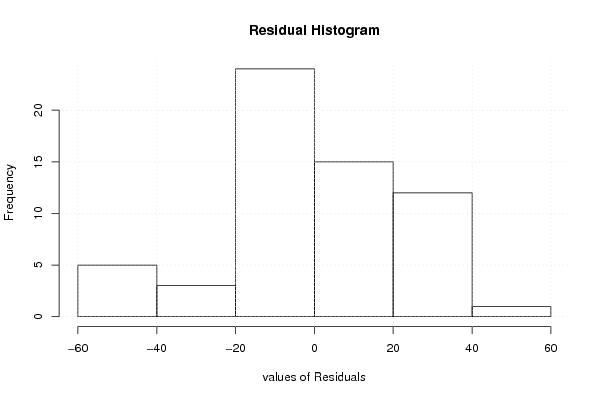
| Multiple Linear Regression - Residual Statistics | |
| Residual Standard Deviation | 26.5312876493999 |
| Sum Squared Residuals | 32379.8243194192 |
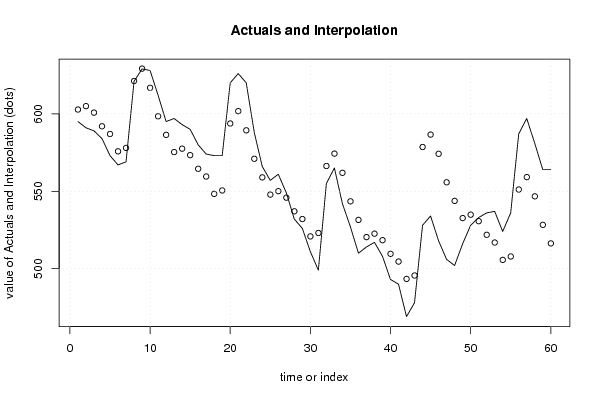
| Multiple Linear Regression - Actuals, Interpolation, and Residuals | |||
| Time or Index | Actuals | Interpolation Forecast | Residuals Prediction Error |
| 1 | 595 | 602.777495462794 | -7.77749546279383 |
| 2 | 591 | 604.977495462795 | -13.9774954627950 |
| 3 | 589 | 600.777495462795 | -11.777495462795 |
| 4 | 584 | 591.977495462795 | -7.97749546279498 |
| 5 | 573 | 586.977495462795 | -13.9774954627950 |
| 6 | 567 | 575.777495462795 | -8.77749546279499 |
| 7 | 569 | 577.977495462795 | -8.97749546279498 |
| 8 | 621 | 621.228675136116 | -0.228675136116206 |
| 9 | 629 | 629.228675136116 | -0.228675136116233 |
| 10 | 628 | 616.828675136116 | 11.1713248638838 |
| 11 | 612 | 598.428675136116 | 13.5713248638838 |
| 12 | 595 | 586.428675136116 | 8.5713248638838 |
| 13 | 597 | 575.314337568058 | 21.6856624319416 |
| 14 | 593 | 577.514337568058 | 15.4856624319419 |
| 15 | 590 | 573.314337568058 | 16.6856624319419 |
| 16 | 580 | 564.514337568058 | 15.4856624319419 |
| 17 | 574 | 559.514337568058 | 14.4856624319419 |
| 18 | 573 | 548.314337568058 | 24.6856624319419 |
| 19 | 573 | 550.514337568058 | 22.4856624319419 |
| 20 | 620 | 593.765517241379 | 26.2344827586207 |
| 21 | 626 | 601.765517241379 | 24.2344827586207 |
| 22 | 620 | 589.365517241379 | 30.6344827586207 |
| 23 | 588 | 570.965517241379 | 17.0344827586207 |
| 24 | 566 | 558.965517241379 | 7.03448275862069 |
| 25 | 557 | 547.851179673322 | 9.1488203266785 |
| 26 | 561 | 550.051179673321 | 10.9488203266788 |
| 27 | 549 | 545.851179673321 | 3.14882032667878 |
| 28 | 532 | 537.051179673321 | -5.05117967332122 |
| 29 | 526 | 532.051179673321 | -6.05117967332122 |
| 30 | 511 | 520.851179673321 | -9.85117967332122 |
| 31 | 499 | 523.051179673321 | -24.0511796733212 |
| 32 | 555 | 566.302359346642 | -11.3023593466424 |
| 33 | 565 | 574.302359346642 | -9.30235934664243 |
| 34 | 542 | 561.902359346642 | -19.9023593466425 |
| 35 | 527 | 543.502359346642 | -16.5023593466424 |
| 36 | 510 | 531.502359346642 | -21.5023593466424 |
| 37 | 514 | 520.388021778585 | -6.38802177858463 |
| 38 | 517 | 522.588021778584 | -5.58802177858433 |
| 39 | 508 | 518.388021778584 | -10.3880217785843 |
| 40 | 493 | 509.588021778584 | -16.5880217785843 |
| 41 | 490 | 504.588021778584 | -14.5880217785843 |
| 42 | 469 | 493.388021778584 | -24.3880217785843 |
| 43 | 478 | 495.588021778584 | -17.5880217785843 |
| 44 | 528 | 578.5833030853 | -50.5833030852995 |
| 45 | 534 | 586.583303085299 | -52.5833030852995 |
| 46 | 518 | 574.1833030853 | -56.1833030852995 |
| 47 | 506 | 555.7833030853 | -49.7833030852995 |
| 48 | 502 | 543.7833030853 | -41.7833030852995 |
| 49 | 516 | 532.668965517242 | -16.6689655172417 |
| 50 | 528 | 534.868965517241 | -6.86896551724138 |
| 51 | 533 | 530.668965517241 | 2.33103448275864 |
| 52 | 536 | 521.868965517241 | 14.1310344827586 |
| 53 | 537 | 516.868965517241 | 20.1310344827586 |
| 54 | 524 | 505.668965517241 | 18.3310344827587 |
| 55 | 536 | 507.868965517241 | 28.1310344827587 |
| 56 | 587 | 551.120145190563 | 35.8798548094374 |
| 57 | 597 | 559.120145190563 | 37.8798548094374 |
| 58 | 581 | 546.720145190563 | 34.2798548094374 |
| 59 | 564 | 528.320145190563 | 35.6798548094374 |
| 60 | 564 | 516.320145190563 | 47.6798548094374 |
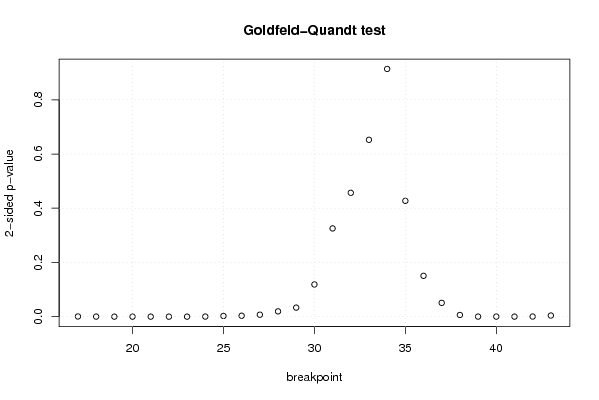
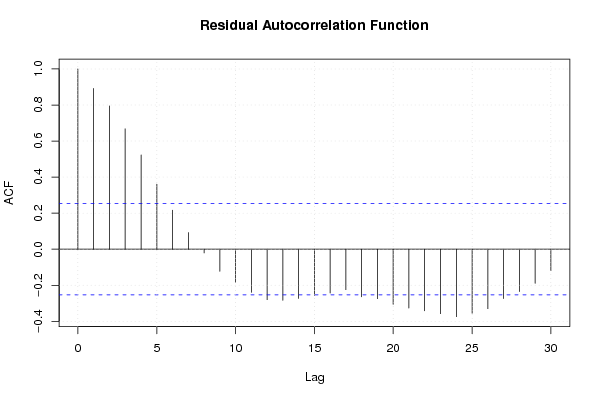
| Goldfeld-Quandt test for Heteroskedasticity | |||
| p-values | Alternative Hypothesis | ||
| breakpoint index | greater | 2-sided | less |
| 17 | 0.000374983176306055 | 0.00074996635261211 | 0.999625016823694 |
| 18 | 8.33910223767402e-05 | 0.000166782044753480 | 0.999916608977623 |
| 19 | 7.82931422786308e-06 | 1.56586284557262e-05 | 0.999992170685772 |
| 20 | 8.09679956352492e-07 | 1.61935991270498e-06 | 0.999999190320044 |
| 21 | 1.45664746061371e-07 | 2.91329492122743e-07 | 0.999999854335254 |
| 22 | 2.09907676212598e-07 | 4.19815352425197e-07 | 0.999999790092324 |
| 23 | 2.22556544203143e-05 | 4.45113088406287e-05 | 0.99997774434558 |
| 24 | 0.000157742647651152 | 0.000315485295302304 | 0.999842257352349 |
| 25 | 0.00130468414216467 | 0.00260936828432934 | 0.998695315857835 |
| 26 | 0.00170607750057233 | 0.00341215500114466 | 0.998293922499428 |
| 27 | 0.0035844129530229 | 0.0071688259060458 | 0.996415587046977 |
| 28 | 0.00975932437505152 | 0.0195186487501030 | 0.990240675624948 |
| 29 | 0.0166680424300703 | 0.0333360848601407 | 0.98333195756993 |
| 30 | 0.059403495917502 | 0.118806991835004 | 0.940596504082498 |
| 31 | 0.162755413671150 | 0.325510827342301 | 0.83724458632885 |
| 32 | 0.228462533591116 | 0.456925067182232 | 0.771537466408884 |
| 33 | 0.32617520671346 | 0.65235041342692 | 0.67382479328654 |
| 34 | 0.54306675798808 | 0.91386648402384 | 0.45693324201192 |
| 35 | 0.786380833359258 | 0.427238333281484 | 0.213619166640742 |
| 36 | 0.924689009289031 | 0.150621981421938 | 0.075310990710969 |
| 37 | 0.974540426079449 | 0.0509191478411022 | 0.0254595739205511 |
| 38 | 0.99689822013294 | 0.00620355973411871 | 0.00310177986705935 |
| 39 | 0.999910964470305 | 0.000178071059389461 | 8.90355296947304e-05 |
| 40 | 0.999930269838352 | 0.000139460323296286 | 6.97301616481428e-05 |
| 41 | 0.999974321969602 | 5.13560607965883e-05 | 2.56780303982942e-05 |
| 42 | 0.99981235945405 | 0.000375281091899909 | 0.000187640545949955 |
| 43 | 0.997927841563397 | 0.00414431687320539 | 0.00207215843660269 |
| Meta Analysis of Goldfeld-Quandt test for Heteroskedasticity | |||
| Description | # significant tests | % significant tests | OK/NOK |
| 1% type I error level | 17 | 0.62962962962963 | NOK |
| 5% type I error level | 19 | 0.703703703703704 | NOK |
| 10% type I error level | 20 | 0.740740740740741 | NOK |