Free Statistics

of Irreproducible Research!

Author's title

Author*The author of this computation has been verified*
R Software Modulerwasp_autocorrelation.wasp
Title produced by software(Partial) Autocorrelation Function
Date of computationWed, 02 Dec 2009 16:46:11 -0700
Cite this page as followsStatistical Computations at FreeStatistics.org, Office for Research Development and Education, URL https://freestatistics.org/blog/index.php?v=date/2009/Dec/03/t12597976213nuwpice62eykkg.htm/, Retrieved Wed, 24 Apr 2024 13:52:57 +0000
Statistical Computations at FreeStatistics.org, Office for Research Development and Education, URL https://freestatistics.org/blog/index.php?pk=62632, Retrieved Wed, 24 Apr 2024 13:52:57 +0000
QR Codes:

Original text written by user:
IsPrivate?No (this computation is public)
User-defined keywords
Estimated Impact159
Family? (F = Feedback message, R = changed R code, M = changed R Module, P = changed Parameters, D = changed Data)
-     [(Partial) Autocorrelation Function] [Autocorrelatie d=...] [2007-11-27 10:25:05] [0089dec2868056b990fdbd23bf9edb23]
- RMPD  [(Partial) Autocorrelation Function] [PAPER] [2009-12-02 23:32:15] [37daf76adc256428993ec4063536c760]
-   P       [(Partial) Autocorrelation Function] [PAPER] [2009-12-02 23:46:11] [2d9a0b3c2f25bb8f387fafb994d0d852] [Current]
Feedback Forum

Post a new message
Dataseries X:
595
591
589
584
573
567
569
621
629
628
612
595
597
593
590
580
574
573
573
620
626
620
588
566
557
561
549
532
526
511
499
555
565
542
527
510
514
517
508
493
490
469
478
528
534
518
506
502
516
528
533
536
537
524
536
587
597
581
564
564


Summary of computational transaction
Raw Inputview raw input (R code)
Raw Outputview raw output of R engine
Computing time2 seconds
R Server'Gwilym Jenkins' @ 72.249.127.135

\begin{tabular}{lllllllll}
\hline
Summary of computational transaction \tabularnewline
Raw Input & view raw input (R code)  \tabularnewline
Raw Output & view raw output of R engine  \tabularnewline
Computing time & 2 seconds \tabularnewline
R Server & 'Gwilym Jenkins' @ 72.249.127.135 \tabularnewline
\hline
\end{tabular}
%Source: https://freestatistics.org/blog/index.php?pk=62632&T=0

[TABLE]
[ROW][C]Summary of computational transaction[/C][/ROW]
[ROW][C]Raw Input[/C][C]view raw input (R code) [/C][/ROW]
[ROW][C]Raw Output[/C][C]view raw output of R engine [/C][/ROW]
[ROW][C]Computing time[/C][C]2 seconds[/C][/ROW]
[ROW][C]R Server[/C][C]'Gwilym Jenkins' @ 72.249.127.135[/C][/ROW]
[/TABLE]
Source: https://freestatistics.org/blog/index.php?pk=62632&T=0

Globally Unique Identifier (entire table): ba.freestatistics.org/blog/index.php?pk=62632&T=0

As an alternative you can also use a QR Code:  

The GUIDs for individual cells are displayed in the table below:

Summary of computational transaction
Raw Inputview raw input (R code)
Raw Outputview raw output of R engine
Computing time2 seconds
R Server'Gwilym Jenkins' @ 72.249.127.135


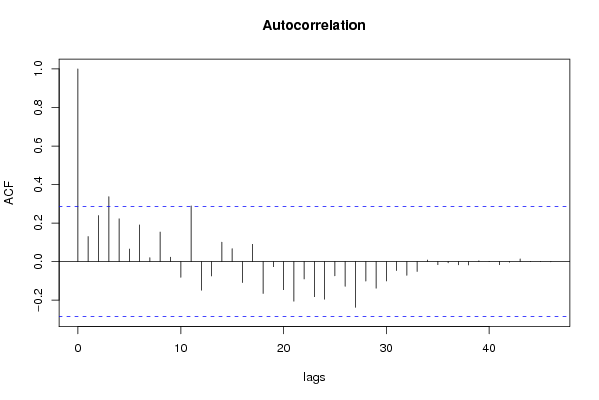
Autocorrelation Function
Time lag kACF(k)T-STATP-value
016.85570
10.1300740.89170.188537
20.2391791.63970.05387
30.3366132.30770.012733
40.221941.52150.067412
50.0651880.44690.328497
60.1903231.30480.099158
70.0204380.14010.444584
80.153391.05160.149183
90.0229850.15760.437732
10-0.081669-0.55990.710896
110.2890171.98140.026706
12-0.148853-1.02050.843638
13-0.074863-0.51320.694905
140.1007280.69060.24662
150.0670180.45950.324014
16-0.109154-0.74830.771004
170.0899740.61680.270162
18-0.165698-1.1360.869135
19-0.026648-0.18270.572086
20-0.146065-1.00140.839112
21-0.205897-1.41160.917667
22-0.090432-0.620.730865
23-0.182002-1.24770.890847
24-0.195024-1.3370.906174
25-0.07395-0.5070.692728
26-0.128428-0.88050.808455
27-0.237266-1.62660.944747
28-0.101052-0.69280.75407
29-0.137963-0.94580.825464
30-0.100748-0.69070.753422
31-0.046344-0.31770.623946
32-0.071487-0.49010.686826
33-0.05132-0.35180.636733
340.0079190.05430.478467
35-0.016389-0.11240.544491
36-0.006332-0.04340.51722
37-0.017085-0.11710.546373
38-0.017711-0.12140.548062
390.0040590.02780.488958
40-0.000548-0.00380.50149
41-0.015966-0.10950.543347
42-0.003171-0.02170.508626
430.0140330.09620.461884
44-0.000337-0.00230.500916
450.0005190.00360.498587
46-0.000996-0.00680.502711
47NANANA

\begin{tabular}{lllllllll}
\hline
Autocorrelation Function \tabularnewline
Time lag k & ACF(k) & T-STAT & P-value \tabularnewline
0 & 1 & 6.8557 & 0 \tabularnewline
1 & 0.130074 & 0.8917 & 0.188537 \tabularnewline
2 & 0.239179 & 1.6397 & 0.05387 \tabularnewline
3 & 0.336613 & 2.3077 & 0.012733 \tabularnewline
4 & 0.22194 & 1.5215 & 0.067412 \tabularnewline
5 & 0.065188 & 0.4469 & 0.328497 \tabularnewline
6 & 0.190323 & 1.3048 & 0.099158 \tabularnewline
7 & 0.020438 & 0.1401 & 0.444584 \tabularnewline
8 & 0.15339 & 1.0516 & 0.149183 \tabularnewline
9 & 0.022985 & 0.1576 & 0.437732 \tabularnewline
10 & -0.081669 & -0.5599 & 0.710896 \tabularnewline
11 & 0.289017 & 1.9814 & 0.026706 \tabularnewline
12 & -0.148853 & -1.0205 & 0.843638 \tabularnewline
13 & -0.074863 & -0.5132 & 0.694905 \tabularnewline
14 & 0.100728 & 0.6906 & 0.24662 \tabularnewline
15 & 0.067018 & 0.4595 & 0.324014 \tabularnewline
16 & -0.109154 & -0.7483 & 0.771004 \tabularnewline
17 & 0.089974 & 0.6168 & 0.270162 \tabularnewline
18 & -0.165698 & -1.136 & 0.869135 \tabularnewline
19 & -0.026648 & -0.1827 & 0.572086 \tabularnewline
20 & -0.146065 & -1.0014 & 0.839112 \tabularnewline
21 & -0.205897 & -1.4116 & 0.917667 \tabularnewline
22 & -0.090432 & -0.62 & 0.730865 \tabularnewline
23 & -0.182002 & -1.2477 & 0.890847 \tabularnewline
24 & -0.195024 & -1.337 & 0.906174 \tabularnewline
25 & -0.07395 & -0.507 & 0.692728 \tabularnewline
26 & -0.128428 & -0.8805 & 0.808455 \tabularnewline
27 & -0.237266 & -1.6266 & 0.944747 \tabularnewline
28 & -0.101052 & -0.6928 & 0.75407 \tabularnewline
29 & -0.137963 & -0.9458 & 0.825464 \tabularnewline
30 & -0.100748 & -0.6907 & 0.753422 \tabularnewline
31 & -0.046344 & -0.3177 & 0.623946 \tabularnewline
32 & -0.071487 & -0.4901 & 0.686826 \tabularnewline
33 & -0.05132 & -0.3518 & 0.636733 \tabularnewline
34 & 0.007919 & 0.0543 & 0.478467 \tabularnewline
35 & -0.016389 & -0.1124 & 0.544491 \tabularnewline
36 & -0.006332 & -0.0434 & 0.51722 \tabularnewline
37 & -0.017085 & -0.1171 & 0.546373 \tabularnewline
38 & -0.017711 & -0.1214 & 0.548062 \tabularnewline
39 & 0.004059 & 0.0278 & 0.488958 \tabularnewline
40 & -0.000548 & -0.0038 & 0.50149 \tabularnewline
41 & -0.015966 & -0.1095 & 0.543347 \tabularnewline
42 & -0.003171 & -0.0217 & 0.508626 \tabularnewline
43 & 0.014033 & 0.0962 & 0.461884 \tabularnewline
44 & -0.000337 & -0.0023 & 0.500916 \tabularnewline
45 & 0.000519 & 0.0036 & 0.498587 \tabularnewline
46 & -0.000996 & -0.0068 & 0.502711 \tabularnewline
47 & NA & NA & NA \tabularnewline
\hline
\end{tabular}
%Source: https://freestatistics.org/blog/index.php?pk=62632&T=1

[TABLE]
[ROW][C]Autocorrelation Function[/C][/ROW]
[ROW][C]Time lag k[/C][C]ACF(k)[/C][C]T-STAT[/C][C]P-value[/C][/ROW]
[ROW][C]0[/C][C]1[/C][C]6.8557[/C][C]0[/C][/ROW]
[ROW][C]1[/C][C]0.130074[/C][C]0.8917[/C][C]0.188537[/C][/ROW]
[ROW][C]2[/C][C]0.239179[/C][C]1.6397[/C][C]0.05387[/C][/ROW]
[ROW][C]3[/C][C]0.336613[/C][C]2.3077[/C][C]0.012733[/C][/ROW]
[ROW][C]4[/C][C]0.22194[/C][C]1.5215[/C][C]0.067412[/C][/ROW]
[ROW][C]5[/C][C]0.065188[/C][C]0.4469[/C][C]0.328497[/C][/ROW]
[ROW][C]6[/C][C]0.190323[/C][C]1.3048[/C][C]0.099158[/C][/ROW]
[ROW][C]7[/C][C]0.020438[/C][C]0.1401[/C][C]0.444584[/C][/ROW]
[ROW][C]8[/C][C]0.15339[/C][C]1.0516[/C][C]0.149183[/C][/ROW]
[ROW][C]9[/C][C]0.022985[/C][C]0.1576[/C][C]0.437732[/C][/ROW]
[ROW][C]10[/C][C]-0.081669[/C][C]-0.5599[/C][C]0.710896[/C][/ROW]
[ROW][C]11[/C][C]0.289017[/C][C]1.9814[/C][C]0.026706[/C][/ROW]
[ROW][C]12[/C][C]-0.148853[/C][C]-1.0205[/C][C]0.843638[/C][/ROW]
[ROW][C]13[/C][C]-0.074863[/C][C]-0.5132[/C][C]0.694905[/C][/ROW]
[ROW][C]14[/C][C]0.100728[/C][C]0.6906[/C][C]0.24662[/C][/ROW]
[ROW][C]15[/C][C]0.067018[/C][C]0.4595[/C][C]0.324014[/C][/ROW]
[ROW][C]16[/C][C]-0.109154[/C][C]-0.7483[/C][C]0.771004[/C][/ROW]
[ROW][C]17[/C][C]0.089974[/C][C]0.6168[/C][C]0.270162[/C][/ROW]
[ROW][C]18[/C][C]-0.165698[/C][C]-1.136[/C][C]0.869135[/C][/ROW]
[ROW][C]19[/C][C]-0.026648[/C][C]-0.1827[/C][C]0.572086[/C][/ROW]
[ROW][C]20[/C][C]-0.146065[/C][C]-1.0014[/C][C]0.839112[/C][/ROW]
[ROW][C]21[/C][C]-0.205897[/C][C]-1.4116[/C][C]0.917667[/C][/ROW]
[ROW][C]22[/C][C]-0.090432[/C][C]-0.62[/C][C]0.730865[/C][/ROW]
[ROW][C]23[/C][C]-0.182002[/C][C]-1.2477[/C][C]0.890847[/C][/ROW]
[ROW][C]24[/C][C]-0.195024[/C][C]-1.337[/C][C]0.906174[/C][/ROW]
[ROW][C]25[/C][C]-0.07395[/C][C]-0.507[/C][C]0.692728[/C][/ROW]
[ROW][C]26[/C][C]-0.128428[/C][C]-0.8805[/C][C]0.808455[/C][/ROW]
[ROW][C]27[/C][C]-0.237266[/C][C]-1.6266[/C][C]0.944747[/C][/ROW]
[ROW][C]28[/C][C]-0.101052[/C][C]-0.6928[/C][C]0.75407[/C][/ROW]
[ROW][C]29[/C][C]-0.137963[/C][C]-0.9458[/C][C]0.825464[/C][/ROW]
[ROW][C]30[/C][C]-0.100748[/C][C]-0.6907[/C][C]0.753422[/C][/ROW]
[ROW][C]31[/C][C]-0.046344[/C][C]-0.3177[/C][C]0.623946[/C][/ROW]
[ROW][C]32[/C][C]-0.071487[/C][C]-0.4901[/C][C]0.686826[/C][/ROW]
[ROW][C]33[/C][C]-0.05132[/C][C]-0.3518[/C][C]0.636733[/C][/ROW]
[ROW][C]34[/C][C]0.007919[/C][C]0.0543[/C][C]0.478467[/C][/ROW]
[ROW][C]35[/C][C]-0.016389[/C][C]-0.1124[/C][C]0.544491[/C][/ROW]
[ROW][C]36[/C][C]-0.006332[/C][C]-0.0434[/C][C]0.51722[/C][/ROW]
[ROW][C]37[/C][C]-0.017085[/C][C]-0.1171[/C][C]0.546373[/C][/ROW]
[ROW][C]38[/C][C]-0.017711[/C][C]-0.1214[/C][C]0.548062[/C][/ROW]
[ROW][C]39[/C][C]0.004059[/C][C]0.0278[/C][C]0.488958[/C][/ROW]
[ROW][C]40[/C][C]-0.000548[/C][C]-0.0038[/C][C]0.50149[/C][/ROW]
[ROW][C]41[/C][C]-0.015966[/C][C]-0.1095[/C][C]0.543347[/C][/ROW]
[ROW][C]42[/C][C]-0.003171[/C][C]-0.0217[/C][C]0.508626[/C][/ROW]
[ROW][C]43[/C][C]0.014033[/C][C]0.0962[/C][C]0.461884[/C][/ROW]
[ROW][C]44[/C][C]-0.000337[/C][C]-0.0023[/C][C]0.500916[/C][/ROW]
[ROW][C]45[/C][C]0.000519[/C][C]0.0036[/C][C]0.498587[/C][/ROW]
[ROW][C]46[/C][C]-0.000996[/C][C]-0.0068[/C][C]0.502711[/C][/ROW]
[ROW][C]47[/C][C]NA[/C][C]NA[/C][C]NA[/C][/ROW]
[/TABLE]
Source: https://freestatistics.org/blog/index.php?pk=62632&T=1

Globally Unique Identifier (entire table): ba.freestatistics.org/blog/index.php?pk=62632&T=1

As an alternative you can also use a QR Code:  

The GUIDs for individual cells are displayed in the table below:

Autocorrelation Function
Time lag kACF(k)T-STATP-value
016.85570
10.1300740.89170.188537
20.2391791.63970.05387
30.3366132.30770.012733
40.221941.52150.067412
50.0651880.44690.328497
60.1903231.30480.099158
70.0204380.14010.444584
80.153391.05160.149183
90.0229850.15760.437732
10-0.081669-0.55990.710896
110.2890171.98140.026706
12-0.148853-1.02050.843638
13-0.074863-0.51320.694905
140.1007280.69060.24662
150.0670180.45950.324014
16-0.109154-0.74830.771004
170.0899740.61680.270162
18-0.165698-1.1360.869135
19-0.026648-0.18270.572086
20-0.146065-1.00140.839112
21-0.205897-1.41160.917667
22-0.090432-0.620.730865
23-0.182002-1.24770.890847
24-0.195024-1.3370.906174
25-0.07395-0.5070.692728
26-0.128428-0.88050.808455
27-0.237266-1.62660.944747
28-0.101052-0.69280.75407
29-0.137963-0.94580.825464
30-0.100748-0.69070.753422
31-0.046344-0.31770.623946
32-0.071487-0.49010.686826
33-0.05132-0.35180.636733
340.0079190.05430.478467
35-0.016389-0.11240.544491
36-0.006332-0.04340.51722
37-0.017085-0.11710.546373
38-0.017711-0.12140.548062
390.0040590.02780.488958
40-0.000548-0.00380.50149
41-0.015966-0.10950.543347
42-0.003171-0.02170.508626
430.0140330.09620.461884
44-0.000337-0.00230.500916
450.0005190.00360.498587
46-0.000996-0.00680.502711
47NANANA


Partial Autocorrelation Function
Time lag kPACF(k)T-STATP-value
00.1300740.89170.188537
10.2260851.550.06393
20.3035152.08080.021464
30.1474871.01110.158568
4-0.095052-0.65160.741097
50.0224210.15370.439249
6-0.108369-0.74290.769392
70.1139820.78140.219237
8-0.026812-0.18380.572524
9-0.161511-1.10730.863093
100.315282.16150.017893
11-0.244519-1.67630.949844
12-0.068649-0.47060.679961
130.0519950.35650.361546
140.1186770.81360.209986
150.0093490.06410.474584
16-0.059509-0.4080.657428
17-0.186181-1.27640.895956
18-0.095941-0.65770.743043
19-0.083308-0.57110.714685
20-0.065487-0.4490.672236
21-0.080746-0.55360.708751
220.008010.05490.478221
230.0521620.35760.361119
24-0.042328-0.29020.613524
25-0.055912-0.38330.648391
26-0.072693-0.49840.689721
27-0.095802-0.65680.742739
280.1089610.7470.229392
29-0.042137-0.28890.613027
300.0970150.66510.254617
310.010860.07450.470484
32-0.039351-0.26980.605743
330.047120.3230.37405
340.0459320.31490.377118
350.0186350.12780.449443
36-0.036035-0.2470.597025
370.0138250.09480.462448
38-0.048226-0.33060.628799
39-0.092102-0.63140.734588
40-0.013007-0.08920.535338
41-0.05092-0.34910.635708
420.0642330.44040.330848
430.0376640.25820.398686
44-0.082975-0.56880.713915
45-0.123238-0.84490.798771
46NANANA
47NANANA

\begin{tabular}{lllllllll}
\hline
Partial Autocorrelation Function \tabularnewline
Time lag k & PACF(k) & T-STAT & P-value \tabularnewline
0 & 0.130074 & 0.8917 & 0.188537 \tabularnewline
1 & 0.226085 & 1.55 & 0.06393 \tabularnewline
2 & 0.303515 & 2.0808 & 0.021464 \tabularnewline
3 & 0.147487 & 1.0111 & 0.158568 \tabularnewline
4 & -0.095052 & -0.6516 & 0.741097 \tabularnewline
5 & 0.022421 & 0.1537 & 0.439249 \tabularnewline
6 & -0.108369 & -0.7429 & 0.769392 \tabularnewline
7 & 0.113982 & 0.7814 & 0.219237 \tabularnewline
8 & -0.026812 & -0.1838 & 0.572524 \tabularnewline
9 & -0.161511 & -1.1073 & 0.863093 \tabularnewline
10 & 0.31528 & 2.1615 & 0.017893 \tabularnewline
11 & -0.244519 & -1.6763 & 0.949844 \tabularnewline
12 & -0.068649 & -0.4706 & 0.679961 \tabularnewline
13 & 0.051995 & 0.3565 & 0.361546 \tabularnewline
14 & 0.118677 & 0.8136 & 0.209986 \tabularnewline
15 & 0.009349 & 0.0641 & 0.474584 \tabularnewline
16 & -0.059509 & -0.408 & 0.657428 \tabularnewline
17 & -0.186181 & -1.2764 & 0.895956 \tabularnewline
18 & -0.095941 & -0.6577 & 0.743043 \tabularnewline
19 & -0.083308 & -0.5711 & 0.714685 \tabularnewline
20 & -0.065487 & -0.449 & 0.672236 \tabularnewline
21 & -0.080746 & -0.5536 & 0.708751 \tabularnewline
22 & 0.00801 & 0.0549 & 0.478221 \tabularnewline
23 & 0.052162 & 0.3576 & 0.361119 \tabularnewline
24 & -0.042328 & -0.2902 & 0.613524 \tabularnewline
25 & -0.055912 & -0.3833 & 0.648391 \tabularnewline
26 & -0.072693 & -0.4984 & 0.689721 \tabularnewline
27 & -0.095802 & -0.6568 & 0.742739 \tabularnewline
28 & 0.108961 & 0.747 & 0.229392 \tabularnewline
29 & -0.042137 & -0.2889 & 0.613027 \tabularnewline
30 & 0.097015 & 0.6651 & 0.254617 \tabularnewline
31 & 0.01086 & 0.0745 & 0.470484 \tabularnewline
32 & -0.039351 & -0.2698 & 0.605743 \tabularnewline
33 & 0.04712 & 0.323 & 0.37405 \tabularnewline
34 & 0.045932 & 0.3149 & 0.377118 \tabularnewline
35 & 0.018635 & 0.1278 & 0.449443 \tabularnewline
36 & -0.036035 & -0.247 & 0.597025 \tabularnewline
37 & 0.013825 & 0.0948 & 0.462448 \tabularnewline
38 & -0.048226 & -0.3306 & 0.628799 \tabularnewline
39 & -0.092102 & -0.6314 & 0.734588 \tabularnewline
40 & -0.013007 & -0.0892 & 0.535338 \tabularnewline
41 & -0.05092 & -0.3491 & 0.635708 \tabularnewline
42 & 0.064233 & 0.4404 & 0.330848 \tabularnewline
43 & 0.037664 & 0.2582 & 0.398686 \tabularnewline
44 & -0.082975 & -0.5688 & 0.713915 \tabularnewline
45 & -0.123238 & -0.8449 & 0.798771 \tabularnewline
46 & NA & NA & NA \tabularnewline
47 & NA & NA & NA \tabularnewline
\hline
\end{tabular}
%Source: https://freestatistics.org/blog/index.php?pk=62632&T=2

[TABLE]
[ROW][C]Partial Autocorrelation Function[/C][/ROW]
[ROW][C]Time lag k[/C][C]PACF(k)[/C][C]T-STAT[/C][C]P-value[/C][/ROW]
[ROW][C]0[/C][C]0.130074[/C][C]0.8917[/C][C]0.188537[/C][/ROW]
[ROW][C]1[/C][C]0.226085[/C][C]1.55[/C][C]0.06393[/C][/ROW]
[ROW][C]2[/C][C]0.303515[/C][C]2.0808[/C][C]0.021464[/C][/ROW]
[ROW][C]3[/C][C]0.147487[/C][C]1.0111[/C][C]0.158568[/C][/ROW]
[ROW][C]4[/C][C]-0.095052[/C][C]-0.6516[/C][C]0.741097[/C][/ROW]
[ROW][C]5[/C][C]0.022421[/C][C]0.1537[/C][C]0.439249[/C][/ROW]
[ROW][C]6[/C][C]-0.108369[/C][C]-0.7429[/C][C]0.769392[/C][/ROW]
[ROW][C]7[/C][C]0.113982[/C][C]0.7814[/C][C]0.219237[/C][/ROW]
[ROW][C]8[/C][C]-0.026812[/C][C]-0.1838[/C][C]0.572524[/C][/ROW]
[ROW][C]9[/C][C]-0.161511[/C][C]-1.1073[/C][C]0.863093[/C][/ROW]
[ROW][C]10[/C][C]0.31528[/C][C]2.1615[/C][C]0.017893[/C][/ROW]
[ROW][C]11[/C][C]-0.244519[/C][C]-1.6763[/C][C]0.949844[/C][/ROW]
[ROW][C]12[/C][C]-0.068649[/C][C]-0.4706[/C][C]0.679961[/C][/ROW]
[ROW][C]13[/C][C]0.051995[/C][C]0.3565[/C][C]0.361546[/C][/ROW]
[ROW][C]14[/C][C]0.118677[/C][C]0.8136[/C][C]0.209986[/C][/ROW]
[ROW][C]15[/C][C]0.009349[/C][C]0.0641[/C][C]0.474584[/C][/ROW]
[ROW][C]16[/C][C]-0.059509[/C][C]-0.408[/C][C]0.657428[/C][/ROW]
[ROW][C]17[/C][C]-0.186181[/C][C]-1.2764[/C][C]0.895956[/C][/ROW]
[ROW][C]18[/C][C]-0.095941[/C][C]-0.6577[/C][C]0.743043[/C][/ROW]
[ROW][C]19[/C][C]-0.083308[/C][C]-0.5711[/C][C]0.714685[/C][/ROW]
[ROW][C]20[/C][C]-0.065487[/C][C]-0.449[/C][C]0.672236[/C][/ROW]
[ROW][C]21[/C][C]-0.080746[/C][C]-0.5536[/C][C]0.708751[/C][/ROW]
[ROW][C]22[/C][C]0.00801[/C][C]0.0549[/C][C]0.478221[/C][/ROW]
[ROW][C]23[/C][C]0.052162[/C][C]0.3576[/C][C]0.361119[/C][/ROW]
[ROW][C]24[/C][C]-0.042328[/C][C]-0.2902[/C][C]0.613524[/C][/ROW]
[ROW][C]25[/C][C]-0.055912[/C][C]-0.3833[/C][C]0.648391[/C][/ROW]
[ROW][C]26[/C][C]-0.072693[/C][C]-0.4984[/C][C]0.689721[/C][/ROW]
[ROW][C]27[/C][C]-0.095802[/C][C]-0.6568[/C][C]0.742739[/C][/ROW]
[ROW][C]28[/C][C]0.108961[/C][C]0.747[/C][C]0.229392[/C][/ROW]
[ROW][C]29[/C][C]-0.042137[/C][C]-0.2889[/C][C]0.613027[/C][/ROW]
[ROW][C]30[/C][C]0.097015[/C][C]0.6651[/C][C]0.254617[/C][/ROW]
[ROW][C]31[/C][C]0.01086[/C][C]0.0745[/C][C]0.470484[/C][/ROW]
[ROW][C]32[/C][C]-0.039351[/C][C]-0.2698[/C][C]0.605743[/C][/ROW]
[ROW][C]33[/C][C]0.04712[/C][C]0.323[/C][C]0.37405[/C][/ROW]
[ROW][C]34[/C][C]0.045932[/C][C]0.3149[/C][C]0.377118[/C][/ROW]
[ROW][C]35[/C][C]0.018635[/C][C]0.1278[/C][C]0.449443[/C][/ROW]
[ROW][C]36[/C][C]-0.036035[/C][C]-0.247[/C][C]0.597025[/C][/ROW]
[ROW][C]37[/C][C]0.013825[/C][C]0.0948[/C][C]0.462448[/C][/ROW]
[ROW][C]38[/C][C]-0.048226[/C][C]-0.3306[/C][C]0.628799[/C][/ROW]
[ROW][C]39[/C][C]-0.092102[/C][C]-0.6314[/C][C]0.734588[/C][/ROW]
[ROW][C]40[/C][C]-0.013007[/C][C]-0.0892[/C][C]0.535338[/C][/ROW]
[ROW][C]41[/C][C]-0.05092[/C][C]-0.3491[/C][C]0.635708[/C][/ROW]
[ROW][C]42[/C][C]0.064233[/C][C]0.4404[/C][C]0.330848[/C][/ROW]
[ROW][C]43[/C][C]0.037664[/C][C]0.2582[/C][C]0.398686[/C][/ROW]
[ROW][C]44[/C][C]-0.082975[/C][C]-0.5688[/C][C]0.713915[/C][/ROW]
[ROW][C]45[/C][C]-0.123238[/C][C]-0.8449[/C][C]0.798771[/C][/ROW]
[ROW][C]46[/C][C]NA[/C][C]NA[/C][C]NA[/C][/ROW]
[ROW][C]47[/C][C]NA[/C][C]NA[/C][C]NA[/C][/ROW]
[/TABLE]
Source: https://freestatistics.org/blog/index.php?pk=62632&T=2

Globally Unique Identifier (entire table): ba.freestatistics.org/blog/index.php?pk=62632&T=2

As an alternative you can also use a QR Code:  

The GUIDs for individual cells are displayed in the table below:

Partial Autocorrelation Function
Time lag kPACF(k)T-STATP-value
00.1300740.89170.188537
10.2260851.550.06393
20.3035152.08080.021464
30.1474871.01110.158568
4-0.095052-0.65160.741097
50.0224210.15370.439249
6-0.108369-0.74290.769392
70.1139820.78140.219237
8-0.026812-0.18380.572524
9-0.161511-1.10730.863093
100.315282.16150.017893
11-0.244519-1.67630.949844
12-0.068649-0.47060.679961
130.0519950.35650.361546
140.1186770.81360.209986
150.0093490.06410.474584
16-0.059509-0.4080.657428
17-0.186181-1.27640.895956
18-0.095941-0.65770.743043
19-0.083308-0.57110.714685
20-0.065487-0.4490.672236
21-0.080746-0.55360.708751
220.008010.05490.478221
230.0521620.35760.361119
24-0.042328-0.29020.613524
25-0.055912-0.38330.648391
26-0.072693-0.49840.689721
27-0.095802-0.65680.742739
280.1089610.7470.229392
29-0.042137-0.28890.613027
300.0970150.66510.254617
310.010860.07450.470484
32-0.039351-0.26980.605743
330.047120.3230.37405
340.0459320.31490.377118
350.0186350.12780.449443
36-0.036035-0.2470.597025
370.0138250.09480.462448
38-0.048226-0.33060.628799
39-0.092102-0.63140.734588
40-0.013007-0.08920.535338
41-0.05092-0.34910.635708
420.0642330.44040.330848
430.0376640.25820.398686
44-0.082975-0.56880.713915
45-0.123238-0.84490.798771
46NANANA
47NANANA


Parameters (Session):
par1 = 1 ; par2 = 0 ; par3 = 0 ; par4 = 12 ;
Parameters (R input):
par1 = 48 ; par2 = 1 ; par3 = 1 ; par4 = 1 ; par5 = 12 ; par6 = White Noise ; par7 = ;
R code (references can be found in the software module):
if (par1 == 'Default') {
par1 = 10*log10(length(x))
} else {
par1 <- as.numeric(par1)
}
par2 <- as.numeric(par2)
par3 <- as.numeric(par3)
par4 <- as.numeric(par4)
par5 <- as.numeric(par5)
if (par2 == 0) {
x <- log(x)
} else {
x <- (x ^ par2 - 1) / par2
}
if (par3 > 0) x <- diff(x,lag=1,difference=par3)
if (par4 > 0) x <- diff(x,lag=par5,difference=par4)
bitmap(file='pic1.png')
racf <- acf(x,par1,main='Autocorrelation',xlab='lags',ylab='ACF')
dev.off()
bitmap(file='pic2.png')
rpacf <- pacf(x,par1,main='Partial Autocorrelation',xlab='lags',ylab='PACF')
dev.off()
(myacf <- c(racf$acf))
(mypacf <- c(rpacf$acf))
lengthx <- length(x)
sqrtn <- sqrt(lengthx)
load(file='createtable')
a<-table.start()
a<-table.row.start(a)
a<-table.element(a,'Autocorrelation Function',4,TRUE)
a<-table.row.end(a)
a<-table.row.start(a)
a<-table.element(a,'Time lag k',header=TRUE)
a<-table.element(a,hyperlink('basics.htm','ACF(k)','click here for more information about the Autocorrelation Function'),header=TRUE)
a<-table.element(a,'T-STAT',header=TRUE)
a<-table.element(a,'P-value',header=TRUE)
a<-table.row.end(a)
for (i in 1:par1) {
a<-table.row.start(a)
a<-table.element(a,i-1,header=TRUE)
a<-table.element(a,round(myacf[i],6))
mytstat <- myacf[i]*sqrtn
a<-table.element(a,round(mytstat,4))
a<-table.element(a,round(1-pt(mytstat,lengthx),6))
a<-table.row.end(a)
}
a<-table.end(a)
table.save(a,file='mytable.tab')
a<-table.start()
a<-table.row.start(a)
a<-table.element(a,'Partial Autocorrelation Function',4,TRUE)
a<-table.row.end(a)
a<-table.row.start(a)
a<-table.element(a,'Time lag k',header=TRUE)
a<-table.element(a,hyperlink('basics.htm','PACF(k)','click here for more information about the Partial Autocorrelation Function'),header=TRUE)
a<-table.element(a,'T-STAT',header=TRUE)
a<-table.element(a,'P-value',header=TRUE)
a<-table.row.end(a)
for (i in 1:par1) {
a<-table.row.start(a)
a<-table.element(a,i-1,header=TRUE)
a<-table.element(a,round(mypacf[i],6))
mytstat <- mypacf[i]*sqrtn
a<-table.element(a,round(mytstat,4))
a<-table.element(a,round(1-pt(mytstat,lengthx),6))
a<-table.row.end(a)
}
a<-table.end(a)
table.save(a,file='mytable1.tab')