Free Statistics

of Irreproducible Research!

Author's title

Author*The author of this computation has been verified*
R Software Modulerwasp_autocorrelation.wasp
Title produced by software(Partial) Autocorrelation Function
Date of computationThu, 03 Dec 2009 02:44:29 -0700
Cite this page as followsStatistical Computations at FreeStatistics.org, Office for Research Development and Education, URL https://freestatistics.org/blog/index.php?v=date/2009/Dec/03/t1259833514nc2hvbkuwaehlpo.htm/, Retrieved Fri, 19 Apr 2024 18:55:01 +0000
Statistical Computations at FreeStatistics.org, Office for Research Development and Education, URL https://freestatistics.org/blog/index.php?pk=62649, Retrieved Fri, 19 Apr 2024 18:55:01 +0000
QR Codes:

Original text written by user:
IsPrivate?No (this computation is public)
User-defined keywords
Estimated Impact178
Family? (F = Feedback message, R = changed R code, M = changed R Module, P = changed Parameters, D = changed Data)
-       [(Partial) Autocorrelation Function] [] [2009-12-03 09:44:29] [fd7715938ba69fff5a3edaf7913b7ba1] [Current]
Feedback Forum

Post a new message
Dataseries X:
96.8
114.1
110.3
103.9
101.6
94.6
95.9
104.7
102.8
98.1
113.9
80.9
95.7
113.2
105.9
108.8
102.3
99
100.7
115.5
100.7
109.9
114.6
85.4
100.5
114.8
116.5
112.9
102
106
105.3
118.8
106.1
109.3
117.2
92.5
104.2
112.5
122.4
113.3
100
110.7
112.8
109.8
117.3
109.1
115.9
96
99.8
116.8
115.7
99.4
94.3
91
93.2
103.1
94.1
91.8
102.7
82.6
89.1


Summary of computational transaction
Raw Inputview raw input (R code)
Raw Outputview raw output of R engine
Computing time1 seconds
R Server'Gwilym Jenkins' @ 72.249.127.135

\begin{tabular}{lllllllll}
\hline
Summary of computational transaction \tabularnewline
Raw Input & view raw input (R code)  \tabularnewline
Raw Output & view raw output of R engine  \tabularnewline
Computing time & 1 seconds \tabularnewline
R Server & 'Gwilym Jenkins' @ 72.249.127.135 \tabularnewline
\hline
\end{tabular}
%Source: https://freestatistics.org/blog/index.php?pk=62649&T=0

[TABLE]
[ROW][C]Summary of computational transaction[/C][/ROW]
[ROW][C]Raw Input[/C][C]view raw input (R code) [/C][/ROW]
[ROW][C]Raw Output[/C][C]view raw output of R engine [/C][/ROW]
[ROW][C]Computing time[/C][C]1 seconds[/C][/ROW]
[ROW][C]R Server[/C][C]'Gwilym Jenkins' @ 72.249.127.135[/C][/ROW]
[/TABLE]
Source: https://freestatistics.org/blog/index.php?pk=62649&T=0

Globally Unique Identifier (entire table): ba.freestatistics.org/blog/index.php?pk=62649&T=0

As an alternative you can also use a QR Code:  

The GUIDs for individual cells are displayed in the table below:

Summary of computational transaction
Raw Inputview raw input (R code)
Raw Outputview raw output of R engine
Computing time1 seconds
R Server'Gwilym Jenkins' @ 72.249.127.135


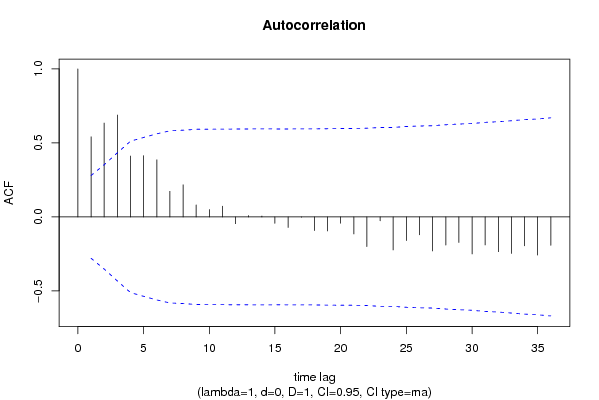
Autocorrelation Function
Time lag kACF(k)T-STATP-value
10.5416623.79160.000206
20.6344044.44082.6e-05
30.6886674.82077e-06
40.4113752.87960.002944
50.4133852.89370.002834
60.3862422.70370.0047
70.1730171.21110.115829
80.2166131.51630.067936
90.0805990.56420.287599
100.0496260.34740.364896
110.0725260.50770.306978
12-0.045937-0.32160.374577
130.0094040.06580.47389
140.0055340.03870.484628
15-0.043201-0.30240.38181
16-0.071463-0.50020.309572
17-0.002461-0.01720.493163
18-0.092116-0.64480.261028
19-0.095253-0.66680.254022
20-0.042749-0.29920.38301
21-0.115617-0.80930.211123
22-0.200366-1.40260.083526
23-0.026699-0.18690.426257
24-0.223632-1.56540.06196
25-0.160312-1.12220.133626
26-0.121284-0.8490.200008
27-0.23025-1.61170.05672
28-0.190716-1.3350.094021
29-0.172903-1.21030.11598
30-0.250831-1.75580.042684
31-0.189723-1.32810.095155
32-0.23557-1.6490.052774
33-0.246954-1.72870.045082
34-0.195329-1.36730.088885
35-0.258386-1.80870.038317
36-0.191868-1.34310.092718

\begin{tabular}{lllllllll}
\hline
Autocorrelation Function \tabularnewline
Time lag k & ACF(k) & T-STAT & P-value \tabularnewline
1 & 0.541662 & 3.7916 & 0.000206 \tabularnewline
2 & 0.634404 & 4.4408 & 2.6e-05 \tabularnewline
3 & 0.688667 & 4.8207 & 7e-06 \tabularnewline
4 & 0.411375 & 2.8796 & 0.002944 \tabularnewline
5 & 0.413385 & 2.8937 & 0.002834 \tabularnewline
6 & 0.386242 & 2.7037 & 0.0047 \tabularnewline
7 & 0.173017 & 1.2111 & 0.115829 \tabularnewline
8 & 0.216613 & 1.5163 & 0.067936 \tabularnewline
9 & 0.080599 & 0.5642 & 0.287599 \tabularnewline
10 & 0.049626 & 0.3474 & 0.364896 \tabularnewline
11 & 0.072526 & 0.5077 & 0.306978 \tabularnewline
12 & -0.045937 & -0.3216 & 0.374577 \tabularnewline
13 & 0.009404 & 0.0658 & 0.47389 \tabularnewline
14 & 0.005534 & 0.0387 & 0.484628 \tabularnewline
15 & -0.043201 & -0.3024 & 0.38181 \tabularnewline
16 & -0.071463 & -0.5002 & 0.309572 \tabularnewline
17 & -0.002461 & -0.0172 & 0.493163 \tabularnewline
18 & -0.092116 & -0.6448 & 0.261028 \tabularnewline
19 & -0.095253 & -0.6668 & 0.254022 \tabularnewline
20 & -0.042749 & -0.2992 & 0.38301 \tabularnewline
21 & -0.115617 & -0.8093 & 0.211123 \tabularnewline
22 & -0.200366 & -1.4026 & 0.083526 \tabularnewline
23 & -0.026699 & -0.1869 & 0.426257 \tabularnewline
24 & -0.223632 & -1.5654 & 0.06196 \tabularnewline
25 & -0.160312 & -1.1222 & 0.133626 \tabularnewline
26 & -0.121284 & -0.849 & 0.200008 \tabularnewline
27 & -0.23025 & -1.6117 & 0.05672 \tabularnewline
28 & -0.190716 & -1.335 & 0.094021 \tabularnewline
29 & -0.172903 & -1.2103 & 0.11598 \tabularnewline
30 & -0.250831 & -1.7558 & 0.042684 \tabularnewline
31 & -0.189723 & -1.3281 & 0.095155 \tabularnewline
32 & -0.23557 & -1.649 & 0.052774 \tabularnewline
33 & -0.246954 & -1.7287 & 0.045082 \tabularnewline
34 & -0.195329 & -1.3673 & 0.088885 \tabularnewline
35 & -0.258386 & -1.8087 & 0.038317 \tabularnewline
36 & -0.191868 & -1.3431 & 0.092718 \tabularnewline
\hline
\end{tabular}
%Source: https://freestatistics.org/blog/index.php?pk=62649&T=1

[TABLE]
[ROW][C]Autocorrelation Function[/C][/ROW]
[ROW][C]Time lag k[/C][C]ACF(k)[/C][C]T-STAT[/C][C]P-value[/C][/ROW]
[ROW][C]1[/C][C]0.541662[/C][C]3.7916[/C][C]0.000206[/C][/ROW]
[ROW][C]2[/C][C]0.634404[/C][C]4.4408[/C][C]2.6e-05[/C][/ROW]
[ROW][C]3[/C][C]0.688667[/C][C]4.8207[/C][C]7e-06[/C][/ROW]
[ROW][C]4[/C][C]0.411375[/C][C]2.8796[/C][C]0.002944[/C][/ROW]
[ROW][C]5[/C][C]0.413385[/C][C]2.8937[/C][C]0.002834[/C][/ROW]
[ROW][C]6[/C][C]0.386242[/C][C]2.7037[/C][C]0.0047[/C][/ROW]
[ROW][C]7[/C][C]0.173017[/C][C]1.2111[/C][C]0.115829[/C][/ROW]
[ROW][C]8[/C][C]0.216613[/C][C]1.5163[/C][C]0.067936[/C][/ROW]
[ROW][C]9[/C][C]0.080599[/C][C]0.5642[/C][C]0.287599[/C][/ROW]
[ROW][C]10[/C][C]0.049626[/C][C]0.3474[/C][C]0.364896[/C][/ROW]
[ROW][C]11[/C][C]0.072526[/C][C]0.5077[/C][C]0.306978[/C][/ROW]
[ROW][C]12[/C][C]-0.045937[/C][C]-0.3216[/C][C]0.374577[/C][/ROW]
[ROW][C]13[/C][C]0.009404[/C][C]0.0658[/C][C]0.47389[/C][/ROW]
[ROW][C]14[/C][C]0.005534[/C][C]0.0387[/C][C]0.484628[/C][/ROW]
[ROW][C]15[/C][C]-0.043201[/C][C]-0.3024[/C][C]0.38181[/C][/ROW]
[ROW][C]16[/C][C]-0.071463[/C][C]-0.5002[/C][C]0.309572[/C][/ROW]
[ROW][C]17[/C][C]-0.002461[/C][C]-0.0172[/C][C]0.493163[/C][/ROW]
[ROW][C]18[/C][C]-0.092116[/C][C]-0.6448[/C][C]0.261028[/C][/ROW]
[ROW][C]19[/C][C]-0.095253[/C][C]-0.6668[/C][C]0.254022[/C][/ROW]
[ROW][C]20[/C][C]-0.042749[/C][C]-0.2992[/C][C]0.38301[/C][/ROW]
[ROW][C]21[/C][C]-0.115617[/C][C]-0.8093[/C][C]0.211123[/C][/ROW]
[ROW][C]22[/C][C]-0.200366[/C][C]-1.4026[/C][C]0.083526[/C][/ROW]
[ROW][C]23[/C][C]-0.026699[/C][C]-0.1869[/C][C]0.426257[/C][/ROW]
[ROW][C]24[/C][C]-0.223632[/C][C]-1.5654[/C][C]0.06196[/C][/ROW]
[ROW][C]25[/C][C]-0.160312[/C][C]-1.1222[/C][C]0.133626[/C][/ROW]
[ROW][C]26[/C][C]-0.121284[/C][C]-0.849[/C][C]0.200008[/C][/ROW]
[ROW][C]27[/C][C]-0.23025[/C][C]-1.6117[/C][C]0.05672[/C][/ROW]
[ROW][C]28[/C][C]-0.190716[/C][C]-1.335[/C][C]0.094021[/C][/ROW]
[ROW][C]29[/C][C]-0.172903[/C][C]-1.2103[/C][C]0.11598[/C][/ROW]
[ROW][C]30[/C][C]-0.250831[/C][C]-1.7558[/C][C]0.042684[/C][/ROW]
[ROW][C]31[/C][C]-0.189723[/C][C]-1.3281[/C][C]0.095155[/C][/ROW]
[ROW][C]32[/C][C]-0.23557[/C][C]-1.649[/C][C]0.052774[/C][/ROW]
[ROW][C]33[/C][C]-0.246954[/C][C]-1.7287[/C][C]0.045082[/C][/ROW]
[ROW][C]34[/C][C]-0.195329[/C][C]-1.3673[/C][C]0.088885[/C][/ROW]
[ROW][C]35[/C][C]-0.258386[/C][C]-1.8087[/C][C]0.038317[/C][/ROW]
[ROW][C]36[/C][C]-0.191868[/C][C]-1.3431[/C][C]0.092718[/C][/ROW]
[/TABLE]
Source: https://freestatistics.org/blog/index.php?pk=62649&T=1

Globally Unique Identifier (entire table): ba.freestatistics.org/blog/index.php?pk=62649&T=1

As an alternative you can also use a QR Code:  

The GUIDs for individual cells are displayed in the table below:

Autocorrelation Function
Time lag kACF(k)T-STATP-value
10.5416623.79160.000206
20.6344044.44082.6e-05
30.6886674.82077e-06
40.4113752.87960.002944
50.4133852.89370.002834
60.3862422.70370.0047
70.1730171.21110.115829
80.2166131.51630.067936
90.0805990.56420.287599
100.0496260.34740.364896
110.0725260.50770.306978
12-0.045937-0.32160.374577
130.0094040.06580.47389
140.0055340.03870.484628
15-0.043201-0.30240.38181
16-0.071463-0.50020.309572
17-0.002461-0.01720.493163
18-0.092116-0.64480.261028
19-0.095253-0.66680.254022
20-0.042749-0.29920.38301
21-0.115617-0.80930.211123
22-0.200366-1.40260.083526
23-0.026699-0.18690.426257
24-0.223632-1.56540.06196
25-0.160312-1.12220.133626
26-0.121284-0.8490.200008
27-0.23025-1.61170.05672
28-0.190716-1.3350.094021
29-0.172903-1.21030.11598
30-0.250831-1.75580.042684
31-0.189723-1.32810.095155
32-0.23557-1.6490.052774
33-0.246954-1.72870.045082
34-0.195329-1.36730.088885
35-0.258386-1.80870.038317
36-0.191868-1.34310.092718


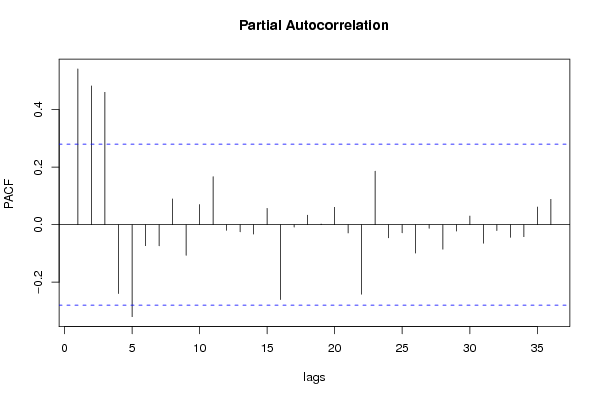
Partial Autocorrelation Function
Time lag kPACF(k)T-STATP-value
10.5416623.79160.000206
20.48263.37820.000719
30.4602413.22170.001133
4-0.239446-1.67610.050042
5-0.319859-2.2390.014864
6-0.073206-0.51240.305322
7-0.073657-0.51560.304227
80.0893660.62560.267252
9-0.106469-0.74530.22983
100.0700140.49010.313126
110.1670831.16960.123914
12-0.019572-0.1370.445796
13-0.024708-0.1730.431698
14-0.032677-0.22870.410011
150.0567410.39720.346478
16-0.260476-1.82330.037178
17-0.008358-0.05850.476792
180.032850.22990.409545
190.0021120.01480.494133
200.0602650.42190.337489
21-0.028736-0.20120.420705
22-0.241808-1.69270.048436
230.1862271.30360.099233
24-0.045469-0.31830.375811
25-0.028313-0.19820.421857
26-0.098735-0.69110.246368
27-0.012485-0.08740.465358
28-0.085409-0.59790.276341
29-0.022078-0.15450.438908
300.0300830.21060.417045
31-0.064155-0.44910.327675
32-0.020571-0.1440.443047
33-0.043935-0.30750.379867
34-0.041817-0.29270.385487
350.0612390.42870.335019
360.0881580.61710.27001

\begin{tabular}{lllllllll}
\hline
Partial Autocorrelation Function \tabularnewline
Time lag k & PACF(k) & T-STAT & P-value \tabularnewline
1 & 0.541662 & 3.7916 & 0.000206 \tabularnewline
2 & 0.4826 & 3.3782 & 0.000719 \tabularnewline
3 & 0.460241 & 3.2217 & 0.001133 \tabularnewline
4 & -0.239446 & -1.6761 & 0.050042 \tabularnewline
5 & -0.319859 & -2.239 & 0.014864 \tabularnewline
6 & -0.073206 & -0.5124 & 0.305322 \tabularnewline
7 & -0.073657 & -0.5156 & 0.304227 \tabularnewline
8 & 0.089366 & 0.6256 & 0.267252 \tabularnewline
9 & -0.106469 & -0.7453 & 0.22983 \tabularnewline
10 & 0.070014 & 0.4901 & 0.313126 \tabularnewline
11 & 0.167083 & 1.1696 & 0.123914 \tabularnewline
12 & -0.019572 & -0.137 & 0.445796 \tabularnewline
13 & -0.024708 & -0.173 & 0.431698 \tabularnewline
14 & -0.032677 & -0.2287 & 0.410011 \tabularnewline
15 & 0.056741 & 0.3972 & 0.346478 \tabularnewline
16 & -0.260476 & -1.8233 & 0.037178 \tabularnewline
17 & -0.008358 & -0.0585 & 0.476792 \tabularnewline
18 & 0.03285 & 0.2299 & 0.409545 \tabularnewline
19 & 0.002112 & 0.0148 & 0.494133 \tabularnewline
20 & 0.060265 & 0.4219 & 0.337489 \tabularnewline
21 & -0.028736 & -0.2012 & 0.420705 \tabularnewline
22 & -0.241808 & -1.6927 & 0.048436 \tabularnewline
23 & 0.186227 & 1.3036 & 0.099233 \tabularnewline
24 & -0.045469 & -0.3183 & 0.375811 \tabularnewline
25 & -0.028313 & -0.1982 & 0.421857 \tabularnewline
26 & -0.098735 & -0.6911 & 0.246368 \tabularnewline
27 & -0.012485 & -0.0874 & 0.465358 \tabularnewline
28 & -0.085409 & -0.5979 & 0.276341 \tabularnewline
29 & -0.022078 & -0.1545 & 0.438908 \tabularnewline
30 & 0.030083 & 0.2106 & 0.417045 \tabularnewline
31 & -0.064155 & -0.4491 & 0.327675 \tabularnewline
32 & -0.020571 & -0.144 & 0.443047 \tabularnewline
33 & -0.043935 & -0.3075 & 0.379867 \tabularnewline
34 & -0.041817 & -0.2927 & 0.385487 \tabularnewline
35 & 0.061239 & 0.4287 & 0.335019 \tabularnewline
36 & 0.088158 & 0.6171 & 0.27001 \tabularnewline
\hline
\end{tabular}
%Source: https://freestatistics.org/blog/index.php?pk=62649&T=2

[TABLE]
[ROW][C]Partial Autocorrelation Function[/C][/ROW]
[ROW][C]Time lag k[/C][C]PACF(k)[/C][C]T-STAT[/C][C]P-value[/C][/ROW]
[ROW][C]1[/C][C]0.541662[/C][C]3.7916[/C][C]0.000206[/C][/ROW]
[ROW][C]2[/C][C]0.4826[/C][C]3.3782[/C][C]0.000719[/C][/ROW]
[ROW][C]3[/C][C]0.460241[/C][C]3.2217[/C][C]0.001133[/C][/ROW]
[ROW][C]4[/C][C]-0.239446[/C][C]-1.6761[/C][C]0.050042[/C][/ROW]
[ROW][C]5[/C][C]-0.319859[/C][C]-2.239[/C][C]0.014864[/C][/ROW]
[ROW][C]6[/C][C]-0.073206[/C][C]-0.5124[/C][C]0.305322[/C][/ROW]
[ROW][C]7[/C][C]-0.073657[/C][C]-0.5156[/C][C]0.304227[/C][/ROW]
[ROW][C]8[/C][C]0.089366[/C][C]0.6256[/C][C]0.267252[/C][/ROW]
[ROW][C]9[/C][C]-0.106469[/C][C]-0.7453[/C][C]0.22983[/C][/ROW]
[ROW][C]10[/C][C]0.070014[/C][C]0.4901[/C][C]0.313126[/C][/ROW]
[ROW][C]11[/C][C]0.167083[/C][C]1.1696[/C][C]0.123914[/C][/ROW]
[ROW][C]12[/C][C]-0.019572[/C][C]-0.137[/C][C]0.445796[/C][/ROW]
[ROW][C]13[/C][C]-0.024708[/C][C]-0.173[/C][C]0.431698[/C][/ROW]
[ROW][C]14[/C][C]-0.032677[/C][C]-0.2287[/C][C]0.410011[/C][/ROW]
[ROW][C]15[/C][C]0.056741[/C][C]0.3972[/C][C]0.346478[/C][/ROW]
[ROW][C]16[/C][C]-0.260476[/C][C]-1.8233[/C][C]0.037178[/C][/ROW]
[ROW][C]17[/C][C]-0.008358[/C][C]-0.0585[/C][C]0.476792[/C][/ROW]
[ROW][C]18[/C][C]0.03285[/C][C]0.2299[/C][C]0.409545[/C][/ROW]
[ROW][C]19[/C][C]0.002112[/C][C]0.0148[/C][C]0.494133[/C][/ROW]
[ROW][C]20[/C][C]0.060265[/C][C]0.4219[/C][C]0.337489[/C][/ROW]
[ROW][C]21[/C][C]-0.028736[/C][C]-0.2012[/C][C]0.420705[/C][/ROW]
[ROW][C]22[/C][C]-0.241808[/C][C]-1.6927[/C][C]0.048436[/C][/ROW]
[ROW][C]23[/C][C]0.186227[/C][C]1.3036[/C][C]0.099233[/C][/ROW]
[ROW][C]24[/C][C]-0.045469[/C][C]-0.3183[/C][C]0.375811[/C][/ROW]
[ROW][C]25[/C][C]-0.028313[/C][C]-0.1982[/C][C]0.421857[/C][/ROW]
[ROW][C]26[/C][C]-0.098735[/C][C]-0.6911[/C][C]0.246368[/C][/ROW]
[ROW][C]27[/C][C]-0.012485[/C][C]-0.0874[/C][C]0.465358[/C][/ROW]
[ROW][C]28[/C][C]-0.085409[/C][C]-0.5979[/C][C]0.276341[/C][/ROW]
[ROW][C]29[/C][C]-0.022078[/C][C]-0.1545[/C][C]0.438908[/C][/ROW]
[ROW][C]30[/C][C]0.030083[/C][C]0.2106[/C][C]0.417045[/C][/ROW]
[ROW][C]31[/C][C]-0.064155[/C][C]-0.4491[/C][C]0.327675[/C][/ROW]
[ROW][C]32[/C][C]-0.020571[/C][C]-0.144[/C][C]0.443047[/C][/ROW]
[ROW][C]33[/C][C]-0.043935[/C][C]-0.3075[/C][C]0.379867[/C][/ROW]
[ROW][C]34[/C][C]-0.041817[/C][C]-0.2927[/C][C]0.385487[/C][/ROW]
[ROW][C]35[/C][C]0.061239[/C][C]0.4287[/C][C]0.335019[/C][/ROW]
[ROW][C]36[/C][C]0.088158[/C][C]0.6171[/C][C]0.27001[/C][/ROW]
[/TABLE]
Source: https://freestatistics.org/blog/index.php?pk=62649&T=2

Globally Unique Identifier (entire table): ba.freestatistics.org/blog/index.php?pk=62649&T=2

As an alternative you can also use a QR Code:  

The GUIDs for individual cells are displayed in the table below:

Partial Autocorrelation Function
Time lag kPACF(k)T-STATP-value
10.5416623.79160.000206
20.48263.37820.000719
30.4602413.22170.001133
4-0.239446-1.67610.050042
5-0.319859-2.2390.014864
6-0.073206-0.51240.305322
7-0.073657-0.51560.304227
80.0893660.62560.267252
9-0.106469-0.74530.22983
100.0700140.49010.313126
110.1670831.16960.123914
12-0.019572-0.1370.445796
13-0.024708-0.1730.431698
14-0.032677-0.22870.410011
150.0567410.39720.346478
16-0.260476-1.82330.037178
17-0.008358-0.05850.476792
180.032850.22990.409545
190.0021120.01480.494133
200.0602650.42190.337489
21-0.028736-0.20120.420705
22-0.241808-1.69270.048436
230.1862271.30360.099233
24-0.045469-0.31830.375811
25-0.028313-0.19820.421857
26-0.098735-0.69110.246368
27-0.012485-0.08740.465358
28-0.085409-0.59790.276341
29-0.022078-0.15450.438908
300.0300830.21060.417045
31-0.064155-0.44910.327675
32-0.020571-0.1440.443047
33-0.043935-0.30750.379867
34-0.041817-0.29270.385487
350.0612390.42870.335019
360.0881580.61710.27001


Parameters (Session):
par1 = 36 ; par2 = 1 ; par3 = 0 ; par4 = 1 ; par5 = 12 ; par6 = MA ; par7 = 0.95 ;
Parameters (R input):
par1 = 36 ; par2 = 1 ; par3 = 0 ; par4 = 1 ; par5 = 12 ; par6 = MA ; par7 = 0.95 ;
R code (references can be found in the software module):
if (par1 == 'Default') {
par1 = 10*log10(length(x))
} else {
par1 <- as.numeric(par1)
}
par2 <- as.numeric(par2)
par3 <- as.numeric(par3)
par4 <- as.numeric(par4)
par5 <- as.numeric(par5)
if (par6 == 'White Noise') par6 <- 'white' else par6 <- 'ma'
par7 <- as.numeric(par7)
if (par2 == 0) {
x <- log(x)
} else {
x <- (x ^ par2 - 1) / par2
}
if (par3 > 0) x <- diff(x,lag=1,difference=par3)
if (par4 > 0) x <- diff(x,lag=par5,difference=par4)
bitmap(file='pic1.png')
racf <- acf(x, par1, main='Autocorrelation', xlab='time lag', ylab='ACF', ci.type=par6, ci=par7, sub=paste('(lambda=',par2,', d=',par3,', D=',par4,', CI=', par7, ', CI type=',par6,')',sep=''))
dev.off()
bitmap(file='pic2.png')
rpacf <- pacf(x,par1,main='Partial Autocorrelation',xlab='lags',ylab='PACF')
dev.off()
(myacf <- c(racf$acf))
(mypacf <- c(rpacf$acf))
lengthx <- length(x)
sqrtn <- sqrt(lengthx)
load(file='createtable')
a<-table.start()
a<-table.row.start(a)
a<-table.element(a,'Autocorrelation Function',4,TRUE)
a<-table.row.end(a)
a<-table.row.start(a)
a<-table.element(a,'Time lag k',header=TRUE)
a<-table.element(a,hyperlink('basics.htm','ACF(k)','click here for more information about the Autocorrelation Function'),header=TRUE)
a<-table.element(a,'T-STAT',header=TRUE)
a<-table.element(a,'P-value',header=TRUE)
a<-table.row.end(a)
for (i in 2:(par1+1)) {
a<-table.row.start(a)
a<-table.element(a,i-1,header=TRUE)
a<-table.element(a,round(myacf[i],6))
mytstat <- myacf[i]*sqrtn
a<-table.element(a,round(mytstat,4))
a<-table.element(a,round(1-pt(abs(mytstat),lengthx),6))
a<-table.row.end(a)
}
a<-table.end(a)
table.save(a,file='mytable.tab')
a<-table.start()
a<-table.row.start(a)
a<-table.element(a,'Partial Autocorrelation Function',4,TRUE)
a<-table.row.end(a)
a<-table.row.start(a)
a<-table.element(a,'Time lag k',header=TRUE)
a<-table.element(a,hyperlink('basics.htm','PACF(k)','click here for more information about the Partial Autocorrelation Function'),header=TRUE)
a<-table.element(a,'T-STAT',header=TRUE)
a<-table.element(a,'P-value',header=TRUE)
a<-table.row.end(a)
for (i in 1:par1) {
a<-table.row.start(a)
a<-table.element(a,i,header=TRUE)
a<-table.element(a,round(mypacf[i],6))
mytstat <- mypacf[i]*sqrtn
a<-table.element(a,round(mytstat,4))
a<-table.element(a,round(1-pt(abs(mytstat),lengthx),6))
a<-table.row.end(a)
}
a<-table.end(a)
table.save(a,file='mytable1.tab')