Free Statistics

of Irreproducible Research!

Author's title

Author*The author of this computation has been verified*
R Software Modulerwasp_autocorrelation.wasp
Title produced by software(Partial) Autocorrelation Function
Date of computationThu, 03 Dec 2009 02:46:54 -0700
Cite this page as followsStatistical Computations at FreeStatistics.org, Office for Research Development and Education, URL https://freestatistics.org/blog/index.php?v=date/2009/Dec/03/t1259833672i6z7mto3g8z72o5.htm/, Retrieved Tue, 23 Apr 2024 14:04:33 +0000
Statistical Computations at FreeStatistics.org, Office for Research Development and Education, URL https://freestatistics.org/blog/index.php?pk=62650, Retrieved Tue, 23 Apr 2024 14:04:33 +0000
QR Codes:

Original text written by user:
IsPrivate?No (this computation is public)
User-defined keywords
Estimated Impact177
Family? (F = Feedback message, R = changed R code, M = changed R Module, P = changed Parameters, D = changed Data)
-       [(Partial) Autocorrelation Function] [] [2009-12-03 09:46:54] [fd7715938ba69fff5a3edaf7913b7ba1] [Current]
Feedback Forum

Post a new message
Dataseries X:
96.8
114.1
110.3
103.9
101.6
94.6
95.9
104.7
102.8
98.1
113.9
80.9
95.7
113.2
105.9
108.8
102.3
99
100.7
115.5
100.7
109.9
114.6
85.4
100.5
114.8
116.5
112.9
102
106
105.3
118.8
106.1
109.3
117.2
92.5
104.2
112.5
122.4
113.3
100
110.7
112.8
109.8
117.3
109.1
115.9
96
99.8
116.8
115.7
99.4
94.3
91
93.2
103.1
94.1
91.8
102.7
82.6
89.1


Summary of computational transaction
Raw Inputview raw input (R code)
Raw Outputview raw output of R engine
Computing time1 seconds
R Server'Gwilym Jenkins' @ 72.249.127.135

\begin{tabular}{lllllllll}
\hline
Summary of computational transaction \tabularnewline
Raw Input & view raw input (R code)  \tabularnewline
Raw Output & view raw output of R engine  \tabularnewline
Computing time & 1 seconds \tabularnewline
R Server & 'Gwilym Jenkins' @ 72.249.127.135 \tabularnewline
\hline
\end{tabular}
%Source: https://freestatistics.org/blog/index.php?pk=62650&T=0

[TABLE]
[ROW][C]Summary of computational transaction[/C][/ROW]
[ROW][C]Raw Input[/C][C]view raw input (R code) [/C][/ROW]
[ROW][C]Raw Output[/C][C]view raw output of R engine [/C][/ROW]
[ROW][C]Computing time[/C][C]1 seconds[/C][/ROW]
[ROW][C]R Server[/C][C]'Gwilym Jenkins' @ 72.249.127.135[/C][/ROW]
[/TABLE]
Source: https://freestatistics.org/blog/index.php?pk=62650&T=0

Globally Unique Identifier (entire table): ba.freestatistics.org/blog/index.php?pk=62650&T=0

As an alternative you can also use a QR Code:  

The GUIDs for individual cells are displayed in the table below:

Summary of computational transaction
Raw Inputview raw input (R code)
Raw Outputview raw output of R engine
Computing time1 seconds
R Server'Gwilym Jenkins' @ 72.249.127.135


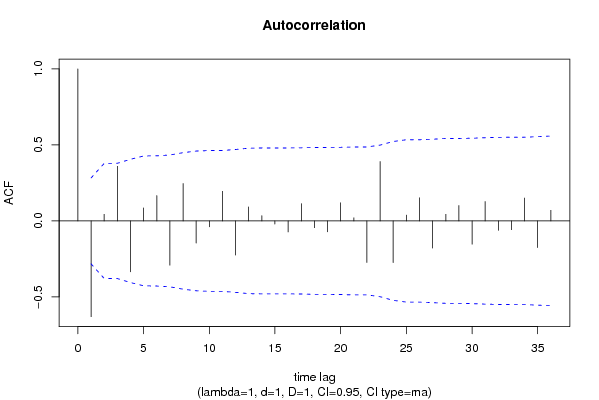
Autocorrelation Function
Time lag kACF(k)T-STATP-value
1-0.629956-4.36453.4e-05
20.0431280.29880.383192
30.3592852.48920.008161
4-0.335303-2.3230.01223
50.0852250.59050.278828
60.1664741.15340.127236
7-0.291164-2.01720.02464
80.2459391.70390.047432
9-0.145443-1.00770.159335
10-0.038916-0.26960.394304
110.1945591.34790.092002
12-0.224346-1.55430.063339
130.0917560.63570.263994
140.0347570.24080.405365
15-0.020438-0.14160.443994
16-0.072686-0.50360.30843
170.1130420.78320.218686
18-0.044675-0.30950.379133
19-0.071877-0.4980.310386
200.1190560.82480.20677
210.0204640.14180.443923
22-0.273164-1.89250.032229
230.3903422.70440.00472
24-0.274316-1.90050.03169
250.0381440.26430.396352
260.1521871.05440.148493
27-0.178257-1.2350.111421
280.0436640.30250.381783
290.1010390.70.243647
30-0.152766-1.05840.147586
310.1276520.88440.190445
32-0.062035-0.42980.334637
33-0.057745-0.40010.345441
340.150241.04090.15157
35-0.17503-1.21260.1156
360.0701170.48580.314665

\begin{tabular}{lllllllll}
\hline
Autocorrelation Function \tabularnewline
Time lag k & ACF(k) & T-STAT & P-value \tabularnewline
1 & -0.629956 & -4.3645 & 3.4e-05 \tabularnewline
2 & 0.043128 & 0.2988 & 0.383192 \tabularnewline
3 & 0.359285 & 2.4892 & 0.008161 \tabularnewline
4 & -0.335303 & -2.323 & 0.01223 \tabularnewline
5 & 0.085225 & 0.5905 & 0.278828 \tabularnewline
6 & 0.166474 & 1.1534 & 0.127236 \tabularnewline
7 & -0.291164 & -2.0172 & 0.02464 \tabularnewline
8 & 0.245939 & 1.7039 & 0.047432 \tabularnewline
9 & -0.145443 & -1.0077 & 0.159335 \tabularnewline
10 & -0.038916 & -0.2696 & 0.394304 \tabularnewline
11 & 0.194559 & 1.3479 & 0.092002 \tabularnewline
12 & -0.224346 & -1.5543 & 0.063339 \tabularnewline
13 & 0.091756 & 0.6357 & 0.263994 \tabularnewline
14 & 0.034757 & 0.2408 & 0.405365 \tabularnewline
15 & -0.020438 & -0.1416 & 0.443994 \tabularnewline
16 & -0.072686 & -0.5036 & 0.30843 \tabularnewline
17 & 0.113042 & 0.7832 & 0.218686 \tabularnewline
18 & -0.044675 & -0.3095 & 0.379133 \tabularnewline
19 & -0.071877 & -0.498 & 0.310386 \tabularnewline
20 & 0.119056 & 0.8248 & 0.20677 \tabularnewline
21 & 0.020464 & 0.1418 & 0.443923 \tabularnewline
22 & -0.273164 & -1.8925 & 0.032229 \tabularnewline
23 & 0.390342 & 2.7044 & 0.00472 \tabularnewline
24 & -0.274316 & -1.9005 & 0.03169 \tabularnewline
25 & 0.038144 & 0.2643 & 0.396352 \tabularnewline
26 & 0.152187 & 1.0544 & 0.148493 \tabularnewline
27 & -0.178257 & -1.235 & 0.111421 \tabularnewline
28 & 0.043664 & 0.3025 & 0.381783 \tabularnewline
29 & 0.101039 & 0.7 & 0.243647 \tabularnewline
30 & -0.152766 & -1.0584 & 0.147586 \tabularnewline
31 & 0.127652 & 0.8844 & 0.190445 \tabularnewline
32 & -0.062035 & -0.4298 & 0.334637 \tabularnewline
33 & -0.057745 & -0.4001 & 0.345441 \tabularnewline
34 & 0.15024 & 1.0409 & 0.15157 \tabularnewline
35 & -0.17503 & -1.2126 & 0.1156 \tabularnewline
36 & 0.070117 & 0.4858 & 0.314665 \tabularnewline
\hline
\end{tabular}
%Source: https://freestatistics.org/blog/index.php?pk=62650&T=1

[TABLE]
[ROW][C]Autocorrelation Function[/C][/ROW]
[ROW][C]Time lag k[/C][C]ACF(k)[/C][C]T-STAT[/C][C]P-value[/C][/ROW]
[ROW][C]1[/C][C]-0.629956[/C][C]-4.3645[/C][C]3.4e-05[/C][/ROW]
[ROW][C]2[/C][C]0.043128[/C][C]0.2988[/C][C]0.383192[/C][/ROW]
[ROW][C]3[/C][C]0.359285[/C][C]2.4892[/C][C]0.008161[/C][/ROW]
[ROW][C]4[/C][C]-0.335303[/C][C]-2.323[/C][C]0.01223[/C][/ROW]
[ROW][C]5[/C][C]0.085225[/C][C]0.5905[/C][C]0.278828[/C][/ROW]
[ROW][C]6[/C][C]0.166474[/C][C]1.1534[/C][C]0.127236[/C][/ROW]
[ROW][C]7[/C][C]-0.291164[/C][C]-2.0172[/C][C]0.02464[/C][/ROW]
[ROW][C]8[/C][C]0.245939[/C][C]1.7039[/C][C]0.047432[/C][/ROW]
[ROW][C]9[/C][C]-0.145443[/C][C]-1.0077[/C][C]0.159335[/C][/ROW]
[ROW][C]10[/C][C]-0.038916[/C][C]-0.2696[/C][C]0.394304[/C][/ROW]
[ROW][C]11[/C][C]0.194559[/C][C]1.3479[/C][C]0.092002[/C][/ROW]
[ROW][C]12[/C][C]-0.224346[/C][C]-1.5543[/C][C]0.063339[/C][/ROW]
[ROW][C]13[/C][C]0.091756[/C][C]0.6357[/C][C]0.263994[/C][/ROW]
[ROW][C]14[/C][C]0.034757[/C][C]0.2408[/C][C]0.405365[/C][/ROW]
[ROW][C]15[/C][C]-0.020438[/C][C]-0.1416[/C][C]0.443994[/C][/ROW]
[ROW][C]16[/C][C]-0.072686[/C][C]-0.5036[/C][C]0.30843[/C][/ROW]
[ROW][C]17[/C][C]0.113042[/C][C]0.7832[/C][C]0.218686[/C][/ROW]
[ROW][C]18[/C][C]-0.044675[/C][C]-0.3095[/C][C]0.379133[/C][/ROW]
[ROW][C]19[/C][C]-0.071877[/C][C]-0.498[/C][C]0.310386[/C][/ROW]
[ROW][C]20[/C][C]0.119056[/C][C]0.8248[/C][C]0.20677[/C][/ROW]
[ROW][C]21[/C][C]0.020464[/C][C]0.1418[/C][C]0.443923[/C][/ROW]
[ROW][C]22[/C][C]-0.273164[/C][C]-1.8925[/C][C]0.032229[/C][/ROW]
[ROW][C]23[/C][C]0.390342[/C][C]2.7044[/C][C]0.00472[/C][/ROW]
[ROW][C]24[/C][C]-0.274316[/C][C]-1.9005[/C][C]0.03169[/C][/ROW]
[ROW][C]25[/C][C]0.038144[/C][C]0.2643[/C][C]0.396352[/C][/ROW]
[ROW][C]26[/C][C]0.152187[/C][C]1.0544[/C][C]0.148493[/C][/ROW]
[ROW][C]27[/C][C]-0.178257[/C][C]-1.235[/C][C]0.111421[/C][/ROW]
[ROW][C]28[/C][C]0.043664[/C][C]0.3025[/C][C]0.381783[/C][/ROW]
[ROW][C]29[/C][C]0.101039[/C][C]0.7[/C][C]0.243647[/C][/ROW]
[ROW][C]30[/C][C]-0.152766[/C][C]-1.0584[/C][C]0.147586[/C][/ROW]
[ROW][C]31[/C][C]0.127652[/C][C]0.8844[/C][C]0.190445[/C][/ROW]
[ROW][C]32[/C][C]-0.062035[/C][C]-0.4298[/C][C]0.334637[/C][/ROW]
[ROW][C]33[/C][C]-0.057745[/C][C]-0.4001[/C][C]0.345441[/C][/ROW]
[ROW][C]34[/C][C]0.15024[/C][C]1.0409[/C][C]0.15157[/C][/ROW]
[ROW][C]35[/C][C]-0.17503[/C][C]-1.2126[/C][C]0.1156[/C][/ROW]
[ROW][C]36[/C][C]0.070117[/C][C]0.4858[/C][C]0.314665[/C][/ROW]
[/TABLE]
Source: https://freestatistics.org/blog/index.php?pk=62650&T=1

Globally Unique Identifier (entire table): ba.freestatistics.org/blog/index.php?pk=62650&T=1

As an alternative you can also use a QR Code:  

The GUIDs for individual cells are displayed in the table below:

Autocorrelation Function
Time lag kACF(k)T-STATP-value
1-0.629956-4.36453.4e-05
20.0431280.29880.383192
30.3592852.48920.008161
4-0.335303-2.3230.01223
50.0852250.59050.278828
60.1664741.15340.127236
7-0.291164-2.01720.02464
80.2459391.70390.047432
9-0.145443-1.00770.159335
10-0.038916-0.26960.394304
110.1945591.34790.092002
12-0.224346-1.55430.063339
130.0917560.63570.263994
140.0347570.24080.405365
15-0.020438-0.14160.443994
16-0.072686-0.50360.30843
170.1130420.78320.218686
18-0.044675-0.30950.379133
19-0.071877-0.4980.310386
200.1190560.82480.20677
210.0204640.14180.443923
22-0.273164-1.89250.032229
230.3903422.70440.00472
24-0.274316-1.90050.03169
250.0381440.26430.396352
260.1521871.05440.148493
27-0.178257-1.2350.111421
280.0436640.30250.381783
290.1010390.70.243647
30-0.152766-1.05840.147586
310.1276520.88440.190445
32-0.062035-0.42980.334637
33-0.057745-0.40010.345441
340.150241.04090.15157
35-0.17503-1.21260.1156
360.0701170.48580.314665


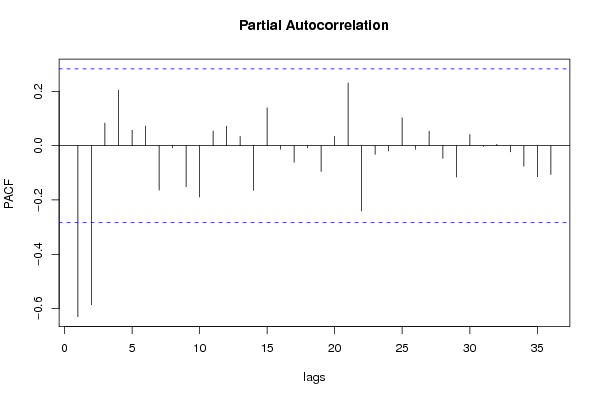
Partial Autocorrelation Function
Time lag kPACF(k)T-STATP-value
1-0.629956-4.36453.4e-05
2-0.586443-4.0638.9e-05
30.0832740.57690.283338
40.2045371.41710.08146
50.0570520.39530.347199
60.0723640.50140.309208
7-0.16334-1.13170.131701
8-0.007926-0.05490.478217
9-0.151098-1.04680.150209
10-0.188825-1.30820.098515
110.0540.37410.354979
120.0714550.49510.31141
130.0340240.23570.407324
14-0.164878-1.14230.129496
150.1395780.9670.16919
16-0.012789-0.08860.464882
17-0.06064-0.42010.338133
18-0.00746-0.05170.479498
19-0.094835-0.6570.257147
200.0342140.2370.406817
210.2307121.59840.058256
22-0.240732-1.66780.05093
23-0.031665-0.21940.413642
24-0.019417-0.13450.446774
250.102880.71280.239717
26-0.013281-0.0920.463536
270.0536950.3720.355761
28-0.046268-0.32060.374969
29-0.115432-0.79970.213903
300.0411970.28540.388276
31-0.002518-0.01740.493078
320.0049730.03450.48633
33-0.022701-0.15730.437844
34-0.07549-0.5230.301686
35-0.114383-0.79250.215993
36-0.105788-0.73290.233586

\begin{tabular}{lllllllll}
\hline
Partial Autocorrelation Function \tabularnewline
Time lag k & PACF(k) & T-STAT & P-value \tabularnewline
1 & -0.629956 & -4.3645 & 3.4e-05 \tabularnewline
2 & -0.586443 & -4.063 & 8.9e-05 \tabularnewline
3 & 0.083274 & 0.5769 & 0.283338 \tabularnewline
4 & 0.204537 & 1.4171 & 0.08146 \tabularnewline
5 & 0.057052 & 0.3953 & 0.347199 \tabularnewline
6 & 0.072364 & 0.5014 & 0.309208 \tabularnewline
7 & -0.16334 & -1.1317 & 0.131701 \tabularnewline
8 & -0.007926 & -0.0549 & 0.478217 \tabularnewline
9 & -0.151098 & -1.0468 & 0.150209 \tabularnewline
10 & -0.188825 & -1.3082 & 0.098515 \tabularnewline
11 & 0.054 & 0.3741 & 0.354979 \tabularnewline
12 & 0.071455 & 0.4951 & 0.31141 \tabularnewline
13 & 0.034024 & 0.2357 & 0.407324 \tabularnewline
14 & -0.164878 & -1.1423 & 0.129496 \tabularnewline
15 & 0.139578 & 0.967 & 0.16919 \tabularnewline
16 & -0.012789 & -0.0886 & 0.464882 \tabularnewline
17 & -0.06064 & -0.4201 & 0.338133 \tabularnewline
18 & -0.00746 & -0.0517 & 0.479498 \tabularnewline
19 & -0.094835 & -0.657 & 0.257147 \tabularnewline
20 & 0.034214 & 0.237 & 0.406817 \tabularnewline
21 & 0.230712 & 1.5984 & 0.058256 \tabularnewline
22 & -0.240732 & -1.6678 & 0.05093 \tabularnewline
23 & -0.031665 & -0.2194 & 0.413642 \tabularnewline
24 & -0.019417 & -0.1345 & 0.446774 \tabularnewline
25 & 0.10288 & 0.7128 & 0.239717 \tabularnewline
26 & -0.013281 & -0.092 & 0.463536 \tabularnewline
27 & 0.053695 & 0.372 & 0.355761 \tabularnewline
28 & -0.046268 & -0.3206 & 0.374969 \tabularnewline
29 & -0.115432 & -0.7997 & 0.213903 \tabularnewline
30 & 0.041197 & 0.2854 & 0.388276 \tabularnewline
31 & -0.002518 & -0.0174 & 0.493078 \tabularnewline
32 & 0.004973 & 0.0345 & 0.48633 \tabularnewline
33 & -0.022701 & -0.1573 & 0.437844 \tabularnewline
34 & -0.07549 & -0.523 & 0.301686 \tabularnewline
35 & -0.114383 & -0.7925 & 0.215993 \tabularnewline
36 & -0.105788 & -0.7329 & 0.233586 \tabularnewline
\hline
\end{tabular}
%Source: https://freestatistics.org/blog/index.php?pk=62650&T=2

[TABLE]
[ROW][C]Partial Autocorrelation Function[/C][/ROW]
[ROW][C]Time lag k[/C][C]PACF(k)[/C][C]T-STAT[/C][C]P-value[/C][/ROW]
[ROW][C]1[/C][C]-0.629956[/C][C]-4.3645[/C][C]3.4e-05[/C][/ROW]
[ROW][C]2[/C][C]-0.586443[/C][C]-4.063[/C][C]8.9e-05[/C][/ROW]
[ROW][C]3[/C][C]0.083274[/C][C]0.5769[/C][C]0.283338[/C][/ROW]
[ROW][C]4[/C][C]0.204537[/C][C]1.4171[/C][C]0.08146[/C][/ROW]
[ROW][C]5[/C][C]0.057052[/C][C]0.3953[/C][C]0.347199[/C][/ROW]
[ROW][C]6[/C][C]0.072364[/C][C]0.5014[/C][C]0.309208[/C][/ROW]
[ROW][C]7[/C][C]-0.16334[/C][C]-1.1317[/C][C]0.131701[/C][/ROW]
[ROW][C]8[/C][C]-0.007926[/C][C]-0.0549[/C][C]0.478217[/C][/ROW]
[ROW][C]9[/C][C]-0.151098[/C][C]-1.0468[/C][C]0.150209[/C][/ROW]
[ROW][C]10[/C][C]-0.188825[/C][C]-1.3082[/C][C]0.098515[/C][/ROW]
[ROW][C]11[/C][C]0.054[/C][C]0.3741[/C][C]0.354979[/C][/ROW]
[ROW][C]12[/C][C]0.071455[/C][C]0.4951[/C][C]0.31141[/C][/ROW]
[ROW][C]13[/C][C]0.034024[/C][C]0.2357[/C][C]0.407324[/C][/ROW]
[ROW][C]14[/C][C]-0.164878[/C][C]-1.1423[/C][C]0.129496[/C][/ROW]
[ROW][C]15[/C][C]0.139578[/C][C]0.967[/C][C]0.16919[/C][/ROW]
[ROW][C]16[/C][C]-0.012789[/C][C]-0.0886[/C][C]0.464882[/C][/ROW]
[ROW][C]17[/C][C]-0.06064[/C][C]-0.4201[/C][C]0.338133[/C][/ROW]
[ROW][C]18[/C][C]-0.00746[/C][C]-0.0517[/C][C]0.479498[/C][/ROW]
[ROW][C]19[/C][C]-0.094835[/C][C]-0.657[/C][C]0.257147[/C][/ROW]
[ROW][C]20[/C][C]0.034214[/C][C]0.237[/C][C]0.406817[/C][/ROW]
[ROW][C]21[/C][C]0.230712[/C][C]1.5984[/C][C]0.058256[/C][/ROW]
[ROW][C]22[/C][C]-0.240732[/C][C]-1.6678[/C][C]0.05093[/C][/ROW]
[ROW][C]23[/C][C]-0.031665[/C][C]-0.2194[/C][C]0.413642[/C][/ROW]
[ROW][C]24[/C][C]-0.019417[/C][C]-0.1345[/C][C]0.446774[/C][/ROW]
[ROW][C]25[/C][C]0.10288[/C][C]0.7128[/C][C]0.239717[/C][/ROW]
[ROW][C]26[/C][C]-0.013281[/C][C]-0.092[/C][C]0.463536[/C][/ROW]
[ROW][C]27[/C][C]0.053695[/C][C]0.372[/C][C]0.355761[/C][/ROW]
[ROW][C]28[/C][C]-0.046268[/C][C]-0.3206[/C][C]0.374969[/C][/ROW]
[ROW][C]29[/C][C]-0.115432[/C][C]-0.7997[/C][C]0.213903[/C][/ROW]
[ROW][C]30[/C][C]0.041197[/C][C]0.2854[/C][C]0.388276[/C][/ROW]
[ROW][C]31[/C][C]-0.002518[/C][C]-0.0174[/C][C]0.493078[/C][/ROW]
[ROW][C]32[/C][C]0.004973[/C][C]0.0345[/C][C]0.48633[/C][/ROW]
[ROW][C]33[/C][C]-0.022701[/C][C]-0.1573[/C][C]0.437844[/C][/ROW]
[ROW][C]34[/C][C]-0.07549[/C][C]-0.523[/C][C]0.301686[/C][/ROW]
[ROW][C]35[/C][C]-0.114383[/C][C]-0.7925[/C][C]0.215993[/C][/ROW]
[ROW][C]36[/C][C]-0.105788[/C][C]-0.7329[/C][C]0.233586[/C][/ROW]
[/TABLE]
Source: https://freestatistics.org/blog/index.php?pk=62650&T=2

Globally Unique Identifier (entire table): ba.freestatistics.org/blog/index.php?pk=62650&T=2

As an alternative you can also use a QR Code:  

The GUIDs for individual cells are displayed in the table below:

Partial Autocorrelation Function
Time lag kPACF(k)T-STATP-value
1-0.629956-4.36453.4e-05
2-0.586443-4.0638.9e-05
30.0832740.57690.283338
40.2045371.41710.08146
50.0570520.39530.347199
60.0723640.50140.309208
7-0.16334-1.13170.131701
8-0.007926-0.05490.478217
9-0.151098-1.04680.150209
10-0.188825-1.30820.098515
110.0540.37410.354979
120.0714550.49510.31141
130.0340240.23570.407324
14-0.164878-1.14230.129496
150.1395780.9670.16919
16-0.012789-0.08860.464882
17-0.06064-0.42010.338133
18-0.00746-0.05170.479498
19-0.094835-0.6570.257147
200.0342140.2370.406817
210.2307121.59840.058256
22-0.240732-1.66780.05093
23-0.031665-0.21940.413642
24-0.019417-0.13450.446774
250.102880.71280.239717
26-0.013281-0.0920.463536
270.0536950.3720.355761
28-0.046268-0.32060.374969
29-0.115432-0.79970.213903
300.0411970.28540.388276
31-0.002518-0.01740.493078
320.0049730.03450.48633
33-0.022701-0.15730.437844
34-0.07549-0.5230.301686
35-0.114383-0.79250.215993
36-0.105788-0.73290.233586


Parameters (Session):
par1 = 36 ; par2 = 1 ; par3 = 1 ; par4 = 1 ; par5 = 12 ; par6 = MA ; par7 = 0.95 ;
Parameters (R input):
par1 = 36 ; par2 = 1 ; par3 = 1 ; par4 = 1 ; par5 = 12 ; par6 = MA ; par7 = 0.95 ;
R code (references can be found in the software module):
if (par1 == 'Default') {
par1 = 10*log10(length(x))
} else {
par1 <- as.numeric(par1)
}
par2 <- as.numeric(par2)
par3 <- as.numeric(par3)
par4 <- as.numeric(par4)
par5 <- as.numeric(par5)
if (par6 == 'White Noise') par6 <- 'white' else par6 <- 'ma'
par7 <- as.numeric(par7)
if (par2 == 0) {
x <- log(x)
} else {
x <- (x ^ par2 - 1) / par2
}
if (par3 > 0) x <- diff(x,lag=1,difference=par3)
if (par4 > 0) x <- diff(x,lag=par5,difference=par4)
bitmap(file='pic1.png')
racf <- acf(x, par1, main='Autocorrelation', xlab='time lag', ylab='ACF', ci.type=par6, ci=par7, sub=paste('(lambda=',par2,', d=',par3,', D=',par4,', CI=', par7, ', CI type=',par6,')',sep=''))
dev.off()
bitmap(file='pic2.png')
rpacf <- pacf(x,par1,main='Partial Autocorrelation',xlab='lags',ylab='PACF')
dev.off()
(myacf <- c(racf$acf))
(mypacf <- c(rpacf$acf))
lengthx <- length(x)
sqrtn <- sqrt(lengthx)
load(file='createtable')
a<-table.start()
a<-table.row.start(a)
a<-table.element(a,'Autocorrelation Function',4,TRUE)
a<-table.row.end(a)
a<-table.row.start(a)
a<-table.element(a,'Time lag k',header=TRUE)
a<-table.element(a,hyperlink('basics.htm','ACF(k)','click here for more information about the Autocorrelation Function'),header=TRUE)
a<-table.element(a,'T-STAT',header=TRUE)
a<-table.element(a,'P-value',header=TRUE)
a<-table.row.end(a)
for (i in 2:(par1+1)) {
a<-table.row.start(a)
a<-table.element(a,i-1,header=TRUE)
a<-table.element(a,round(myacf[i],6))
mytstat <- myacf[i]*sqrtn
a<-table.element(a,round(mytstat,4))
a<-table.element(a,round(1-pt(abs(mytstat),lengthx),6))
a<-table.row.end(a)
}
a<-table.end(a)
table.save(a,file='mytable.tab')
a<-table.start()
a<-table.row.start(a)
a<-table.element(a,'Partial Autocorrelation Function',4,TRUE)
a<-table.row.end(a)
a<-table.row.start(a)
a<-table.element(a,'Time lag k',header=TRUE)
a<-table.element(a,hyperlink('basics.htm','PACF(k)','click here for more information about the Partial Autocorrelation Function'),header=TRUE)
a<-table.element(a,'T-STAT',header=TRUE)
a<-table.element(a,'P-value',header=TRUE)
a<-table.row.end(a)
for (i in 1:par1) {
a<-table.row.start(a)
a<-table.element(a,i,header=TRUE)
a<-table.element(a,round(mypacf[i],6))
mytstat <- mypacf[i]*sqrtn
a<-table.element(a,round(mytstat,4))
a<-table.element(a,round(1-pt(abs(mytstat),lengthx),6))
a<-table.row.end(a)
}
a<-table.end(a)
table.save(a,file='mytable1.tab')