Free Statistics

of Irreproducible Research!

Author's title

Author*The author of this computation has been verified*
R Software Modulerwasp_arimabackwardselection.wasp
Title produced by softwareARIMA Backward Selection
Date of computationThu, 03 Dec 2009 09:57:40 -0700
Cite this page as followsStatistical Computations at FreeStatistics.org, Office for Research Development and Education, URL https://freestatistics.org/blog/index.php?v=date/2009/Dec/03/t1259859704t3jvtku69olp8fd.htm/, Retrieved Tue, 16 Apr 2024 08:03:11 +0000
Statistical Computations at FreeStatistics.org, Office for Research Development and Education, URL https://freestatistics.org/blog/index.php?pk=62917, Retrieved Tue, 16 Apr 2024 08:03:11 +0000
QR Codes:

Original text written by user:
IsPrivate?No (this computation is public)
User-defined keywords
Estimated Impact170
Family? (F = Feedback message, R = changed R code, M = changed R Module, P = changed Parameters, D = changed Data)
-     [Univariate Data Series] [data set] [2008-12-01 19:54:57] [b98453cac15ba1066b407e146608df68]
- RMP   [ARIMA Backward Selection] [] [2009-11-27 14:53:14] [b98453cac15ba1066b407e146608df68]
- R PD      [ARIMA Backward Selection] [w] [2009-12-03 16:57:40] [950726a732ba3ca782ecb1a5307d0f6f] [Current]
- RMPD        [Univariate Explorative Data Analysis] [] [2009-12-08 08:53:18] [0750c128064677e728c9436fc3f45ae7]
-             [ARIMA Backward Selection] [] [2009-12-10 15:56:52] [315ba876df544ad397193b5931d5f354]
Feedback Forum

Post a new message
Dataseries X:
13132.1
17665.9
16913
17318.8
16224.2
15469.6
16557.5
19414.8
17335
16525.2
18160.4
15553.8
15262.2
18581
17564.1
18948.6
17187.8
17564.8
17668.4
20811.7
17257.8
18984.2
20532.6
17082.3
16894.9
20274.9
20078.6
19900.9
17012.2
19642.9
19024
21691
18835.9
19873.4
21468.2
19406.8
18385.3
20739.3
22268.3
21569
17514.8
21124.7
21251
21393
22145.2
20310.5
23466.9
21264.6
18388.1
22635.4
22014.3
18422.7
16120.2
16037.7
16410.7
17749.8
16349.8
15662.3
17782.3
16398.9


Summary of computational transaction
Raw Inputview raw input (R code)
Raw Outputview raw output of R engine
Computing time10 seconds
R Server'Gwilym Jenkins' @ 72.249.127.135

\begin{tabular}{lllllllll}
\hline
Summary of computational transaction \tabularnewline
Raw Input & view raw input (R code)  \tabularnewline
Raw Output & view raw output of R engine  \tabularnewline
Computing time & 10 seconds \tabularnewline
R Server & 'Gwilym Jenkins' @ 72.249.127.135 \tabularnewline
\hline
\end{tabular}
%Source: https://freestatistics.org/blog/index.php?pk=62917&T=0

[TABLE]
[ROW][C]Summary of computational transaction[/C][/ROW]
[ROW][C]Raw Input[/C][C]view raw input (R code) [/C][/ROW]
[ROW][C]Raw Output[/C][C]view raw output of R engine [/C][/ROW]
[ROW][C]Computing time[/C][C]10 seconds[/C][/ROW]
[ROW][C]R Server[/C][C]'Gwilym Jenkins' @ 72.249.127.135[/C][/ROW]
[/TABLE]
Source: https://freestatistics.org/blog/index.php?pk=62917&T=0

Globally Unique Identifier (entire table): ba.freestatistics.org/blog/index.php?pk=62917&T=0

As an alternative you can also use a QR Code:  

The GUIDs for individual cells are displayed in the table below:

Summary of computational transaction
Raw Inputview raw input (R code)
Raw Outputview raw output of R engine
Computing time10 seconds
R Server'Gwilym Jenkins' @ 72.249.127.135


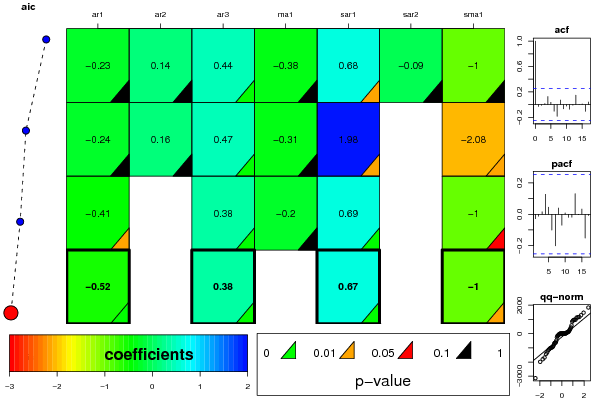
ARIMA Parameter Estimation and Backward Selection
Iterationar1ar2ar3ma1sar1sar2sma1
Estimates ( 1 )-0.22980.14420.439-0.3790.6766-0.0888-0.9994
(p-val)(0.4062 )(0.4718 )(0.0018 )(0.2205 )(0.0132 )(0.7374 )(0.1457 )
Estimates ( 2 )-0.24030.1580.4664-0.30781.98320-2.0759
(p-val)(0.3134 )(0.3745 )(5e-04 )(0.323 )(0.0395 )(NA )(0.0217 )
Estimates ( 3 )-0.405700.3834-0.20010.68610-1
(p-val)(0.038 )(NA )(0.002 )(0.3581 )(0.0084 )(NA )(0.0574 )
Estimates ( 4 )-0.523100.376100.67110-0.9999
(p-val)(0 )(NA )(9e-04 )(NA )(0.0066 )(NA )(0.0338 )
Estimates ( 5 )NANANANANANANA
(p-val)(NA )(NA )(NA )(NA )(NA )(NA )(NA )
Estimates ( 6 )NANANANANANANA
(p-val)(NA )(NA )(NA )(NA )(NA )(NA )(NA )
Estimates ( 7 )NANANANANANANA
(p-val)(NA )(NA )(NA )(NA )(NA )(NA )(NA )
Estimates ( 8 )NANANANANANANA
(p-val)(NA )(NA )(NA )(NA )(NA )(NA )(NA )
Estimates ( 9 )NANANANANANANA
(p-val)(NA )(NA )(NA )(NA )(NA )(NA )(NA )
Estimates ( 10 )NANANANANANANA
(p-val)(NA )(NA )(NA )(NA )(NA )(NA )(NA )
Estimates ( 11 )NANANANANANANA
(p-val)(NA )(NA )(NA )(NA )(NA )(NA )(NA )
Estimates ( 12 )NANANANANANANA
(p-val)(NA )(NA )(NA )(NA )(NA )(NA )(NA )
Estimates ( 13 )NANANANANANANA
(p-val)(NA )(NA )(NA )(NA )(NA )(NA )(NA )

\begin{tabular}{lllllllll}
\hline
ARIMA Parameter Estimation and Backward Selection \tabularnewline
Iteration & ar1 & ar2 & ar3 & ma1 & sar1 & sar2 & sma1 \tabularnewline
Estimates ( 1 ) & -0.2298 & 0.1442 & 0.439 & -0.379 & 0.6766 & -0.0888 & -0.9994 \tabularnewline
(p-val) & (0.4062 ) & (0.4718 ) & (0.0018 ) & (0.2205 ) & (0.0132 ) & (0.7374 ) & (0.1457 ) \tabularnewline
Estimates ( 2 ) & -0.2403 & 0.158 & 0.4664 & -0.3078 & 1.9832 & 0 & -2.0759 \tabularnewline
(p-val) & (0.3134 ) & (0.3745 ) & (5e-04 ) & (0.323 ) & (0.0395 ) & (NA ) & (0.0217 ) \tabularnewline
Estimates ( 3 ) & -0.4057 & 0 & 0.3834 & -0.2001 & 0.6861 & 0 & -1 \tabularnewline
(p-val) & (0.038 ) & (NA ) & (0.002 ) & (0.3581 ) & (0.0084 ) & (NA ) & (0.0574 ) \tabularnewline
Estimates ( 4 ) & -0.5231 & 0 & 0.3761 & 0 & 0.6711 & 0 & -0.9999 \tabularnewline
(p-val) & (0 ) & (NA ) & (9e-04 ) & (NA ) & (0.0066 ) & (NA ) & (0.0338 ) \tabularnewline
Estimates ( 5 ) & NA & NA & NA & NA & NA & NA & NA \tabularnewline
(p-val) & (NA ) & (NA ) & (NA ) & (NA ) & (NA ) & (NA ) & (NA ) \tabularnewline
Estimates ( 6 ) & NA & NA & NA & NA & NA & NA & NA \tabularnewline
(p-val) & (NA ) & (NA ) & (NA ) & (NA ) & (NA ) & (NA ) & (NA ) \tabularnewline
Estimates ( 7 ) & NA & NA & NA & NA & NA & NA & NA \tabularnewline
(p-val) & (NA ) & (NA ) & (NA ) & (NA ) & (NA ) & (NA ) & (NA ) \tabularnewline
Estimates ( 8 ) & NA & NA & NA & NA & NA & NA & NA \tabularnewline
(p-val) & (NA ) & (NA ) & (NA ) & (NA ) & (NA ) & (NA ) & (NA ) \tabularnewline
Estimates ( 9 ) & NA & NA & NA & NA & NA & NA & NA \tabularnewline
(p-val) & (NA ) & (NA ) & (NA ) & (NA ) & (NA ) & (NA ) & (NA ) \tabularnewline
Estimates ( 10 ) & NA & NA & NA & NA & NA & NA & NA \tabularnewline
(p-val) & (NA ) & (NA ) & (NA ) & (NA ) & (NA ) & (NA ) & (NA ) \tabularnewline
Estimates ( 11 ) & NA & NA & NA & NA & NA & NA & NA \tabularnewline
(p-val) & (NA ) & (NA ) & (NA ) & (NA ) & (NA ) & (NA ) & (NA ) \tabularnewline
Estimates ( 12 ) & NA & NA & NA & NA & NA & NA & NA \tabularnewline
(p-val) & (NA ) & (NA ) & (NA ) & (NA ) & (NA ) & (NA ) & (NA ) \tabularnewline
Estimates ( 13 ) & NA & NA & NA & NA & NA & NA & NA \tabularnewline
(p-val) & (NA ) & (NA ) & (NA ) & (NA ) & (NA ) & (NA ) & (NA ) \tabularnewline
\hline
\end{tabular}
%Source: https://freestatistics.org/blog/index.php?pk=62917&T=1

[TABLE]
[ROW][C]ARIMA Parameter Estimation and Backward Selection[/C][/ROW]
[ROW][C]Iteration[/C][C]ar1[/C][C]ar2[/C][C]ar3[/C][C]ma1[/C][C]sar1[/C][C]sar2[/C][C]sma1[/C][/ROW]
[ROW][C]Estimates ( 1 )[/C][C]-0.2298[/C][C]0.1442[/C][C]0.439[/C][C]-0.379[/C][C]0.6766[/C][C]-0.0888[/C][C]-0.9994[/C][/ROW]
[ROW][C](p-val)[/C][C](0.4062 )[/C][C](0.4718 )[/C][C](0.0018 )[/C][C](0.2205 )[/C][C](0.0132 )[/C][C](0.7374 )[/C][C](0.1457 )[/C][/ROW]
[ROW][C]Estimates ( 2 )[/C][C]-0.2403[/C][C]0.158[/C][C]0.4664[/C][C]-0.3078[/C][C]1.9832[/C][C]0[/C][C]-2.0759[/C][/ROW]
[ROW][C](p-val)[/C][C](0.3134 )[/C][C](0.3745 )[/C][C](5e-04 )[/C][C](0.323 )[/C][C](0.0395 )[/C][C](NA )[/C][C](0.0217 )[/C][/ROW]
[ROW][C]Estimates ( 3 )[/C][C]-0.4057[/C][C]0[/C][C]0.3834[/C][C]-0.2001[/C][C]0.6861[/C][C]0[/C][C]-1[/C][/ROW]
[ROW][C](p-val)[/C][C](0.038 )[/C][C](NA )[/C][C](0.002 )[/C][C](0.3581 )[/C][C](0.0084 )[/C][C](NA )[/C][C](0.0574 )[/C][/ROW]
[ROW][C]Estimates ( 4 )[/C][C]-0.5231[/C][C]0[/C][C]0.3761[/C][C]0[/C][C]0.6711[/C][C]0[/C][C]-0.9999[/C][/ROW]
[ROW][C](p-val)[/C][C](0 )[/C][C](NA )[/C][C](9e-04 )[/C][C](NA )[/C][C](0.0066 )[/C][C](NA )[/C][C](0.0338 )[/C][/ROW]
[ROW][C]Estimates ( 5 )[/C][C]NA[/C][C]NA[/C][C]NA[/C][C]NA[/C][C]NA[/C][C]NA[/C][C]NA[/C][/ROW]
[ROW][C](p-val)[/C][C](NA )[/C][C](NA )[/C][C](NA )[/C][C](NA )[/C][C](NA )[/C][C](NA )[/C][C](NA )[/C][/ROW]
[ROW][C]Estimates ( 6 )[/C][C]NA[/C][C]NA[/C][C]NA[/C][C]NA[/C][C]NA[/C][C]NA[/C][C]NA[/C][/ROW]
[ROW][C](p-val)[/C][C](NA )[/C][C](NA )[/C][C](NA )[/C][C](NA )[/C][C](NA )[/C][C](NA )[/C][C](NA )[/C][/ROW]
[ROW][C]Estimates ( 7 )[/C][C]NA[/C][C]NA[/C][C]NA[/C][C]NA[/C][C]NA[/C][C]NA[/C][C]NA[/C][/ROW]
[ROW][C](p-val)[/C][C](NA )[/C][C](NA )[/C][C](NA )[/C][C](NA )[/C][C](NA )[/C][C](NA )[/C][C](NA )[/C][/ROW]
[ROW][C]Estimates ( 8 )[/C][C]NA[/C][C]NA[/C][C]NA[/C][C]NA[/C][C]NA[/C][C]NA[/C][C]NA[/C][/ROW]
[ROW][C](p-val)[/C][C](NA )[/C][C](NA )[/C][C](NA )[/C][C](NA )[/C][C](NA )[/C][C](NA )[/C][C](NA )[/C][/ROW]
[ROW][C]Estimates ( 9 )[/C][C]NA[/C][C]NA[/C][C]NA[/C][C]NA[/C][C]NA[/C][C]NA[/C][C]NA[/C][/ROW]
[ROW][C](p-val)[/C][C](NA )[/C][C](NA )[/C][C](NA )[/C][C](NA )[/C][C](NA )[/C][C](NA )[/C][C](NA )[/C][/ROW]
[ROW][C]Estimates ( 10 )[/C][C]NA[/C][C]NA[/C][C]NA[/C][C]NA[/C][C]NA[/C][C]NA[/C][C]NA[/C][/ROW]
[ROW][C](p-val)[/C][C](NA )[/C][C](NA )[/C][C](NA )[/C][C](NA )[/C][C](NA )[/C][C](NA )[/C][C](NA )[/C][/ROW]
[ROW][C]Estimates ( 11 )[/C][C]NA[/C][C]NA[/C][C]NA[/C][C]NA[/C][C]NA[/C][C]NA[/C][C]NA[/C][/ROW]
[ROW][C](p-val)[/C][C](NA )[/C][C](NA )[/C][C](NA )[/C][C](NA )[/C][C](NA )[/C][C](NA )[/C][C](NA )[/C][/ROW]
[ROW][C]Estimates ( 12 )[/C][C]NA[/C][C]NA[/C][C]NA[/C][C]NA[/C][C]NA[/C][C]NA[/C][C]NA[/C][/ROW]
[ROW][C](p-val)[/C][C](NA )[/C][C](NA )[/C][C](NA )[/C][C](NA )[/C][C](NA )[/C][C](NA )[/C][C](NA )[/C][/ROW]
[ROW][C]Estimates ( 13 )[/C][C]NA[/C][C]NA[/C][C]NA[/C][C]NA[/C][C]NA[/C][C]NA[/C][C]NA[/C][/ROW]
[ROW][C](p-val)[/C][C](NA )[/C][C](NA )[/C][C](NA )[/C][C](NA )[/C][C](NA )[/C][C](NA )[/C][C](NA )[/C][/ROW]
[/TABLE]
Source: https://freestatistics.org/blog/index.php?pk=62917&T=1

Globally Unique Identifier (entire table): ba.freestatistics.org/blog/index.php?pk=62917&T=1

As an alternative you can also use a QR Code:  

The GUIDs for individual cells are displayed in the table below:

ARIMA Parameter Estimation and Backward Selection
Iterationar1ar2ar3ma1sar1sar2sma1
Estimates ( 1 )-0.22980.14420.439-0.3790.6766-0.0888-0.9994
(p-val)(0.4062 )(0.4718 )(0.0018 )(0.2205 )(0.0132 )(0.7374 )(0.1457 )
Estimates ( 2 )-0.24030.1580.4664-0.30781.98320-2.0759
(p-val)(0.3134 )(0.3745 )(5e-04 )(0.323 )(0.0395 )(NA )(0.0217 )
Estimates ( 3 )-0.405700.3834-0.20010.68610-1
(p-val)(0.038 )(NA )(0.002 )(0.3581 )(0.0084 )(NA )(0.0574 )
Estimates ( 4 )-0.523100.376100.67110-0.9999
(p-val)(0 )(NA )(9e-04 )(NA )(0.0066 )(NA )(0.0338 )
Estimates ( 5 )NANANANANANANA
(p-val)(NA )(NA )(NA )(NA )(NA )(NA )(NA )
Estimates ( 6 )NANANANANANANA
(p-val)(NA )(NA )(NA )(NA )(NA )(NA )(NA )
Estimates ( 7 )NANANANANANANA
(p-val)(NA )(NA )(NA )(NA )(NA )(NA )(NA )
Estimates ( 8 )NANANANANANANA
(p-val)(NA )(NA )(NA )(NA )(NA )(NA )(NA )
Estimates ( 9 )NANANANANANANA
(p-val)(NA )(NA )(NA )(NA )(NA )(NA )(NA )
Estimates ( 10 )NANANANANANANA
(p-val)(NA )(NA )(NA )(NA )(NA )(NA )(NA )
Estimates ( 11 )NANANANANANANA
(p-val)(NA )(NA )(NA )(NA )(NA )(NA )(NA )
Estimates ( 12 )NANANANANANANA
(p-val)(NA )(NA )(NA )(NA )(NA )(NA )(NA )
Estimates ( 13 )NANANANANANANA
(p-val)(NA )(NA )(NA )(NA )(NA )(NA )(NA )


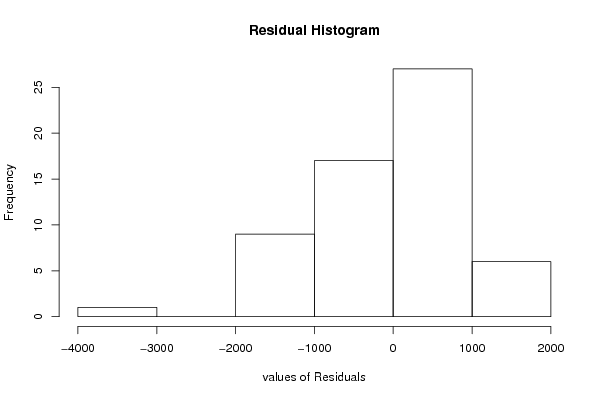
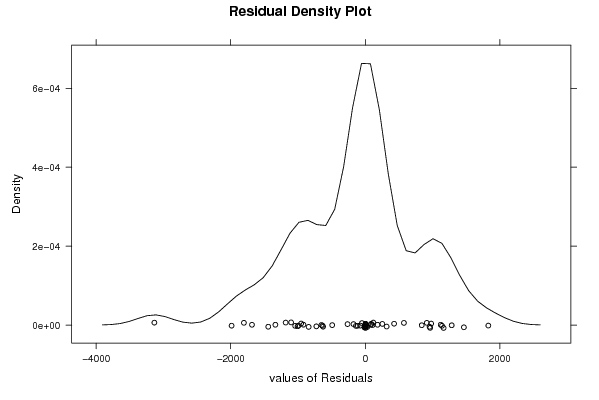
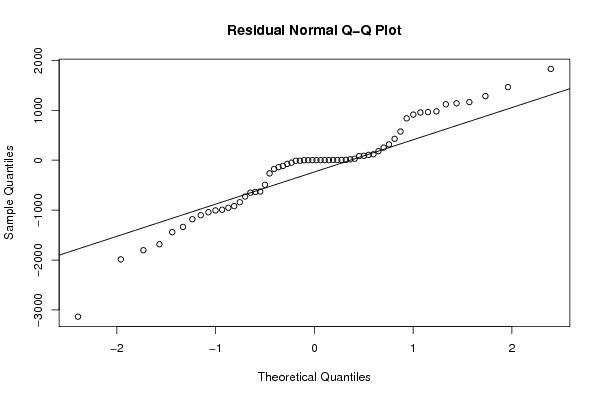
Estimated ARIMA Residuals
Value
-49.322828262324
-841.66209156776
-727.138222004516
318.026077493937
253.450373319417
914.6690802553
-635.276292032055
18.0104106800424
-1684.42027804526
1829.79157926934
1122.02445633161
-138.587741605063
-1041.88960144429
-174.907981333737
956.760753251256
-918.740049654111
-1804.14307157093
1140.97980241613
840.002279017665
-115.034398254958
-650.674450093417
120.238789014336
88.3004548450432
979.982585943062
83.8113224085503
-1336.40521059876
575.216211739258
428.974795971089
-1102.49592665084
-10.8328456558884
1285.10948100341
-1442.00329332823
1466.60139244046
-992.17610284964
1164.86436419996
-491.534729461495
-952.888440766142
30.7346494726848
-1006.00288970113
-3135.28886696298
-1183.14704042821
-1987.38722599841
-263.359999344463
183.030727592036
-73.5610082898233
108.178427374789
-626.86957318685
965.255827019708

\begin{tabular}{lllllllll}
\hline
Estimated ARIMA Residuals \tabularnewline
Value \tabularnewline
-49.322828262324 \tabularnewline
-841.66209156776 \tabularnewline
-727.138222004516 \tabularnewline
318.026077493937 \tabularnewline
253.450373319417 \tabularnewline
914.6690802553 \tabularnewline
-635.276292032055 \tabularnewline
18.0104106800424 \tabularnewline
-1684.42027804526 \tabularnewline
1829.79157926934 \tabularnewline
1122.02445633161 \tabularnewline
-138.587741605063 \tabularnewline
-1041.88960144429 \tabularnewline
-174.907981333737 \tabularnewline
956.760753251256 \tabularnewline
-918.740049654111 \tabularnewline
-1804.14307157093 \tabularnewline
1140.97980241613 \tabularnewline
840.002279017665 \tabularnewline
-115.034398254958 \tabularnewline
-650.674450093417 \tabularnewline
120.238789014336 \tabularnewline
88.3004548450432 \tabularnewline
979.982585943062 \tabularnewline
83.8113224085503 \tabularnewline
-1336.40521059876 \tabularnewline
575.216211739258 \tabularnewline
428.974795971089 \tabularnewline
-1102.49592665084 \tabularnewline
-10.8328456558884 \tabularnewline
1285.10948100341 \tabularnewline
-1442.00329332823 \tabularnewline
1466.60139244046 \tabularnewline
-992.17610284964 \tabularnewline
1164.86436419996 \tabularnewline
-491.534729461495 \tabularnewline
-952.888440766142 \tabularnewline
30.7346494726848 \tabularnewline
-1006.00288970113 \tabularnewline
-3135.28886696298 \tabularnewline
-1183.14704042821 \tabularnewline
-1987.38722599841 \tabularnewline
-263.359999344463 \tabularnewline
183.030727592036 \tabularnewline
-73.5610082898233 \tabularnewline
108.178427374789 \tabularnewline
-626.86957318685 \tabularnewline
965.255827019708 \tabularnewline
\hline
\end{tabular}
%Source: https://freestatistics.org/blog/index.php?pk=62917&T=2

[TABLE]
[ROW][C]Estimated ARIMA Residuals[/C][/ROW]
[ROW][C]Value[/C][/ROW]
[ROW][C]-49.322828262324[/C][/ROW]
[ROW][C]-841.66209156776[/C][/ROW]
[ROW][C]-727.138222004516[/C][/ROW]
[ROW][C]318.026077493937[/C][/ROW]
[ROW][C]253.450373319417[/C][/ROW]
[ROW][C]914.6690802553[/C][/ROW]
[ROW][C]-635.276292032055[/C][/ROW]
[ROW][C]18.0104106800424[/C][/ROW]
[ROW][C]-1684.42027804526[/C][/ROW]
[ROW][C]1829.79157926934[/C][/ROW]
[ROW][C]1122.02445633161[/C][/ROW]
[ROW][C]-138.587741605063[/C][/ROW]
[ROW][C]-1041.88960144429[/C][/ROW]
[ROW][C]-174.907981333737[/C][/ROW]
[ROW][C]956.760753251256[/C][/ROW]
[ROW][C]-918.740049654111[/C][/ROW]
[ROW][C]-1804.14307157093[/C][/ROW]
[ROW][C]1140.97980241613[/C][/ROW]
[ROW][C]840.002279017665[/C][/ROW]
[ROW][C]-115.034398254958[/C][/ROW]
[ROW][C]-650.674450093417[/C][/ROW]
[ROW][C]120.238789014336[/C][/ROW]
[ROW][C]88.3004548450432[/C][/ROW]
[ROW][C]979.982585943062[/C][/ROW]
[ROW][C]83.8113224085503[/C][/ROW]
[ROW][C]-1336.40521059876[/C][/ROW]
[ROW][C]575.216211739258[/C][/ROW]
[ROW][C]428.974795971089[/C][/ROW]
[ROW][C]-1102.49592665084[/C][/ROW]
[ROW][C]-10.8328456558884[/C][/ROW]
[ROW][C]1285.10948100341[/C][/ROW]
[ROW][C]-1442.00329332823[/C][/ROW]
[ROW][C]1466.60139244046[/C][/ROW]
[ROW][C]-992.17610284964[/C][/ROW]
[ROW][C]1164.86436419996[/C][/ROW]
[ROW][C]-491.534729461495[/C][/ROW]
[ROW][C]-952.888440766142[/C][/ROW]
[ROW][C]30.7346494726848[/C][/ROW]
[ROW][C]-1006.00288970113[/C][/ROW]
[ROW][C]-3135.28886696298[/C][/ROW]
[ROW][C]-1183.14704042821[/C][/ROW]
[ROW][C]-1987.38722599841[/C][/ROW]
[ROW][C]-263.359999344463[/C][/ROW]
[ROW][C]183.030727592036[/C][/ROW]
[ROW][C]-73.5610082898233[/C][/ROW]
[ROW][C]108.178427374789[/C][/ROW]
[ROW][C]-626.86957318685[/C][/ROW]
[ROW][C]965.255827019708[/C][/ROW]
[/TABLE]
Source: https://freestatistics.org/blog/index.php?pk=62917&T=2

Globally Unique Identifier (entire table): ba.freestatistics.org/blog/index.php?pk=62917&T=2

As an alternative you can also use a QR Code:  

The GUIDs for individual cells are displayed in the table below:

Estimated ARIMA Residuals
Value
-49.322828262324
-841.66209156776
-727.138222004516
318.026077493937
253.450373319417
914.6690802553
-635.276292032055
18.0104106800424
-1684.42027804526
1829.79157926934
1122.02445633161
-138.587741605063
-1041.88960144429
-174.907981333737
956.760753251256
-918.740049654111
-1804.14307157093
1140.97980241613
840.002279017665
-115.034398254958
-650.674450093417
120.238789014336
88.3004548450432
979.982585943062
83.8113224085503
-1336.40521059876
575.216211739258
428.974795971089
-1102.49592665084
-10.8328456558884
1285.10948100341
-1442.00329332823
1466.60139244046
-992.17610284964
1164.86436419996
-491.534729461495
-952.888440766142
30.7346494726848
-1006.00288970113
-3135.28886696298
-1183.14704042821
-1987.38722599841
-263.359999344463
183.030727592036
-73.5610082898233
108.178427374789
-626.86957318685
965.255827019708


Parameters (Session):
par1 = FALSE ; par2 = 1 ; par3 = 1 ; par4 = 1 ; par5 = 12 ; par6 = 3 ; par7 = 1 ; par8 = 2 ; par9 = 1 ;
Parameters (R input):
par1 = FALSE ; par2 = 1 ; par3 = 1 ; par4 = 1 ; par5 = 12 ; par6 = 3 ; par7 = 1 ; par8 = 2 ; par9 = 1 ;
R code (references can be found in the software module):
library(lattice)
if (par1 == 'TRUE') par1 <- TRUE
if (par1 == 'FALSE') par1 <- FALSE
par2 <- as.numeric(par2) #Box-Cox lambda transformation parameter
par3 <- as.numeric(par3) #degree of non-seasonal differencing
par4 <- as.numeric(par4) #degree of seasonal differencing
par5 <- as.numeric(par5) #seasonal period
par6 <- as.numeric(par6) #degree (p) of the non-seasonal AR(p) polynomial
par7 <- as.numeric(par7) #degree (q) of the non-seasonal MA(q) polynomial
par8 <- as.numeric(par8) #degree (P) of the seasonal AR(P) polynomial
par9 <- as.numeric(par9) #degree (Q) of the seasonal MA(Q) polynomial
armaGR <- function(arima.out, names, n){
try1 <- arima.out$coef
try2 <- sqrt(diag(arima.out$var.coef))
try.data.frame <- data.frame(matrix(NA,ncol=4,nrow=length(names)))
dimnames(try.data.frame) <- list(names,c('coef','std','tstat','pv'))
try.data.frame[,1] <- try1
for(i in 1:length(try2)) try.data.frame[which(rownames(try.data.frame)==names(try2)[i]),2] <- try2[i]
try.data.frame[,3] <- try.data.frame[,1] / try.data.frame[,2]
try.data.frame[,4] <- round((1-pt(abs(try.data.frame[,3]),df=n-(length(try2)+1)))*2,5)
vector <- rep(NA,length(names))
vector[is.na(try.data.frame[,4])] <- 0
maxi <- which.max(try.data.frame[,4])
continue <- max(try.data.frame[,4],na.rm=TRUE) > .05
vector[maxi] <- 0
list(summary=try.data.frame,next.vector=vector,continue=continue)
}
arimaSelect <- function(series, order=c(13,0,0), seasonal=list(order=c(2,0,0),period=12), include.mean=F){
nrc <- order[1]+order[3]+seasonal$order[1]+seasonal$order[3]
coeff <- matrix(NA, nrow=nrc*2, ncol=nrc)
pval <- matrix(NA, nrow=nrc*2, ncol=nrc)
mylist <- rep(list(NULL), nrc)
names <- NULL
if(order[1] > 0) names <- paste('ar',1:order[1],sep='')
if(order[3] > 0) names <- c( names , paste('ma',1:order[3],sep='') )
if(seasonal$order[1] > 0) names <- c(names, paste('sar',1:seasonal$order[1],sep=''))
if(seasonal$order[3] > 0) names <- c(names, paste('sma',1:seasonal$order[3],sep=''))
arima.out <- arima(series, order=order, seasonal=seasonal, include.mean=include.mean, method='ML')
mylist[[1]] <- arima.out
last.arma <- armaGR(arima.out, names, length(series))
mystop <- FALSE
i <- 1
coeff[i,] <- last.arma[[1]][,1]
pval [i,] <- last.arma[[1]][,4]
i <- 2
aic <- arima.out$aic
while(!mystop){
mylist[[i]] <- arima.out
arima.out <- arima(series, order=order, seasonal=seasonal, include.mean=include.mean, method='ML', fixed=last.arma$next.vector)
aic <- c(aic, arima.out$aic)
last.arma <- armaGR(arima.out, names, length(series))
mystop <- !last.arma$continue
coeff[i,] <- last.arma[[1]][,1]
pval [i,] <- last.arma[[1]][,4]
i <- i+1
}
list(coeff, pval, mylist, aic=aic)
}
arimaSelectplot <- function(arimaSelect.out,noms,choix){
noms <- names(arimaSelect.out[[3]][[1]]$coef)
coeff <- arimaSelect.out[[1]]
k <- min(which(is.na(coeff[,1])))-1
coeff <- coeff[1:k,]
pval <- arimaSelect.out[[2]][1:k,]
aic <- arimaSelect.out$aic[1:k]
coeff[coeff==0] <- NA
n <- ncol(coeff)
if(missing(choix)) choix <- k
layout(matrix(c(1,1,1,2,
3,3,3,2,
3,3,3,4,
5,6,7,7),nr=4),
widths=c(10,35,45,15),
heights=c(30,30,15,15))
couleurs <- rainbow(75)[1:50]#(50)
ticks <- pretty(coeff)
par(mar=c(1,1,3,1))
plot(aic,k:1-.5,type='o',pch=21,bg='blue',cex=2,axes=F,lty=2,xpd=NA)
points(aic[choix],k-choix+.5,pch=21,cex=4,bg=2,xpd=NA)
title('aic',line=2)
par(mar=c(3,0,0,0))
plot(0,axes=F,xlab='',ylab='',xlim=range(ticks),ylim=c(.1,1))
rect(xleft = min(ticks) + (0:49)/50*(max(ticks)-min(ticks)),
xright = min(ticks) + (1:50)/50*(max(ticks)-min(ticks)),
ytop = rep(1,50),
ybottom= rep(0,50),col=couleurs,border=NA)
axis(1,ticks)
rect(xleft=min(ticks),xright=max(ticks),ytop=1,ybottom=0)
text(mean(coeff,na.rm=T),.5,'coefficients',cex=2,font=2)
par(mar=c(1,1,3,1))
image(1:n,1:k,t(coeff[k:1,]),axes=F,col=couleurs,zlim=range(ticks))
for(i in 1:n) for(j in 1:k) if(!is.na(coeff[j,i])) {
if(pval[j,i]<.01) symb = 'green'
else if( (pval[j,i]<.05) & (pval[j,i]>=.01)) symb = 'orange'
else if( (pval[j,i]<.1) & (pval[j,i]>=.05)) symb = 'red'
else symb = 'black'
polygon(c(i+.5 ,i+.2 ,i+.5 ,i+.5),
c(k-j+0.5,k-j+0.5,k-j+0.8,k-j+0.5),
col=symb)
if(j==choix) {
rect(xleft=i-.5,
xright=i+.5,
ybottom=k-j+1.5,
ytop=k-j+.5,
lwd=4)
text(i,
k-j+1,
round(coeff[j,i],2),
cex=1.2,
font=2)
}
else{
rect(xleft=i-.5,xright=i+.5,ybottom=k-j+1.5,ytop=k-j+.5)
text(i,k-j+1,round(coeff[j,i],2),cex=1.2,font=1)
}
}
axis(3,1:n,noms)
par(mar=c(0.5,0,0,0.5))
plot(0,axes=F,xlab='',ylab='',type='n',xlim=c(0,8),ylim=c(-.2,.8))
cols <- c('green','orange','red','black')
niv <- c('0','0.01','0.05','0.1')
for(i in 0:3){
polygon(c(1+2*i ,1+2*i ,1+2*i-.5 ,1+2*i),
c(.4 ,.7 , .4 , .4),
col=cols[i+1])
text(2*i,0.5,niv[i+1],cex=1.5)
}
text(8,.5,1,cex=1.5)
text(4,0,'p-value',cex=2)
box()
residus <- arimaSelect.out[[3]][[choix]]$res
par(mar=c(1,2,4,1))
acf(residus,main='')
title('acf',line=.5)
par(mar=c(1,2,4,1))
pacf(residus,main='')
title('pacf',line=.5)
par(mar=c(2,2,4,1))
qqnorm(residus,main='')
title('qq-norm',line=.5)
qqline(residus)
residus
}
if (par2 == 0) x <- log(x)
if (par2 != 0) x <- x^par2
(selection <- arimaSelect(x, order=c(par6,par3,par7), seasonal=list(order=c(par8,par4,par9), period=par5)))
bitmap(file='test1.png')
resid <- arimaSelectplot(selection)
dev.off()
resid
bitmap(file='test2.png')
acf(resid,length(resid)/2, main='Residual Autocorrelation Function')
dev.off()
bitmap(file='test3.png')
pacf(resid,length(resid)/2, main='Residual Partial Autocorrelation Function')
dev.off()
bitmap(file='test4.png')
cpgram(resid, main='Residual Cumulative Periodogram')
dev.off()
bitmap(file='test5.png')
hist(resid, main='Residual Histogram', xlab='values of Residuals')
dev.off()
bitmap(file='test6.png')
densityplot(~resid,col='black',main='Residual Density Plot', xlab='values of Residuals')
dev.off()
bitmap(file='test7.png')
qqnorm(resid, main='Residual Normal Q-Q Plot')
qqline(resid)
dev.off()
ncols <- length(selection[[1]][1,])
nrows <- length(selection[[2]][,1])-1
load(file='createtable')
a<-table.start()
a<-table.row.start(a)
a<-table.element(a,'ARIMA Parameter Estimation and Backward Selection', ncols+1,TRUE)
a<-table.row.end(a)
a<-table.row.start(a)
a<-table.element(a,'Iteration', header=TRUE)
for (i in 1:ncols) {
a<-table.element(a,names(selection[[3]][[1]]$coef)[i],header=TRUE)
}
a<-table.row.end(a)
for (j in 1:nrows) {
a<-table.row.start(a)
mydum <- 'Estimates ('
mydum <- paste(mydum,j)
mydum <- paste(mydum,')')
a<-table.element(a,mydum, header=TRUE)
for (i in 1:ncols) {
a<-table.element(a,round(selection[[1]][j,i],4))
}
a<-table.row.end(a)
a<-table.row.start(a)
a<-table.element(a,'(p-val)', header=TRUE)
for (i in 1:ncols) {
mydum <- '('
mydum <- paste(mydum,round(selection[[2]][j,i],4),sep='')
mydum <- paste(mydum,')')
a<-table.element(a,mydum)
}
a<-table.row.end(a)
}
a<-table.end(a)
table.save(a,file='mytable.tab')
a<-table.start()
a<-table.row.start(a)
a<-table.element(a,'Estimated ARIMA Residuals', 1,TRUE)
a<-table.row.end(a)
a<-table.row.start(a)
a<-table.element(a,'Value', 1,TRUE)
a<-table.row.end(a)
for (i in (par4*par5+par3):length(resid)) {
a<-table.row.start(a)
a<-table.element(a,resid[i])
a<-table.row.end(a)
}
a<-table.end(a)
table.save(a,file='mytable1.tab')