Free Statistics

of Irreproducible Research!

Author's title

Author*The author of this computation has been verified*
R Software Modulerwasp_exponentialsmoothing.wasp
Title produced by softwareExponential Smoothing
Date of computationThu, 03 Dec 2009 10:45:05 -0700
Cite this page as followsStatistical Computations at FreeStatistics.org, Office for Research Development and Education, URL https://freestatistics.org/blog/index.php?v=date/2009/Dec/03/t1259862456wcam4krepc90zho.htm/, Retrieved Sat, 20 Apr 2024 09:32:23 +0000
Statistical Computations at FreeStatistics.org, Office for Research Development and Education, URL https://freestatistics.org/blog/index.php?pk=62982, Retrieved Sat, 20 Apr 2024 09:32:23 +0000
QR Codes:

Original text written by user:
IsPrivate?No (this computation is public)
User-defined keywords
Estimated Impact172
Family? (F = Feedback message, R = changed R code, M = changed R Module, P = changed Parameters, D = changed Data)
-     [Univariate Data Series] [data set] [2008-12-01 19:54:57] [b98453cac15ba1066b407e146608df68]
- RMP   [Exponential Smoothing] [] [2009-11-27 15:04:36] [b98453cac15ba1066b407e146608df68]
-    D      [Exponential Smoothing] [] [2009-12-03 17:45:05] [429631dabc57c2ce83a6344a979b9063] [Current]
-   PD        [Exponential Smoothing] [] [2009-12-04 12:36:22] [74be16979710d4c4e7c6647856088456]
Feedback Forum

Post a new message
Dataseries X:
115.6
111.9
107
107.1
100.6
99.2
108.4
103
99.8
115
90.8
95.9
114.4
108.2
112.6
109.1
105
105
118.5
103.7
112.5
116.6
96.6
101.9
116.5
119.3
115.4
108.5
111.5
108.8
121.8
109.6
112.2
119.6
104.1
105.3
115
124.1
116.8
107.5
115.6
116.2
116.3
119
111.9
118.6
106.9
103.2
118.6
118.7
102.8
100.6
94.9
94.5
102.9
95.3
92.5
102.7
91.5
89.5


Summary of computational transaction
Raw Inputview raw input (R code)
Raw Outputview raw output of R engine
Computing time1 seconds
R Server'Gwilym Jenkins' @ 72.249.127.135

\begin{tabular}{lllllllll}
\hline
Summary of computational transaction \tabularnewline
Raw Input & view raw input (R code)  \tabularnewline
Raw Output & view raw output of R engine  \tabularnewline
Computing time & 1 seconds \tabularnewline
R Server & 'Gwilym Jenkins' @ 72.249.127.135 \tabularnewline
\hline
\end{tabular}
%Source: https://freestatistics.org/blog/index.php?pk=62982&T=0

[TABLE]
[ROW][C]Summary of computational transaction[/C][/ROW]
[ROW][C]Raw Input[/C][C]view raw input (R code) [/C][/ROW]
[ROW][C]Raw Output[/C][C]view raw output of R engine [/C][/ROW]
[ROW][C]Computing time[/C][C]1 seconds[/C][/ROW]
[ROW][C]R Server[/C][C]'Gwilym Jenkins' @ 72.249.127.135[/C][/ROW]
[/TABLE]
Source: https://freestatistics.org/blog/index.php?pk=62982&T=0

Globally Unique Identifier (entire table): ba.freestatistics.org/blog/index.php?pk=62982&T=0

As an alternative you can also use a QR Code:  

The GUIDs for individual cells are displayed in the table below:

Summary of computational transaction
Raw Inputview raw input (R code)
Raw Outputview raw output of R engine
Computing time1 seconds
R Server'Gwilym Jenkins' @ 72.249.127.135


Estimated Parameters of Exponential Smoothing
ParameterValue
alpha0.423062231690076
beta0.0627075516491882
gamma0.793116115991903

\begin{tabular}{lllllllll}
\hline
Estimated Parameters of Exponential Smoothing \tabularnewline
Parameter & Value \tabularnewline
alpha & 0.423062231690076 \tabularnewline
beta & 0.0627075516491882 \tabularnewline
gamma & 0.793116115991903 \tabularnewline
\hline
\end{tabular}
%Source: https://freestatistics.org/blog/index.php?pk=62982&T=1

[TABLE]
[ROW][C]Estimated Parameters of Exponential Smoothing[/C][/ROW]
[ROW][C]Parameter[/C][C]Value[/C][/ROW]
[ROW][C]alpha[/C][C]0.423062231690076[/C][/ROW]
[ROW][C]beta[/C][C]0.0627075516491882[/C][/ROW]
[ROW][C]gamma[/C][C]0.793116115991903[/C][/ROW]
[/TABLE]
Source: https://freestatistics.org/blog/index.php?pk=62982&T=1

Globally Unique Identifier (entire table): ba.freestatistics.org/blog/index.php?pk=62982&T=1

As an alternative you can also use a QR Code:  

The GUIDs for individual cells are displayed in the table below:

Estimated Parameters of Exponential Smoothing
ParameterValue
alpha0.423062231690076
beta0.0627075516491882
gamma0.793116115991903


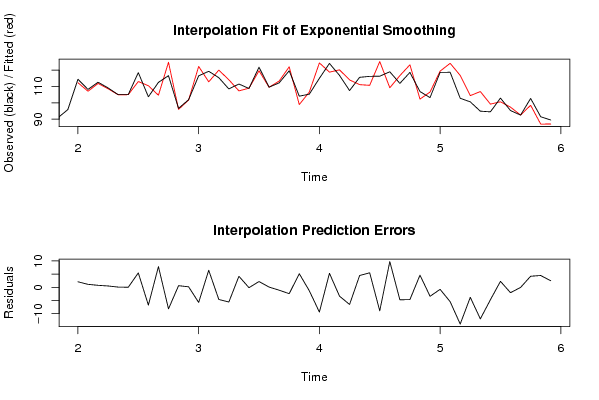
Interpolation Forecasts of Exponential Smoothing
tObservedFittedResiduals
13114.4112.3121518702802.08784812971953
14108.2107.0755302033221.12446979667828
15112.6111.8556450800820.744354919917498
16109.1108.5971246297860.502875370214298
17105104.9285737212550.0714262787447808
18105104.9893846781980.0106153218017084
19118.5113.0348524693895.46514753061059
20103.7110.470497573379-6.7704975733786
21112.5104.6442265710367.8557734289635
22116.6124.80347733297-8.20347733297001
2396.695.99037851284770.609621487152268
24101.9101.7173640389070.182635961093084
25116.5122.262812408555-5.76281240855519
26119.3112.8354025719536.464597428047
27115.4120.017635099955-4.61763509995481
28108.5114.099789967481-5.59978996748099
29111.5107.3141582331244.18584176687578
30108.8108.953181500539-0.153181500539347
31121.8119.6124247564682.18757524353209
32109.6109.5249487996670.0750512003328225
33112.2113.304692214562-1.10469221456205
34119.6122.026610241289-2.42661024128901
35104.198.94026977688775.15973022311232
36105.3106.629716297735-1.32971629773465
37115124.423976850032-9.42397685003152
38124.1118.7809113915925.31908860840765
39116.8120.173618557105-3.37361855710506
40107.5114.024042094822-6.52404209482158
41115.6111.1253858809674.47461411903342
42116.2110.7010932563375.4989067436626
43116.3125.249410251738-8.94941025173807
44119109.2212536571819.77874634281864
45111.9116.646098025167-4.74609802516717
46118.6123.262300467499-4.66230046749936
47106.9102.2795224087724.62047759122774
48103.2106.612786519305-3.41278651930544
49118.6119.384998676967-0.784998676966808
50118.7124.18106008288-5.48106008288003
51102.8116.764132903014-13.9641329030137
52100.6104.410422742939-3.8104227429386
5394.9106.902904704344-12.0029047043441
5494.599.2338124631182-4.73381246311823
55102.9100.6447119951152.25528800488519
5695.397.3591355572064-2.05913555720637
5792.592.5585831879984-0.0585831879983942
58102.798.50516167028734.19483832971267
5991.587.01821748566624.48178251433382
6089.587.03483076742562.46516923257437

\begin{tabular}{lllllllll}
\hline
Interpolation Forecasts of Exponential Smoothing \tabularnewline
t & Observed & Fitted & Residuals \tabularnewline
13 & 114.4 & 112.312151870280 & 2.08784812971953 \tabularnewline
14 & 108.2 & 107.075530203322 & 1.12446979667828 \tabularnewline
15 & 112.6 & 111.855645080082 & 0.744354919917498 \tabularnewline
16 & 109.1 & 108.597124629786 & 0.502875370214298 \tabularnewline
17 & 105 & 104.928573721255 & 0.0714262787447808 \tabularnewline
18 & 105 & 104.989384678198 & 0.0106153218017084 \tabularnewline
19 & 118.5 & 113.034852469389 & 5.46514753061059 \tabularnewline
20 & 103.7 & 110.470497573379 & -6.7704975733786 \tabularnewline
21 & 112.5 & 104.644226571036 & 7.8557734289635 \tabularnewline
22 & 116.6 & 124.80347733297 & -8.20347733297001 \tabularnewline
23 & 96.6 & 95.9903785128477 & 0.609621487152268 \tabularnewline
24 & 101.9 & 101.717364038907 & 0.182635961093084 \tabularnewline
25 & 116.5 & 122.262812408555 & -5.76281240855519 \tabularnewline
26 & 119.3 & 112.835402571953 & 6.464597428047 \tabularnewline
27 & 115.4 & 120.017635099955 & -4.61763509995481 \tabularnewline
28 & 108.5 & 114.099789967481 & -5.59978996748099 \tabularnewline
29 & 111.5 & 107.314158233124 & 4.18584176687578 \tabularnewline
30 & 108.8 & 108.953181500539 & -0.153181500539347 \tabularnewline
31 & 121.8 & 119.612424756468 & 2.18757524353209 \tabularnewline
32 & 109.6 & 109.524948799667 & 0.0750512003328225 \tabularnewline
33 & 112.2 & 113.304692214562 & -1.10469221456205 \tabularnewline
34 & 119.6 & 122.026610241289 & -2.42661024128901 \tabularnewline
35 & 104.1 & 98.9402697768877 & 5.15973022311232 \tabularnewline
36 & 105.3 & 106.629716297735 & -1.32971629773465 \tabularnewline
37 & 115 & 124.423976850032 & -9.42397685003152 \tabularnewline
38 & 124.1 & 118.780911391592 & 5.31908860840765 \tabularnewline
39 & 116.8 & 120.173618557105 & -3.37361855710506 \tabularnewline
40 & 107.5 & 114.024042094822 & -6.52404209482158 \tabularnewline
41 & 115.6 & 111.125385880967 & 4.47461411903342 \tabularnewline
42 & 116.2 & 110.701093256337 & 5.4989067436626 \tabularnewline
43 & 116.3 & 125.249410251738 & -8.94941025173807 \tabularnewline
44 & 119 & 109.221253657181 & 9.77874634281864 \tabularnewline
45 & 111.9 & 116.646098025167 & -4.74609802516717 \tabularnewline
46 & 118.6 & 123.262300467499 & -4.66230046749936 \tabularnewline
47 & 106.9 & 102.279522408772 & 4.62047759122774 \tabularnewline
48 & 103.2 & 106.612786519305 & -3.41278651930544 \tabularnewline
49 & 118.6 & 119.384998676967 & -0.784998676966808 \tabularnewline
50 & 118.7 & 124.18106008288 & -5.48106008288003 \tabularnewline
51 & 102.8 & 116.764132903014 & -13.9641329030137 \tabularnewline
52 & 100.6 & 104.410422742939 & -3.8104227429386 \tabularnewline
53 & 94.9 & 106.902904704344 & -12.0029047043441 \tabularnewline
54 & 94.5 & 99.2338124631182 & -4.73381246311823 \tabularnewline
55 & 102.9 & 100.644711995115 & 2.25528800488519 \tabularnewline
56 & 95.3 & 97.3591355572064 & -2.05913555720637 \tabularnewline
57 & 92.5 & 92.5585831879984 & -0.0585831879983942 \tabularnewline
58 & 102.7 & 98.5051616702873 & 4.19483832971267 \tabularnewline
59 & 91.5 & 87.0182174856662 & 4.48178251433382 \tabularnewline
60 & 89.5 & 87.0348307674256 & 2.46516923257437 \tabularnewline
\hline
\end{tabular}
%Source: https://freestatistics.org/blog/index.php?pk=62982&T=2

[TABLE]
[ROW][C]Interpolation Forecasts of Exponential Smoothing[/C][/ROW]
[ROW][C]t[/C][C]Observed[/C][C]Fitted[/C][C]Residuals[/C][/ROW]
[ROW][C]13[/C][C]114.4[/C][C]112.312151870280[/C][C]2.08784812971953[/C][/ROW]
[ROW][C]14[/C][C]108.2[/C][C]107.075530203322[/C][C]1.12446979667828[/C][/ROW]
[ROW][C]15[/C][C]112.6[/C][C]111.855645080082[/C][C]0.744354919917498[/C][/ROW]
[ROW][C]16[/C][C]109.1[/C][C]108.597124629786[/C][C]0.502875370214298[/C][/ROW]
[ROW][C]17[/C][C]105[/C][C]104.928573721255[/C][C]0.0714262787447808[/C][/ROW]
[ROW][C]18[/C][C]105[/C][C]104.989384678198[/C][C]0.0106153218017084[/C][/ROW]
[ROW][C]19[/C][C]118.5[/C][C]113.034852469389[/C][C]5.46514753061059[/C][/ROW]
[ROW][C]20[/C][C]103.7[/C][C]110.470497573379[/C][C]-6.7704975733786[/C][/ROW]
[ROW][C]21[/C][C]112.5[/C][C]104.644226571036[/C][C]7.8557734289635[/C][/ROW]
[ROW][C]22[/C][C]116.6[/C][C]124.80347733297[/C][C]-8.20347733297001[/C][/ROW]
[ROW][C]23[/C][C]96.6[/C][C]95.9903785128477[/C][C]0.609621487152268[/C][/ROW]
[ROW][C]24[/C][C]101.9[/C][C]101.717364038907[/C][C]0.182635961093084[/C][/ROW]
[ROW][C]25[/C][C]116.5[/C][C]122.262812408555[/C][C]-5.76281240855519[/C][/ROW]
[ROW][C]26[/C][C]119.3[/C][C]112.835402571953[/C][C]6.464597428047[/C][/ROW]
[ROW][C]27[/C][C]115.4[/C][C]120.017635099955[/C][C]-4.61763509995481[/C][/ROW]
[ROW][C]28[/C][C]108.5[/C][C]114.099789967481[/C][C]-5.59978996748099[/C][/ROW]
[ROW][C]29[/C][C]111.5[/C][C]107.314158233124[/C][C]4.18584176687578[/C][/ROW]
[ROW][C]30[/C][C]108.8[/C][C]108.953181500539[/C][C]-0.153181500539347[/C][/ROW]
[ROW][C]31[/C][C]121.8[/C][C]119.612424756468[/C][C]2.18757524353209[/C][/ROW]
[ROW][C]32[/C][C]109.6[/C][C]109.524948799667[/C][C]0.0750512003328225[/C][/ROW]
[ROW][C]33[/C][C]112.2[/C][C]113.304692214562[/C][C]-1.10469221456205[/C][/ROW]
[ROW][C]34[/C][C]119.6[/C][C]122.026610241289[/C][C]-2.42661024128901[/C][/ROW]
[ROW][C]35[/C][C]104.1[/C][C]98.9402697768877[/C][C]5.15973022311232[/C][/ROW]
[ROW][C]36[/C][C]105.3[/C][C]106.629716297735[/C][C]-1.32971629773465[/C][/ROW]
[ROW][C]37[/C][C]115[/C][C]124.423976850032[/C][C]-9.42397685003152[/C][/ROW]
[ROW][C]38[/C][C]124.1[/C][C]118.780911391592[/C][C]5.31908860840765[/C][/ROW]
[ROW][C]39[/C][C]116.8[/C][C]120.173618557105[/C][C]-3.37361855710506[/C][/ROW]
[ROW][C]40[/C][C]107.5[/C][C]114.024042094822[/C][C]-6.52404209482158[/C][/ROW]
[ROW][C]41[/C][C]115.6[/C][C]111.125385880967[/C][C]4.47461411903342[/C][/ROW]
[ROW][C]42[/C][C]116.2[/C][C]110.701093256337[/C][C]5.4989067436626[/C][/ROW]
[ROW][C]43[/C][C]116.3[/C][C]125.249410251738[/C][C]-8.94941025173807[/C][/ROW]
[ROW][C]44[/C][C]119[/C][C]109.221253657181[/C][C]9.77874634281864[/C][/ROW]
[ROW][C]45[/C][C]111.9[/C][C]116.646098025167[/C][C]-4.74609802516717[/C][/ROW]
[ROW][C]46[/C][C]118.6[/C][C]123.262300467499[/C][C]-4.66230046749936[/C][/ROW]
[ROW][C]47[/C][C]106.9[/C][C]102.279522408772[/C][C]4.62047759122774[/C][/ROW]
[ROW][C]48[/C][C]103.2[/C][C]106.612786519305[/C][C]-3.41278651930544[/C][/ROW]
[ROW][C]49[/C][C]118.6[/C][C]119.384998676967[/C][C]-0.784998676966808[/C][/ROW]
[ROW][C]50[/C][C]118.7[/C][C]124.18106008288[/C][C]-5.48106008288003[/C][/ROW]
[ROW][C]51[/C][C]102.8[/C][C]116.764132903014[/C][C]-13.9641329030137[/C][/ROW]
[ROW][C]52[/C][C]100.6[/C][C]104.410422742939[/C][C]-3.8104227429386[/C][/ROW]
[ROW][C]53[/C][C]94.9[/C][C]106.902904704344[/C][C]-12.0029047043441[/C][/ROW]
[ROW][C]54[/C][C]94.5[/C][C]99.2338124631182[/C][C]-4.73381246311823[/C][/ROW]
[ROW][C]55[/C][C]102.9[/C][C]100.644711995115[/C][C]2.25528800488519[/C][/ROW]
[ROW][C]56[/C][C]95.3[/C][C]97.3591355572064[/C][C]-2.05913555720637[/C][/ROW]
[ROW][C]57[/C][C]92.5[/C][C]92.5585831879984[/C][C]-0.0585831879983942[/C][/ROW]
[ROW][C]58[/C][C]102.7[/C][C]98.5051616702873[/C][C]4.19483832971267[/C][/ROW]
[ROW][C]59[/C][C]91.5[/C][C]87.0182174856662[/C][C]4.48178251433382[/C][/ROW]
[ROW][C]60[/C][C]89.5[/C][C]87.0348307674256[/C][C]2.46516923257437[/C][/ROW]
[/TABLE]
Source: https://freestatistics.org/blog/index.php?pk=62982&T=2

Globally Unique Identifier (entire table): ba.freestatistics.org/blog/index.php?pk=62982&T=2

As an alternative you can also use a QR Code:  

The GUIDs for individual cells are displayed in the table below:

Interpolation Forecasts of Exponential Smoothing
tObservedFittedResiduals
13114.4112.3121518702802.08784812971953
14108.2107.0755302033221.12446979667828
15112.6111.8556450800820.744354919917498
16109.1108.5971246297860.502875370214298
17105104.9285737212550.0714262787447808
18105104.9893846781980.0106153218017084
19118.5113.0348524693895.46514753061059
20103.7110.470497573379-6.7704975733786
21112.5104.6442265710367.8557734289635
22116.6124.80347733297-8.20347733297001
2396.695.99037851284770.609621487152268
24101.9101.7173640389070.182635961093084
25116.5122.262812408555-5.76281240855519
26119.3112.8354025719536.464597428047
27115.4120.017635099955-4.61763509995481
28108.5114.099789967481-5.59978996748099
29111.5107.3141582331244.18584176687578
30108.8108.953181500539-0.153181500539347
31121.8119.6124247564682.18757524353209
32109.6109.5249487996670.0750512003328225
33112.2113.304692214562-1.10469221456205
34119.6122.026610241289-2.42661024128901
35104.198.94026977688775.15973022311232
36105.3106.629716297735-1.32971629773465
37115124.423976850032-9.42397685003152
38124.1118.7809113915925.31908860840765
39116.8120.173618557105-3.37361855710506
40107.5114.024042094822-6.52404209482158
41115.6111.1253858809674.47461411903342
42116.2110.7010932563375.4989067436626
43116.3125.249410251738-8.94941025173807
44119109.2212536571819.77874634281864
45111.9116.646098025167-4.74609802516717
46118.6123.262300467499-4.66230046749936
47106.9102.2795224087724.62047759122774
48103.2106.612786519305-3.41278651930544
49118.6119.384998676967-0.784998676966808
50118.7124.18106008288-5.48106008288003
51102.8116.764132903014-13.9641329030137
52100.6104.410422742939-3.8104227429386
5394.9106.902904704344-12.0029047043441
5494.599.2338124631182-4.73381246311823
55102.9100.6447119951152.25528800488519
5695.397.3591355572064-2.05913555720637
5792.592.5585831879984-0.0585831879983942
58102.798.50516167028734.19483832971267
5991.587.01821748566624.48178251433382
6089.587.03483076742562.46516923257437


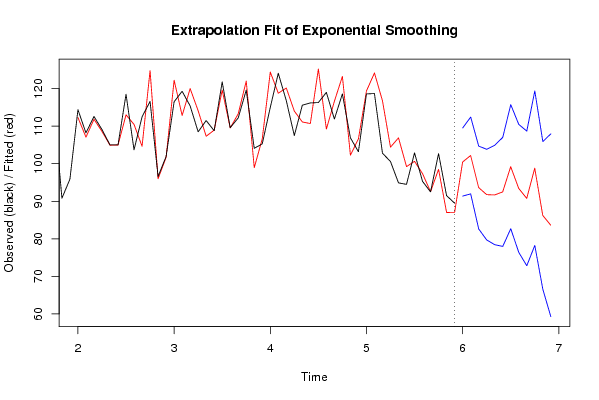
Extrapolation Forecasts of Exponential Smoothing
tForecast95% Lower Bound95% Upper Bound
61100.45070126059791.381738448949109.519664072244
62102.20033995854291.969461001589112.431218915495
6393.65604111092782.6204320178374104.691650204017
6491.768005318678979.6877857685657103.848224868792
6591.68515396146878.4378660378198104.932441885116
6692.489931512466877.9675705981073107.012292426826
6799.2166536848682.692510518684115.740796851036
6893.428304076194376.3843664806571110.472241671731
6990.762811350124572.827931791258108.697690908991
7098.810781415862678.237166208064119.384396623661
7186.240964508244366.5739757272896105.907953289199
7283.610190924391859.2624755728838107.957906275900

\begin{tabular}{lllllllll}
\hline
Extrapolation Forecasts of Exponential Smoothing \tabularnewline
t & Forecast & 95% Lower Bound & 95% Upper Bound \tabularnewline
61 & 100.450701260597 & 91.381738448949 & 109.519664072244 \tabularnewline
62 & 102.200339958542 & 91.969461001589 & 112.431218915495 \tabularnewline
63 & 93.656041110927 & 82.6204320178374 & 104.691650204017 \tabularnewline
64 & 91.7680053186789 & 79.6877857685657 & 103.848224868792 \tabularnewline
65 & 91.685153961468 & 78.4378660378198 & 104.932441885116 \tabularnewline
66 & 92.4899315124668 & 77.9675705981073 & 107.012292426826 \tabularnewline
67 & 99.21665368486 & 82.692510518684 & 115.740796851036 \tabularnewline
68 & 93.4283040761943 & 76.3843664806571 & 110.472241671731 \tabularnewline
69 & 90.7628113501245 & 72.827931791258 & 108.697690908991 \tabularnewline
70 & 98.8107814158626 & 78.237166208064 & 119.384396623661 \tabularnewline
71 & 86.2409645082443 & 66.5739757272896 & 105.907953289199 \tabularnewline
72 & 83.6101909243918 & 59.2624755728838 & 107.957906275900 \tabularnewline
\hline
\end{tabular}
%Source: https://freestatistics.org/blog/index.php?pk=62982&T=3

[TABLE]
[ROW][C]Extrapolation Forecasts of Exponential Smoothing[/C][/ROW]
[ROW][C]t[/C][C]Forecast[/C][C]95% Lower Bound[/C][C]95% Upper Bound[/C][/ROW]
[ROW][C]61[/C][C]100.450701260597[/C][C]91.381738448949[/C][C]109.519664072244[/C][/ROW]
[ROW][C]62[/C][C]102.200339958542[/C][C]91.969461001589[/C][C]112.431218915495[/C][/ROW]
[ROW][C]63[/C][C]93.656041110927[/C][C]82.6204320178374[/C][C]104.691650204017[/C][/ROW]
[ROW][C]64[/C][C]91.7680053186789[/C][C]79.6877857685657[/C][C]103.848224868792[/C][/ROW]
[ROW][C]65[/C][C]91.685153961468[/C][C]78.4378660378198[/C][C]104.932441885116[/C][/ROW]
[ROW][C]66[/C][C]92.4899315124668[/C][C]77.9675705981073[/C][C]107.012292426826[/C][/ROW]
[ROW][C]67[/C][C]99.21665368486[/C][C]82.692510518684[/C][C]115.740796851036[/C][/ROW]
[ROW][C]68[/C][C]93.4283040761943[/C][C]76.3843664806571[/C][C]110.472241671731[/C][/ROW]
[ROW][C]69[/C][C]90.7628113501245[/C][C]72.827931791258[/C][C]108.697690908991[/C][/ROW]
[ROW][C]70[/C][C]98.8107814158626[/C][C]78.237166208064[/C][C]119.384396623661[/C][/ROW]
[ROW][C]71[/C][C]86.2409645082443[/C][C]66.5739757272896[/C][C]105.907953289199[/C][/ROW]
[ROW][C]72[/C][C]83.6101909243918[/C][C]59.2624755728838[/C][C]107.957906275900[/C][/ROW]
[/TABLE]
Source: https://freestatistics.org/blog/index.php?pk=62982&T=3

Globally Unique Identifier (entire table): ba.freestatistics.org/blog/index.php?pk=62982&T=3

As an alternative you can also use a QR Code:  

The GUIDs for individual cells are displayed in the table below:

Extrapolation Forecasts of Exponential Smoothing
tForecast95% Lower Bound95% Upper Bound
61100.45070126059791.381738448949109.519664072244
62102.20033995854291.969461001589112.431218915495
6393.65604111092782.6204320178374104.691650204017
6491.768005318678979.6877857685657103.848224868792
6591.68515396146878.4378660378198104.932441885116
6692.489931512466877.9675705981073107.012292426826
6799.2166536848682.692510518684115.740796851036
6893.428304076194376.3843664806571110.472241671731
6990.762811350124572.827931791258108.697690908991
7098.810781415862678.237166208064119.384396623661
7186.240964508244366.5739757272896105.907953289199
7283.610190924391859.2624755728838107.957906275900


Parameters (Session):
par1 = 12 ; par2 = Triple ; par3 = multiplicative ;
Parameters (R input):
par1 = 12 ; par2 = Triple ; par3 = multiplicative ;
R code (references can be found in the software module):
par1 <- as.numeric(par1)
if (par2 == 'Single') K <- 1
if (par2 == 'Double') K <- 2
if (par2 == 'Triple') K <- par1
nx <- length(x)
nxmK <- nx - K
x <- ts(x, frequency = par1)
if (par2 == 'Single') fit <- HoltWinters(x, gamma=0, beta=0)
if (par2 == 'Double') fit <- HoltWinters(x, gamma=0)
if (par2 == 'Triple') fit <- HoltWinters(x, seasonal=par3)
fit
myresid <- x - fit$fitted[,'xhat']
bitmap(file='test1.png')
op <- par(mfrow=c(2,1))
plot(fit,ylab='Observed (black) / Fitted (red)',main='Interpolation Fit of Exponential Smoothing')
plot(myresid,ylab='Residuals',main='Interpolation Prediction Errors')
par(op)
dev.off()
bitmap(file='test2.png')
p <- predict(fit, par1, prediction.interval=TRUE)
np <- length(p[,1])
plot(fit,p,ylab='Observed (black) / Fitted (red)',main='Extrapolation Fit of Exponential Smoothing')
dev.off()
bitmap(file='test3.png')
op <- par(mfrow = c(2,2))
acf(as.numeric(myresid),lag.max = nx/2,main='Residual ACF')
spectrum(myresid,main='Residals Periodogram')
cpgram(myresid,main='Residal Cumulative Periodogram')
qqnorm(myresid,main='Residual Normal QQ Plot')
qqline(myresid)
par(op)
dev.off()
load(file='createtable')
a<-table.start()
a<-table.row.start(a)
a<-table.element(a,'Estimated Parameters of Exponential Smoothing',2,TRUE)
a<-table.row.end(a)
a<-table.row.start(a)
a<-table.element(a,'Parameter',header=TRUE)
a<-table.element(a,'Value',header=TRUE)
a<-table.row.end(a)
a<-table.row.start(a)
a<-table.element(a,'alpha',header=TRUE)
a<-table.element(a,fit$alpha)
a<-table.row.end(a)
a<-table.row.start(a)
a<-table.element(a,'beta',header=TRUE)
a<-table.element(a,fit$beta)
a<-table.row.end(a)
a<-table.row.start(a)
a<-table.element(a,'gamma',header=TRUE)
a<-table.element(a,fit$gamma)
a<-table.row.end(a)
a<-table.end(a)
table.save(a,file='mytable.tab')
a<-table.start()
a<-table.row.start(a)
a<-table.element(a,'Interpolation Forecasts of Exponential Smoothing',4,TRUE)
a<-table.row.end(a)
a<-table.row.start(a)
a<-table.element(a,'t',header=TRUE)
a<-table.element(a,'Observed',header=TRUE)
a<-table.element(a,'Fitted',header=TRUE)
a<-table.element(a,'Residuals',header=TRUE)
a<-table.row.end(a)
for (i in 1:nxmK) {
a<-table.row.start(a)
a<-table.element(a,i+K,header=TRUE)
a<-table.element(a,x[i+K])
a<-table.element(a,fit$fitted[i,'xhat'])
a<-table.element(a,myresid[i])
a<-table.row.end(a)
}
a<-table.end(a)
table.save(a,file='mytable1.tab')
a<-table.start()
a<-table.row.start(a)
a<-table.element(a,'Extrapolation Forecasts of Exponential Smoothing',4,TRUE)
a<-table.row.end(a)
a<-table.row.start(a)
a<-table.element(a,'t',header=TRUE)
a<-table.element(a,'Forecast',header=TRUE)
a<-table.element(a,'95% Lower Bound',header=TRUE)
a<-table.element(a,'95% Upper Bound',header=TRUE)
a<-table.row.end(a)
for (i in 1:np) {
a<-table.row.start(a)
a<-table.element(a,nx+i,header=TRUE)
a<-table.element(a,p[i,'fit'])
a<-table.element(a,p[i,'lwr'])
a<-table.element(a,p[i,'upr'])
a<-table.row.end(a)
}
a<-table.end(a)
table.save(a,file='mytable2.tab')