Free Statistics

of Irreproducible Research!

Author's title

Author*The author of this computation has been verified*
R Software Modulerwasp_exponentialsmoothing.wasp
Title produced by softwareExponential Smoothing
Date of computationThu, 03 Dec 2009 13:15:03 -0700
Cite this page as followsStatistical Computations at FreeStatistics.org, Office for Research Development and Education, URL https://freestatistics.org/blog/index.php?v=date/2009/Dec/03/t1259871436hmutih0prbl6nf8.htm/, Retrieved Thu, 18 Apr 2024 16:16:13 +0000
Statistical Computations at FreeStatistics.org, Office for Research Development and Education, URL https://freestatistics.org/blog/index.php?pk=63108, Retrieved Thu, 18 Apr 2024 16:16:13 +0000
QR Codes:

Original text written by user:
IsPrivate?No (this computation is public)
User-defined keywords
Estimated Impact137
Family? (F = Feedback message, R = changed R code, M = changed R Module, P = changed Parameters, D = changed Data)
-     [Univariate Data Series] [data set] [2008-12-01 19:54:57] [b98453cac15ba1066b407e146608df68]
- RMP   [Exponential Smoothing] [] [2009-11-27 15:04:36] [b98453cac15ba1066b407e146608df68]
- R PD      [Exponential Smoothing] [] [2009-12-03 20:15:03] [ed082d38031561faed979d8cebfeba4d] [Current]
-   PD        [Exponential Smoothing] [] [2009-12-11 13:06:10] [a4642ac6536e7ce898d9b031a7452eab]
Feedback Forum

Post a new message
Dataseries X:
1915
1843
1761
2858
3968
5061
4661
4269
3857
3568
3274
2987
1683
1381
1071
2772
4485
6181
5479
4782
4067
3489
2903
2330
1736
1483
1242
2334
3423
4523
3986
3462
2908
2575
2237
1904
1610
1251
941
2450
3946
5409
4741
4069
3539
3189
2960
2704
1697
1598
1456
2316
3083
4158
3469
2892
2578
2233
1947
2049


Summary of computational transaction
Raw Inputview raw input (R code)
Raw Outputview raw output of R engine
Computing time2 seconds
R Server'Gwilym Jenkins' @ 72.249.127.135

\begin{tabular}{lllllllll}
\hline
Summary of computational transaction \tabularnewline
Raw Input & view raw input (R code)  \tabularnewline
Raw Output & view raw output of R engine  \tabularnewline
Computing time & 2 seconds \tabularnewline
R Server & 'Gwilym Jenkins' @ 72.249.127.135 \tabularnewline
\hline
\end{tabular}
%Source: https://freestatistics.org/blog/index.php?pk=63108&T=0

[TABLE]
[ROW][C]Summary of computational transaction[/C][/ROW]
[ROW][C]Raw Input[/C][C]view raw input (R code) [/C][/ROW]
[ROW][C]Raw Output[/C][C]view raw output of R engine [/C][/ROW]
[ROW][C]Computing time[/C][C]2 seconds[/C][/ROW]
[ROW][C]R Server[/C][C]'Gwilym Jenkins' @ 72.249.127.135[/C][/ROW]
[/TABLE]
Source: https://freestatistics.org/blog/index.php?pk=63108&T=0

Globally Unique Identifier (entire table): ba.freestatistics.org/blog/index.php?pk=63108&T=0

As an alternative you can also use a QR Code:  

The GUIDs for individual cells are displayed in the table below:

Summary of computational transaction
Raw Inputview raw input (R code)
Raw Outputview raw output of R engine
Computing time2 seconds
R Server'Gwilym Jenkins' @ 72.249.127.135


Estimated Parameters of Exponential Smoothing
ParameterValue
alpha0.828031507927449
beta0.0238508238386854
gamma1

\begin{tabular}{lllllllll}
\hline
Estimated Parameters of Exponential Smoothing \tabularnewline
Parameter & Value \tabularnewline
alpha & 0.828031507927449 \tabularnewline
beta & 0.0238508238386854 \tabularnewline
gamma & 1 \tabularnewline
\hline
\end{tabular}
%Source: https://freestatistics.org/blog/index.php?pk=63108&T=1

[TABLE]
[ROW][C]Estimated Parameters of Exponential Smoothing[/C][/ROW]
[ROW][C]Parameter[/C][C]Value[/C][/ROW]
[ROW][C]alpha[/C][C]0.828031507927449[/C][/ROW]
[ROW][C]beta[/C][C]0.0238508238386854[/C][/ROW]
[ROW][C]gamma[/C][C]1[/C][/ROW]
[/TABLE]
Source: https://freestatistics.org/blog/index.php?pk=63108&T=1

Globally Unique Identifier (entire table): ba.freestatistics.org/blog/index.php?pk=63108&T=1

As an alternative you can also use a QR Code:  

The GUIDs for individual cells are displayed in the table below:

Estimated Parameters of Exponential Smoothing
ParameterValue
alpha0.828031507927449
beta0.0238508238386854
gamma1


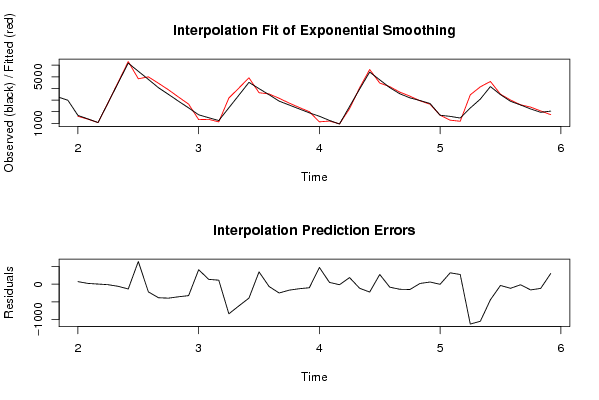
Interpolation Forecasts of Exponential Smoothing
tObservedFittedResiduals
1316831608.8268856885674.173114311443
1413811357.9136980367123.0863019632907
1510711066.288485842844.71151415715826
1627722785.53972128617-13.5397212861740
1744854545.20556285968-60.2055628596772
1861816316.13672702229-135.136727022292
1954794832.39132443641646.60867556359
2047825000.19699281017-218.196992810166
2140674452.10689138544-385.106891385442
2234893886.04616744914-397.046167449143
2329033260.85490757784-357.854907577836
2423302655.72885525292-325.728855252919
2517361322.58623241317413.41376758683
2614831344.55721732629138.442782673713
2712421126.73212815318115.267871846817
2823343177.97827150418-843.97827150418
2934234040.06744600806-617.067446008059
3045234918.78016910112-395.780169101118
3139863634.74365214425351.256347855753
3234623527.23052753161-65.2305275316098
3329083158.16172619785-250.161726197848
3425752744.05834623958-169.058346239581
3522372365.38877749005-128.388777490051
3619042004.33273938258-100.332739382581
3716101130.67522592317479.32477407683
3812511198.9032983611952.0967016388136
39941955.488148912645-14.4881489126451
4024502261.01843060231188.981569397691
4139464061.70666127552-115.706661275522
4254095632.51938345435-223.519383454351
4347414463.70607781966277.293922180342
4440694153.60882164347-84.608821643471
4535393683.19537392962-144.195373929622
4631893339.77686084301-150.776860843009
4729602938.6695733070121.3304266929872
4827042641.6066929309262.3933070690814
4916971699.11320866254-2.11320866254096
5015981273.45633975121324.543660248789
5114561178.62199538218277.378004617822
5223163451.24944071099-1135.24944071099
5330834139.73061534856-1056.73061534856
5441584601.15720943110-443.157209431104
5534693504.3834670024-35.3834670024021
5628923008.05001865794-116.050018657943
5725782593.80801454288-15.8080145428780
5822332395.13960123425-162.139601234248
5919472066.11658394733-119.116583947327
6020491742.94071949305306.059280506953

\begin{tabular}{lllllllll}
\hline
Interpolation Forecasts of Exponential Smoothing \tabularnewline
t & Observed & Fitted & Residuals \tabularnewline
13 & 1683 & 1608.82688568856 & 74.173114311443 \tabularnewline
14 & 1381 & 1357.91369803671 & 23.0863019632907 \tabularnewline
15 & 1071 & 1066.28848584284 & 4.71151415715826 \tabularnewline
16 & 2772 & 2785.53972128617 & -13.5397212861740 \tabularnewline
17 & 4485 & 4545.20556285968 & -60.2055628596772 \tabularnewline
18 & 6181 & 6316.13672702229 & -135.136727022292 \tabularnewline
19 & 5479 & 4832.39132443641 & 646.60867556359 \tabularnewline
20 & 4782 & 5000.19699281017 & -218.196992810166 \tabularnewline
21 & 4067 & 4452.10689138544 & -385.106891385442 \tabularnewline
22 & 3489 & 3886.04616744914 & -397.046167449143 \tabularnewline
23 & 2903 & 3260.85490757784 & -357.854907577836 \tabularnewline
24 & 2330 & 2655.72885525292 & -325.728855252919 \tabularnewline
25 & 1736 & 1322.58623241317 & 413.41376758683 \tabularnewline
26 & 1483 & 1344.55721732629 & 138.442782673713 \tabularnewline
27 & 1242 & 1126.73212815318 & 115.267871846817 \tabularnewline
28 & 2334 & 3177.97827150418 & -843.97827150418 \tabularnewline
29 & 3423 & 4040.06744600806 & -617.067446008059 \tabularnewline
30 & 4523 & 4918.78016910112 & -395.780169101118 \tabularnewline
31 & 3986 & 3634.74365214425 & 351.256347855753 \tabularnewline
32 & 3462 & 3527.23052753161 & -65.2305275316098 \tabularnewline
33 & 2908 & 3158.16172619785 & -250.161726197848 \tabularnewline
34 & 2575 & 2744.05834623958 & -169.058346239581 \tabularnewline
35 & 2237 & 2365.38877749005 & -128.388777490051 \tabularnewline
36 & 1904 & 2004.33273938258 & -100.332739382581 \tabularnewline
37 & 1610 & 1130.67522592317 & 479.32477407683 \tabularnewline
38 & 1251 & 1198.90329836119 & 52.0967016388136 \tabularnewline
39 & 941 & 955.488148912645 & -14.4881489126451 \tabularnewline
40 & 2450 & 2261.01843060231 & 188.981569397691 \tabularnewline
41 & 3946 & 4061.70666127552 & -115.706661275522 \tabularnewline
42 & 5409 & 5632.51938345435 & -223.519383454351 \tabularnewline
43 & 4741 & 4463.70607781966 & 277.293922180342 \tabularnewline
44 & 4069 & 4153.60882164347 & -84.608821643471 \tabularnewline
45 & 3539 & 3683.19537392962 & -144.195373929622 \tabularnewline
46 & 3189 & 3339.77686084301 & -150.776860843009 \tabularnewline
47 & 2960 & 2938.66957330701 & 21.3304266929872 \tabularnewline
48 & 2704 & 2641.60669293092 & 62.3933070690814 \tabularnewline
49 & 1697 & 1699.11320866254 & -2.11320866254096 \tabularnewline
50 & 1598 & 1273.45633975121 & 324.543660248789 \tabularnewline
51 & 1456 & 1178.62199538218 & 277.378004617822 \tabularnewline
52 & 2316 & 3451.24944071099 & -1135.24944071099 \tabularnewline
53 & 3083 & 4139.73061534856 & -1056.73061534856 \tabularnewline
54 & 4158 & 4601.15720943110 & -443.157209431104 \tabularnewline
55 & 3469 & 3504.3834670024 & -35.3834670024021 \tabularnewline
56 & 2892 & 3008.05001865794 & -116.050018657943 \tabularnewline
57 & 2578 & 2593.80801454288 & -15.8080145428780 \tabularnewline
58 & 2233 & 2395.13960123425 & -162.139601234248 \tabularnewline
59 & 1947 & 2066.11658394733 & -119.116583947327 \tabularnewline
60 & 2049 & 1742.94071949305 & 306.059280506953 \tabularnewline
\hline
\end{tabular}
%Source: https://freestatistics.org/blog/index.php?pk=63108&T=2

[TABLE]
[ROW][C]Interpolation Forecasts of Exponential Smoothing[/C][/ROW]
[ROW][C]t[/C][C]Observed[/C][C]Fitted[/C][C]Residuals[/C][/ROW]
[ROW][C]13[/C][C]1683[/C][C]1608.82688568856[/C][C]74.173114311443[/C][/ROW]
[ROW][C]14[/C][C]1381[/C][C]1357.91369803671[/C][C]23.0863019632907[/C][/ROW]
[ROW][C]15[/C][C]1071[/C][C]1066.28848584284[/C][C]4.71151415715826[/C][/ROW]
[ROW][C]16[/C][C]2772[/C][C]2785.53972128617[/C][C]-13.5397212861740[/C][/ROW]
[ROW][C]17[/C][C]4485[/C][C]4545.20556285968[/C][C]-60.2055628596772[/C][/ROW]
[ROW][C]18[/C][C]6181[/C][C]6316.13672702229[/C][C]-135.136727022292[/C][/ROW]
[ROW][C]19[/C][C]5479[/C][C]4832.39132443641[/C][C]646.60867556359[/C][/ROW]
[ROW][C]20[/C][C]4782[/C][C]5000.19699281017[/C][C]-218.196992810166[/C][/ROW]
[ROW][C]21[/C][C]4067[/C][C]4452.10689138544[/C][C]-385.106891385442[/C][/ROW]
[ROW][C]22[/C][C]3489[/C][C]3886.04616744914[/C][C]-397.046167449143[/C][/ROW]
[ROW][C]23[/C][C]2903[/C][C]3260.85490757784[/C][C]-357.854907577836[/C][/ROW]
[ROW][C]24[/C][C]2330[/C][C]2655.72885525292[/C][C]-325.728855252919[/C][/ROW]
[ROW][C]25[/C][C]1736[/C][C]1322.58623241317[/C][C]413.41376758683[/C][/ROW]
[ROW][C]26[/C][C]1483[/C][C]1344.55721732629[/C][C]138.442782673713[/C][/ROW]
[ROW][C]27[/C][C]1242[/C][C]1126.73212815318[/C][C]115.267871846817[/C][/ROW]
[ROW][C]28[/C][C]2334[/C][C]3177.97827150418[/C][C]-843.97827150418[/C][/ROW]
[ROW][C]29[/C][C]3423[/C][C]4040.06744600806[/C][C]-617.067446008059[/C][/ROW]
[ROW][C]30[/C][C]4523[/C][C]4918.78016910112[/C][C]-395.780169101118[/C][/ROW]
[ROW][C]31[/C][C]3986[/C][C]3634.74365214425[/C][C]351.256347855753[/C][/ROW]
[ROW][C]32[/C][C]3462[/C][C]3527.23052753161[/C][C]-65.2305275316098[/C][/ROW]
[ROW][C]33[/C][C]2908[/C][C]3158.16172619785[/C][C]-250.161726197848[/C][/ROW]
[ROW][C]34[/C][C]2575[/C][C]2744.05834623958[/C][C]-169.058346239581[/C][/ROW]
[ROW][C]35[/C][C]2237[/C][C]2365.38877749005[/C][C]-128.388777490051[/C][/ROW]
[ROW][C]36[/C][C]1904[/C][C]2004.33273938258[/C][C]-100.332739382581[/C][/ROW]
[ROW][C]37[/C][C]1610[/C][C]1130.67522592317[/C][C]479.32477407683[/C][/ROW]
[ROW][C]38[/C][C]1251[/C][C]1198.90329836119[/C][C]52.0967016388136[/C][/ROW]
[ROW][C]39[/C][C]941[/C][C]955.488148912645[/C][C]-14.4881489126451[/C][/ROW]
[ROW][C]40[/C][C]2450[/C][C]2261.01843060231[/C][C]188.981569397691[/C][/ROW]
[ROW][C]41[/C][C]3946[/C][C]4061.70666127552[/C][C]-115.706661275522[/C][/ROW]
[ROW][C]42[/C][C]5409[/C][C]5632.51938345435[/C][C]-223.519383454351[/C][/ROW]
[ROW][C]43[/C][C]4741[/C][C]4463.70607781966[/C][C]277.293922180342[/C][/ROW]
[ROW][C]44[/C][C]4069[/C][C]4153.60882164347[/C][C]-84.608821643471[/C][/ROW]
[ROW][C]45[/C][C]3539[/C][C]3683.19537392962[/C][C]-144.195373929622[/C][/ROW]
[ROW][C]46[/C][C]3189[/C][C]3339.77686084301[/C][C]-150.776860843009[/C][/ROW]
[ROW][C]47[/C][C]2960[/C][C]2938.66957330701[/C][C]21.3304266929872[/C][/ROW]
[ROW][C]48[/C][C]2704[/C][C]2641.60669293092[/C][C]62.3933070690814[/C][/ROW]
[ROW][C]49[/C][C]1697[/C][C]1699.11320866254[/C][C]-2.11320866254096[/C][/ROW]
[ROW][C]50[/C][C]1598[/C][C]1273.45633975121[/C][C]324.543660248789[/C][/ROW]
[ROW][C]51[/C][C]1456[/C][C]1178.62199538218[/C][C]277.378004617822[/C][/ROW]
[ROW][C]52[/C][C]2316[/C][C]3451.24944071099[/C][C]-1135.24944071099[/C][/ROW]
[ROW][C]53[/C][C]3083[/C][C]4139.73061534856[/C][C]-1056.73061534856[/C][/ROW]
[ROW][C]54[/C][C]4158[/C][C]4601.15720943110[/C][C]-443.157209431104[/C][/ROW]
[ROW][C]55[/C][C]3469[/C][C]3504.3834670024[/C][C]-35.3834670024021[/C][/ROW]
[ROW][C]56[/C][C]2892[/C][C]3008.05001865794[/C][C]-116.050018657943[/C][/ROW]
[ROW][C]57[/C][C]2578[/C][C]2593.80801454288[/C][C]-15.8080145428780[/C][/ROW]
[ROW][C]58[/C][C]2233[/C][C]2395.13960123425[/C][C]-162.139601234248[/C][/ROW]
[ROW][C]59[/C][C]1947[/C][C]2066.11658394733[/C][C]-119.116583947327[/C][/ROW]
[ROW][C]60[/C][C]2049[/C][C]1742.94071949305[/C][C]306.059280506953[/C][/ROW]
[/TABLE]
Source: https://freestatistics.org/blog/index.php?pk=63108&T=2

Globally Unique Identifier (entire table): ba.freestatistics.org/blog/index.php?pk=63108&T=2

As an alternative you can also use a QR Code:  

The GUIDs for individual cells are displayed in the table below:

Interpolation Forecasts of Exponential Smoothing
tObservedFittedResiduals
1316831608.8268856885674.173114311443
1413811357.9136980367123.0863019632907
1510711066.288485842844.71151415715826
1627722785.53972128617-13.5397212861740
1744854545.20556285968-60.2055628596772
1861816316.13672702229-135.136727022292
1954794832.39132443641646.60867556359
2047825000.19699281017-218.196992810166
2140674452.10689138544-385.106891385442
2234893886.04616744914-397.046167449143
2329033260.85490757784-357.854907577836
2423302655.72885525292-325.728855252919
2517361322.58623241317413.41376758683
2614831344.55721732629138.442782673713
2712421126.73212815318115.267871846817
2823343177.97827150418-843.97827150418
2934234040.06744600806-617.067446008059
3045234918.78016910112-395.780169101118
3139863634.74365214425351.256347855753
3234623527.23052753161-65.2305275316098
3329083158.16172619785-250.161726197848
3425752744.05834623958-169.058346239581
3522372365.38877749005-128.388777490051
3619042004.33273938258-100.332739382581
3716101130.67522592317479.32477407683
3812511198.9032983611952.0967016388136
39941955.488148912645-14.4881489126451
4024502261.01843060231188.981569397691
4139464061.70666127552-115.706661275522
4254095632.51938345435-223.519383454351
4347414463.70607781966277.293922180342
4440694153.60882164347-84.608821643471
4535393683.19537392962-144.195373929622
4631893339.77686084301-150.776860843009
4729602938.6695733070121.3304266929872
4827042641.6066929309262.3933070690814
4916971699.11320866254-2.11320866254096
5015981273.45633975121324.543660248789
5114561178.62199538218277.378004617822
5223163451.24944071099-1135.24944071099
5330834139.73061534856-1056.73061534856
5441584601.15720943110-443.157209431104
5534693504.3834670024-35.3834670024021
5628923008.05001865794-116.050018657943
5725782593.80801454288-15.8080145428780
5822332395.13960123425-162.139601234248
5919472066.11658394733-119.116583947327
6020491742.94071949305306.059280506953


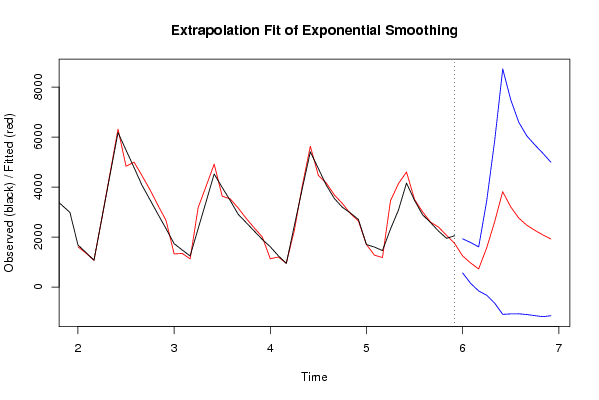
Extrapolation Forecasts of Exponential Smoothing
tForecast95% Lower Bound95% Upper Bound
611244.68194867836561.9716036041061927.39229375260
62960.496174209674143.3898290122121777.60251940714
63724.153742216713-158.878650047491607.18613448091
641560.72603964466-331.2759126242123452.72799191354
652611.86068960467-649.3298436878435873.05122289719
663815.91764761312-1095.807103599848727.64239882609
673207.60637079217-1076.645516859017491.85825844334
682760.52415725046-1072.732125232636593.78043973356
692473.99289193048-1101.448683627146049.4344674881
702271.16634397577-1147.360788084215689.69347603576
712084.18226056431-1186.621904411565354.98642554018
721922.31883787362-1151.610368063634996.24804381086

\begin{tabular}{lllllllll}
\hline
Extrapolation Forecasts of Exponential Smoothing \tabularnewline
t & Forecast & 95% Lower Bound & 95% Upper Bound \tabularnewline
61 & 1244.68194867836 & 561.971603604106 & 1927.39229375260 \tabularnewline
62 & 960.496174209674 & 143.389829012212 & 1777.60251940714 \tabularnewline
63 & 724.153742216713 & -158.87865004749 & 1607.18613448091 \tabularnewline
64 & 1560.72603964466 & -331.275912624212 & 3452.72799191354 \tabularnewline
65 & 2611.86068960467 & -649.329843687843 & 5873.05122289719 \tabularnewline
66 & 3815.91764761312 & -1095.80710359984 & 8727.64239882609 \tabularnewline
67 & 3207.60637079217 & -1076.64551685901 & 7491.85825844334 \tabularnewline
68 & 2760.52415725046 & -1072.73212523263 & 6593.78043973356 \tabularnewline
69 & 2473.99289193048 & -1101.44868362714 & 6049.4344674881 \tabularnewline
70 & 2271.16634397577 & -1147.36078808421 & 5689.69347603576 \tabularnewline
71 & 2084.18226056431 & -1186.62190441156 & 5354.98642554018 \tabularnewline
72 & 1922.31883787362 & -1151.61036806363 & 4996.24804381086 \tabularnewline
\hline
\end{tabular}
%Source: https://freestatistics.org/blog/index.php?pk=63108&T=3

[TABLE]
[ROW][C]Extrapolation Forecasts of Exponential Smoothing[/C][/ROW]
[ROW][C]t[/C][C]Forecast[/C][C]95% Lower Bound[/C][C]95% Upper Bound[/C][/ROW]
[ROW][C]61[/C][C]1244.68194867836[/C][C]561.971603604106[/C][C]1927.39229375260[/C][/ROW]
[ROW][C]62[/C][C]960.496174209674[/C][C]143.389829012212[/C][C]1777.60251940714[/C][/ROW]
[ROW][C]63[/C][C]724.153742216713[/C][C]-158.87865004749[/C][C]1607.18613448091[/C][/ROW]
[ROW][C]64[/C][C]1560.72603964466[/C][C]-331.275912624212[/C][C]3452.72799191354[/C][/ROW]
[ROW][C]65[/C][C]2611.86068960467[/C][C]-649.329843687843[/C][C]5873.05122289719[/C][/ROW]
[ROW][C]66[/C][C]3815.91764761312[/C][C]-1095.80710359984[/C][C]8727.64239882609[/C][/ROW]
[ROW][C]67[/C][C]3207.60637079217[/C][C]-1076.64551685901[/C][C]7491.85825844334[/C][/ROW]
[ROW][C]68[/C][C]2760.52415725046[/C][C]-1072.73212523263[/C][C]6593.78043973356[/C][/ROW]
[ROW][C]69[/C][C]2473.99289193048[/C][C]-1101.44868362714[/C][C]6049.4344674881[/C][/ROW]
[ROW][C]70[/C][C]2271.16634397577[/C][C]-1147.36078808421[/C][C]5689.69347603576[/C][/ROW]
[ROW][C]71[/C][C]2084.18226056431[/C][C]-1186.62190441156[/C][C]5354.98642554018[/C][/ROW]
[ROW][C]72[/C][C]1922.31883787362[/C][C]-1151.61036806363[/C][C]4996.24804381086[/C][/ROW]
[/TABLE]
Source: https://freestatistics.org/blog/index.php?pk=63108&T=3

Globally Unique Identifier (entire table): ba.freestatistics.org/blog/index.php?pk=63108&T=3

As an alternative you can also use a QR Code:  

The GUIDs for individual cells are displayed in the table below:

Extrapolation Forecasts of Exponential Smoothing
tForecast95% Lower Bound95% Upper Bound
611244.68194867836561.9716036041061927.39229375260
62960.496174209674143.3898290122121777.60251940714
63724.153742216713-158.878650047491607.18613448091
641560.72603964466-331.2759126242123452.72799191354
652611.86068960467-649.3298436878435873.05122289719
663815.91764761312-1095.807103599848727.64239882609
673207.60637079217-1076.645516859017491.85825844334
682760.52415725046-1072.732125232636593.78043973356
692473.99289193048-1101.448683627146049.4344674881
702271.16634397577-1147.360788084215689.69347603576
712084.18226056431-1186.621904411565354.98642554018
721922.31883787362-1151.610368063634996.24804381086


Parameters (Session):
par1 = FALSE ; par2 = 0.5 ; par3 = 1 ; par4 = 1 ; par5 = 12 ; par6 = 1 ; par7 = 1 ; par8 = 2 ; par9 = 1 ;
Parameters (R input):
par1 = 12 ; par2 = Triple ; par3 = multiplicative ;
R code (references can be found in the software module):
par1 <- as.numeric(par1)
if (par2 == 'Single') K <- 1
if (par2 == 'Double') K <- 2
if (par2 == 'Triple') K <- par1
nx <- length(x)
nxmK <- nx - K
x <- ts(x, frequency = par1)
if (par2 == 'Single') fit <- HoltWinters(x, gamma=0, beta=0)
if (par2 == 'Double') fit <- HoltWinters(x, gamma=0)
if (par2 == 'Triple') fit <- HoltWinters(x, seasonal=par3)
fit
myresid <- x - fit$fitted[,'xhat']
bitmap(file='test1.png')
op <- par(mfrow=c(2,1))
plot(fit,ylab='Observed (black) / Fitted (red)',main='Interpolation Fit of Exponential Smoothing')
plot(myresid,ylab='Residuals',main='Interpolation Prediction Errors')
par(op)
dev.off()
bitmap(file='test2.png')
p <- predict(fit, par1, prediction.interval=TRUE)
np <- length(p[,1])
plot(fit,p,ylab='Observed (black) / Fitted (red)',main='Extrapolation Fit of Exponential Smoothing')
dev.off()
bitmap(file='test3.png')
op <- par(mfrow = c(2,2))
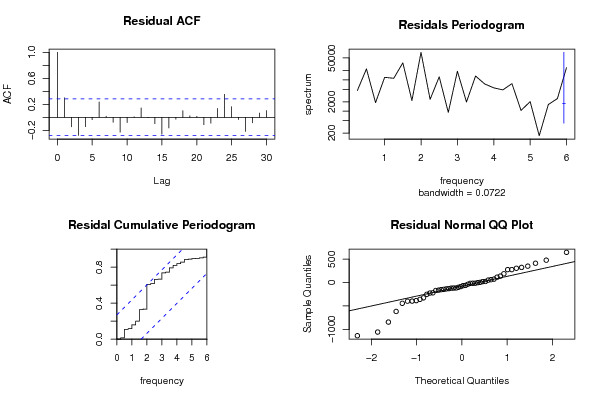
acf(as.numeric(myresid),lag.max = nx/2,main='Residual ACF')
spectrum(myresid,main='Residals Periodogram')
cpgram(myresid,main='Residal Cumulative Periodogram')
qqnorm(myresid,main='Residual Normal QQ Plot')
qqline(myresid)
par(op)
dev.off()
load(file='createtable')
a<-table.start()
a<-table.row.start(a)
a<-table.element(a,'Estimated Parameters of Exponential Smoothing',2,TRUE)
a<-table.row.end(a)
a<-table.row.start(a)
a<-table.element(a,'Parameter',header=TRUE)
a<-table.element(a,'Value',header=TRUE)
a<-table.row.end(a)
a<-table.row.start(a)
a<-table.element(a,'alpha',header=TRUE)
a<-table.element(a,fit$alpha)
a<-table.row.end(a)
a<-table.row.start(a)
a<-table.element(a,'beta',header=TRUE)
a<-table.element(a,fit$beta)
a<-table.row.end(a)
a<-table.row.start(a)
a<-table.element(a,'gamma',header=TRUE)
a<-table.element(a,fit$gamma)
a<-table.row.end(a)
a<-table.end(a)
table.save(a,file='mytable.tab')
a<-table.start()
a<-table.row.start(a)
a<-table.element(a,'Interpolation Forecasts of Exponential Smoothing',4,TRUE)
a<-table.row.end(a)
a<-table.row.start(a)
a<-table.element(a,'t',header=TRUE)
a<-table.element(a,'Observed',header=TRUE)
a<-table.element(a,'Fitted',header=TRUE)
a<-table.element(a,'Residuals',header=TRUE)
a<-table.row.end(a)
for (i in 1:nxmK) {
a<-table.row.start(a)
a<-table.element(a,i+K,header=TRUE)
a<-table.element(a,x[i+K])
a<-table.element(a,fit$fitted[i,'xhat'])
a<-table.element(a,myresid[i])
a<-table.row.end(a)
}
a<-table.end(a)
table.save(a,file='mytable1.tab')
a<-table.start()
a<-table.row.start(a)
a<-table.element(a,'Extrapolation Forecasts of Exponential Smoothing',4,TRUE)
a<-table.row.end(a)
a<-table.row.start(a)
a<-table.element(a,'t',header=TRUE)
a<-table.element(a,'Forecast',header=TRUE)
a<-table.element(a,'95% Lower Bound',header=TRUE)
a<-table.element(a,'95% Upper Bound',header=TRUE)
a<-table.row.end(a)
for (i in 1:np) {
a<-table.row.start(a)
a<-table.element(a,nx+i,header=TRUE)
a<-table.element(a,p[i,'fit'])
a<-table.element(a,p[i,'lwr'])
a<-table.element(a,p[i,'upr'])
a<-table.row.end(a)
}
a<-table.end(a)
table.save(a,file='mytable2.tab')