| Multiple Linear Regression - Estimated Regression Equation |
| Werkl[t] = -37913.5795481944 + 0.167921847385156x[t] + 0.983692389278356`y-1`[t] -0.262137203471688`y-2`[t] + 856.237856090604M1[t] + 1422.34146979028M2[t] + 645.643330794933M3[t] + 7996.00756864989M4[t] + 26773.9655269154M5[t] -109.931030073537M6[t] -10226.4147700189M7[t] -153.278421988093M8[t] -1876.05346206772M9[t] + 7808.93801645004M10[t] -1.11551941151744M11[t] -54.7353627623493t + e[t] |
| Multiple Linear Regression - Ordinary Least Squares | |||||
| Variable | Parameter | S.D. | T-STAT H0: parameter = 0 | 2-tail p-value | 1-tail p-value |
| (Intercept) | -37913.5795481944 | 24602.591742 | -1.541 | 0.129489 | 0.064745 |
| x | 0.167921847385156 | 0.093463 | 1.7967 | 0.078311 | 0.039156 |
| `y-1` | 0.983692389278356 | 0.155181 | 6.339 | 0 | 0 |
| `y-2` | -0.262137203471688 | 0.14998 | -1.7478 | 0.086514 | 0.043257 |
| M1 | 856.237856090604 | 3091.676439 | 0.2769 | 0.782938 | 0.391469 |
| M2 | 1422.34146979028 | 3123.560735 | 0.4554 | 0.650784 | 0.325392 |
| M3 | 645.643330794933 | 3281.633294 | 0.1967 | 0.844809 | 0.422405 |
| M4 | 7996.00756864989 | 3115.899663 | 2.5662 | 0.013262 | 0.006631 |
| M5 | 26773.9655269154 | 5380.796392 | 4.9758 | 8e-06 | 4e-06 |
| M6 | -109.931030073537 | 5995.742542 | -0.0183 | 0.985443 | 0.492722 |
| M7 | -10226.4147700189 | 3436.071346 | -2.9762 | 0.004454 | 0.002227 |
| M8 | -153.278421988093 | 3999.797006 | -0.0383 | 0.969581 | 0.48479 |
| M9 | -1876.05346206772 | 3544.949911 | -0.5292 | 0.59895 | 0.299475 |
| M10 | 7808.93801645004 | 3302.655746 | 2.3644 | 0.021902 | 0.010951 |
| M11 | -1.11551941151744 | 3287.674264 | -3e-04 | 0.999731 | 0.499865 |
| t | -54.7353627623493 | 55.020009 | -0.9948 | 0.324517 | 0.162259 |
| Multiple Linear Regression - Regression Statistics | |
| Multiple R | 0.988435732988545 |
| R-squared | 0.977005198248602 |
| Adjusted R-squared | 0.970242021262897 |
| F-TEST (value) | 144.45950480279 |
| F-TEST (DF numerator) | 15 |
| F-TEST (DF denominator) | 51 |
| p-value | 0 |
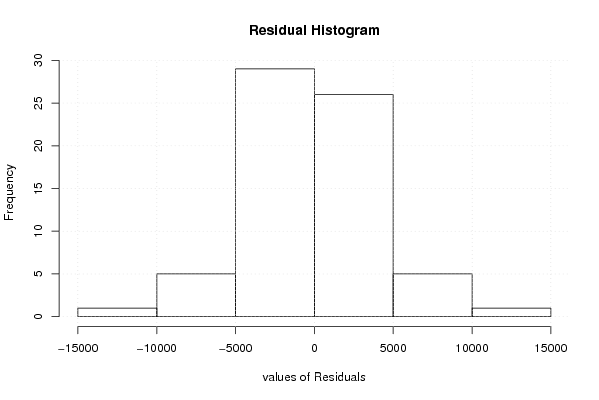
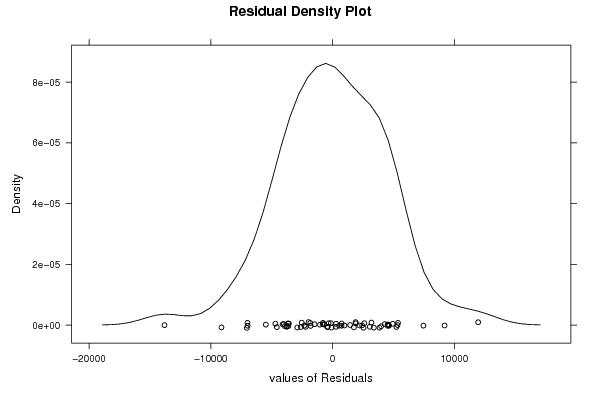
| Multiple Linear Regression - Residual Statistics | |
| Residual Standard Deviation | 4996.85437277711 |
| Sum Squared Residuals | 1273396234.75983 |
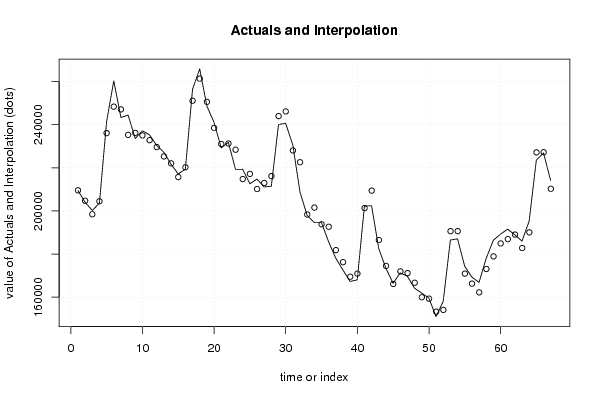
| Multiple Linear Regression - Actuals, Interpolation, and Residuals | |||
| Time or Index | Actuals | Interpolation Forecast | Residuals Prediction Error |
| 1 | 209465 | 209561.228590528 | -96.2285905275284 |
| 2 | 204045 | 204741.466955078 | -696.4669550782 |
| 3 | 200237 | 198494.076400831 | 1742.92359916866 |
| 4 | 203666 | 204482.194695522 | -816.194695522485 |
| 5 | 241476 | 236108.490186626 | 5367.50981337371 |
| 6 | 260307 | 248358.196230774 | 11948.8037692263 |
| 7 | 243324 | 247110.136264965 | -3786.13626496471 |
| 8 | 244460 | 235269.732463264 | 9190.26753673597 |
| 9 | 233575 | 236180.537605615 | -2605.53760561483 |
| 10 | 237217 | 235021.629618516 | 2195.37038148382 |
| 11 | 235243 | 232822.218503783 | 2420.78149621709 |
| 12 | 230354 | 229622.554323738 | 731.445676261644 |
| 13 | 227184 | 225300.862499134 | 1883.13750086607 |
| 14 | 221678 | 222073.295976653 | -395.295976652897 |
| 15 | 217142 | 215708.876207892 | 1433.12379210799 |
| 16 | 219452 | 220249.776991623 | -797.77699162257 |
| 17 | 256446 | 251117.118324051 | 5328.88167594948 |
| 18 | 265845 | 261332.060847585 | 4512.93915241516 |
| 19 | 248624 | 250599.577761978 | -1975.57776197764 |
| 20 | 241114 | 238507.923965441 | 2606.07603455865 |
| 21 | 229245 | 231050.670664757 | -1805.67066475674 |
| 22 | 231805 | 231265.812459148 | 539.187540852268 |
| 23 | 219277 | 228403.730288793 | -9126.73028879309 |
| 24 | 219313 | 214795.153668799 | 4517.84633120140 |
| 25 | 212610 | 217191.062835046 | -4581.06283504648 |
| 26 | 214771 | 210159.949247053 | 4611.05075294656 |
| 27 | 211142 | 212971.252431636 | -1829.25243163623 |
| 28 | 211457 | 216158.626077849 | -4701.62607784869 |
| 29 | 240048 | 243972.363821706 | -3924.36382170613 |
| 30 | 240636 | 246124.075956097 | -5488.07595609693 |
| 31 | 230580 | 228046.939747185 | 2533.06025281487 |
| 32 | 208795 | 222596.829016315 | -13801.8290163150 |
| 33 | 197922 | 198350.997844826 | -428.997844825983 |
| 34 | 194596 | 201574.263385931 | -6978.26338593104 |
| 35 | 194581 | 193842.409353981 | 738.590646019228 |
| 36 | 185686 | 192677.522568489 | -6991.5225684888 |
| 37 | 178106 | 181847.948057314 | -3741.94805731378 |
| 38 | 172608 | 176268.416112548 | -3660.41611254765 |
| 39 | 167302 | 169516.796845914 | -2214.79684591444 |
| 40 | 168053 | 170955.983464945 | -2902.98346494474 |
| 41 | 202300 | 201330.027793155 | 969.972206844983 |
| 42 | 202388 | 209432.79481873 | -7044.79481873001 |
| 43 | 182516 | 186519.608191053 | -4003.60819105272 |
| 44 | 173476 | 174517.529954869 | -1041.52995486892 |
| 45 | 166444 | 166164.344960978 | 279.655039021949 |
| 46 | 171297 | 171987.867705375 | -690.86770537542 |
| 47 | 169701 | 171187.630588166 | -1486.63058816635 |
| 48 | 164182 | 166719.969429707 | -2537.96942970671 |
| 49 | 161914 | 160002.260125262 | 1911.73987473831 |
| 50 | 159612 | 159329.863188347 | 282.136811653336 |
| 51 | 151001 | 153321.281279458 | -2320.28127945761 |
| 52 | 158114 | 154130.596183914 | 3983.40381608574 |
| 53 | 186530 | 190638.348128768 | -4108.34812876756 |
| 54 | 187069 | 190662.77796118 | -3593.77796118002 |
| 55 | 174330 | 170945.740980101 | 3384.25901989892 |
| 56 | 169362 | 166314.984600111 | 3047.01539988933 |
| 57 | 166827 | 162266.448923824 | 4560.55107617561 |
| 58 | 178037 | 173102.426831030 | 4934.57316897038 |
| 59 | 186412 | 178958.011265277 | 7453.98873472312 |
| 60 | 189226 | 184945.800009268 | 4280.19999073248 |
| 61 | 191563 | 186938.637892717 | 4624.36210728341 |
| 62 | 188906 | 189047.008520321 | -141.008520321151 |
| 63 | 186005 | 182816.716834268 | 3188.28316573162 |
| 64 | 195309 | 190073.822586147 | 5235.17741385274 |
| 65 | 223532 | 227165.651745694 | -3633.65174569448 |
| 66 | 226899 | 227234.094185635 | -335.094185634512 |
| 67 | 214126 | 210277.997054719 | 3848.00294528128 |
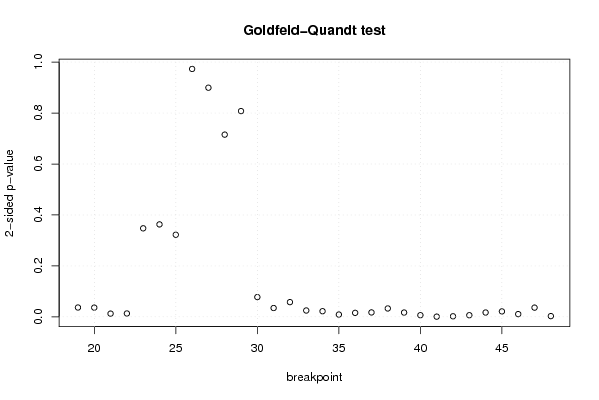
| Goldfeld-Quandt test for Heteroskedasticity | |||
| p-values | Alternative Hypothesis | ||
| breakpoint index | greater | 2-sided | less |
| 19 | 0.0183002867240648 | 0.0366005734481295 | 0.981699713275935 |
| 20 | 0.0180782783603871 | 0.0361565567207741 | 0.981921721639613 |
| 21 | 0.00626333974865208 | 0.0125266794973042 | 0.993736660251348 |
| 22 | 0.00660126009128533 | 0.0132025201825707 | 0.993398739908715 |
| 23 | 0.173771737021593 | 0.347543474043186 | 0.826228262978407 |
| 24 | 0.181470550125243 | 0.362941100250486 | 0.818529449874757 |
| 25 | 0.161119876550444 | 0.322239753100889 | 0.838880123449556 |
| 26 | 0.513402138448295 | 0.97319572310341 | 0.486597861551705 |
| 27 | 0.449791180164339 | 0.899582360328679 | 0.55020881983566 |
| 28 | 0.357673836074425 | 0.71534767214885 | 0.642326163925575 |
| 29 | 0.596115230800752 | 0.807769538398495 | 0.403884769199248 |
| 30 | 0.961247379020376 | 0.0775052419592484 | 0.0387526209796242 |
| 31 | 0.982731193232279 | 0.0345376135354421 | 0.0172688067677211 |
| 32 | 0.97109954541039 | 0.05780090917922 | 0.02890045458961 |
| 33 | 0.987560697773815 | 0.02487860445237 | 0.012439302226185 |
| 34 | 0.988949127687506 | 0.0221017446249891 | 0.0110508723124945 |
| 35 | 0.99550683100598 | 0.00898633798803914 | 0.00449316899401957 |
| 36 | 0.992149268260826 | 0.0157014634783478 | 0.0078507317391739 |
| 37 | 0.991357160432364 | 0.0172856791352727 | 0.00864283956763636 |
| 38 | 0.983531396289012 | 0.0329372074219753 | 0.0164686037109877 |
| 39 | 0.991575753574717 | 0.0168484928505664 | 0.00842424642528322 |
| 40 | 0.99679437857408 | 0.00641124285184015 | 0.00320562142592007 |
| 41 | 0.999640693447595 | 0.000718613104810173 | 0.000359306552405086 |
| 42 | 0.998945980162276 | 0.00210803967544833 | 0.00105401983772417 |
| 43 | 0.996820939149883 | 0.0063581217002347 | 0.00317906085011735 |
| 44 | 0.99155936472354 | 0.0168812705529203 | 0.00844063527646015 |
| 45 | 0.989353983475544 | 0.0212920330489121 | 0.0106460165244560 |
| 46 | 0.994636036783788 | 0.0107279264324235 | 0.00536396321621177 |
| 47 | 0.981950607500409 | 0.0360987849991821 | 0.0180493924995911 |
| 48 | 0.99857916414625 | 0.00284167170749937 | 0.00142083585374969 |
| Meta Analysis of Goldfeld-Quandt test for Heteroskedasticity | |||
| Description | # significant tests | % significant tests | OK/NOK |
| 1% type I error level | 6 | 0.2 | NOK |
| 5% type I error level | 21 | 0.7 | NOK |
| 10% type I error level | 23 | 0.766666666666667 | NOK |