| Multiple Linear Regression - Estimated Regression Equation |
| Uitvoer[t] = + 14842.0402857143 -5214.89071428572Crisis[t] -1306.06046428573M1[t] + 2145.65792857143M2[t] + 2861.93446428572M3[t] + 2211.21285714286M4[t] -324.008749999997M5[t] + 717.029642857146M6[t] + 816.348035714288M7[t] + 2731.02642857143M8[t] + 788.644821428573M9[t] + 559.963214285717M10[t] + 2455.86160714286M11[t] + 115.061607142857t + e[t] |
| Multiple Linear Regression - Ordinary Least Squares | |||||
| Variable | Parameter | S.D. | T-STAT H0: parameter = 0 | 2-tail p-value | 1-tail p-value |
| (Intercept) | 14842.0402857143 | 536.877402 | 27.6451 | 0 | 0 |
| Crisis | -5214.89071428572 | 458.128325 | -11.383 | 0 | 0 |
| M1 | -1306.06046428573 | 631.747842 | -2.0674 | 0.044351 | 0.022176 |
| M2 | 2145.65792857143 | 631.05533 | 3.4001 | 0.001402 | 0.000701 |
| M3 | 2861.93446428572 | 632.178356 | 4.5271 | 4.2e-05 | 2.1e-05 |
| M4 | 2211.21285714286 | 630.870532 | 3.505 | 0.00103 | 0.000515 |
| M5 | -324.008749999997 | 629.714314 | -0.5145 | 0.609343 | 0.304671 |
| M6 | 717.029642857146 | 628.710539 | 1.1405 | 0.259991 | 0.129996 |
| M7 | 816.348035714288 | 627.859937 | 1.3002 | 0.200007 | 0.100004 |
| M8 | 2731.02642857143 | 627.163131 | 4.3546 | 7.4e-05 | 3.7e-05 |
| M9 | 788.644821428573 | 626.620636 | 1.2586 | 0.214537 | 0.107268 |
| M10 | 559.963214285717 | 626.232852 | 0.8942 | 0.375882 | 0.187941 |
| M11 | 2455.86160714286 | 626.000066 | 3.9231 | 0.00029 | 0.000145 |
| t | 115.061607142857 | 9.857352 | 11.6727 | 0 | 0 |
| Multiple Linear Regression - Regression Statistics | |
| Multiple R | 0.920344285580731 |
| R-squared | 0.847033604001107 |
| Adjusted R-squared | 0.803803970349246 |
| F-TEST (value) | 19.5938186944279 |
| F-TEST (DF numerator) | 13 |
| F-TEST (DF denominator) | 46 |
| p-value | 1.62092561595273e-14 |
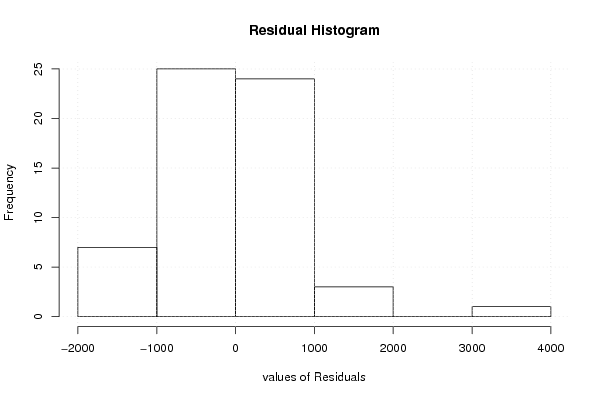
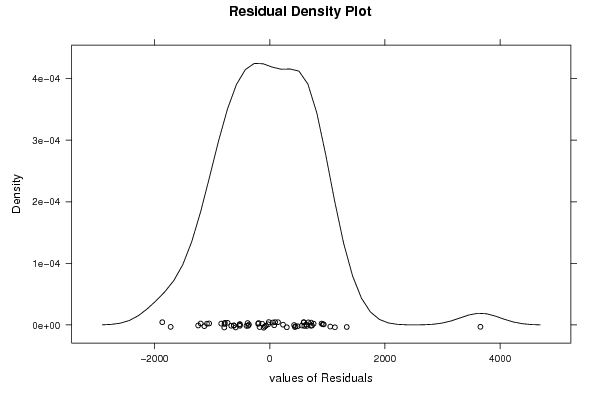
| Multiple Linear Regression - Residual Statistics | |
| Residual Standard Deviation | 989.670292566894 |
| Sum Squared Residuals | 45054575.2475143 |
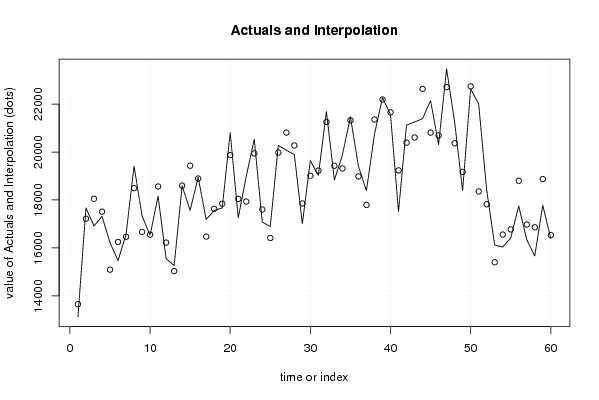
| Multiple Linear Regression - Actuals, Interpolation, and Residuals | |||
| Time or Index | Actuals | Interpolation Forecast | Residuals Prediction Error |
| 1 | 13132.1 | 13651.0414285715 | -518.941428571466 |
| 2 | 17665.9 | 17217.8214285714 | 448.078571428573 |
| 3 | 16913 | 18049.1595714286 | -1136.15957142856 |
| 4 | 17318.8 | 17513.4995714286 | -194.699571428571 |
| 5 | 16224.2 | 15093.3395714286 | 1130.86042857143 |
| 6 | 15469.6 | 16249.4395714286 | -779.839571428568 |
| 7 | 16557.5 | 16463.8195714286 | 93.6804285714297 |
| 8 | 19414.8 | 18493.5595714286 | 921.24042857143 |
| 9 | 17335 | 16666.2395714286 | 668.76042857143 |
| 10 | 16525.2 | 16552.6195714286 | -27.4195714285682 |
| 11 | 18160.4 | 18563.5795714286 | -403.179571428567 |
| 12 | 15553.8 | 16222.7795714286 | -668.979571428568 |
| 13 | 15262.2 | 15031.7807142857 | 230.419285714298 |
| 14 | 18581 | 18598.5607142857 | -17.5607142857161 |
| 15 | 17564.1 | 19429.8988571429 | -1865.79885714286 |
| 16 | 18948.6 | 18894.2388571429 | 54.3611428571423 |
| 17 | 17187.8 | 16474.0788571429 | 713.721142857143 |
| 18 | 17564.8 | 17630.1788571429 | -65.3788571428581 |
| 19 | 17668.4 | 17844.5588571429 | -176.158857142855 |
| 20 | 20811.7 | 19874.2988571429 | 937.401142857145 |
| 21 | 17257.8 | 18046.9788571429 | -789.178857142857 |
| 22 | 18984.2 | 17933.3588571429 | 1050.84114285714 |
| 23 | 20532.6 | 19944.3188571429 | 588.281142857142 |
| 24 | 17082.3 | 17603.5188571429 | -521.218857142855 |
| 25 | 16894.9 | 16412.52 | 482.380000000012 |
| 26 | 20274.9 | 19979.3 | 295.600000000002 |
| 27 | 20078.6 | 20810.6381428571 | -732.038142857146 |
| 28 | 19900.9 | 20274.9781428571 | -374.078142857142 |
| 29 | 17012.2 | 17854.8181428571 | -842.618142857144 |
| 30 | 19642.9 | 19010.9181428571 | 631.981857142856 |
| 31 | 19024 | 19225.2981428571 | -201.298142857144 |
| 32 | 21691 | 21255.0381428571 | 435.961857142856 |
| 33 | 18835.9 | 19427.7181428571 | -591.818142857143 |
| 34 | 19873.4 | 19314.0981428571 | 559.301857142856 |
| 35 | 21468.2 | 21325.0581428571 | 143.141857142856 |
| 36 | 19406.8 | 18984.2581428571 | 422.541857142856 |
| 37 | 18385.3 | 17793.2592857143 | 592.040714285722 |
| 38 | 20739.3 | 21360.0392857143 | -620.739285714287 |
| 39 | 22268.3 | 22191.3774285714 | 76.9225714285666 |
| 40 | 21569 | 21655.7174285714 | -86.7174285714308 |
| 41 | 17514.8 | 19235.5574285714 | -1720.75742857143 |
| 42 | 21124.7 | 20391.6574285714 | 733.04257142857 |
| 43 | 21251 | 20606.0374285714 | 644.962571428569 |
| 44 | 21393 | 22635.7774285714 | -1242.77742857143 |
| 45 | 22145.2 | 20808.4574285714 | 1336.74257142857 |
| 46 | 20310.5 | 20694.8374285714 | -384.337428571430 |
| 47 | 23466.9 | 22705.7974285714 | 761.10257142857 |
| 48 | 21264.6 | 20364.9974285714 | 899.60257142857 |
| 49 | 18388.1 | 19173.9985714286 | -785.898571428566 |
| 50 | 22635.4 | 22740.7785714286 | -105.378571428573 |
| 51 | 22014.3 | 18357.226 | 3657.074 |
| 52 | 18422.7 | 17821.566 | 601.134000000001 |
| 53 | 16120.2 | 15401.406 | 718.794 |
| 54 | 16037.7 | 16557.506 | -519.806 |
| 55 | 16410.7 | 16771.886 | -361.185999999999 |
| 56 | 17749.8 | 18801.626 | -1051.82600000000 |
| 57 | 16349.8 | 16974.306 | -624.506000000001 |
| 58 | 15662.3 | 16860.686 | -1198.38600000000 |
| 59 | 17782.3 | 18871.646 | -1089.34600000000 |
| 60 | 16398.9 | 16530.846 | -131.945999999997 |
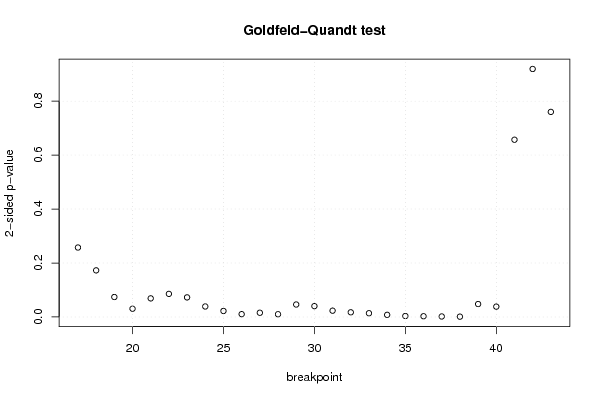
| Goldfeld-Quandt test for Heteroskedasticity | |||
| p-values | Alternative Hypothesis | ||
| breakpoint index | greater | 2-sided | less |
| 17 | 0.128722209840705 | 0.257444419681411 | 0.871277790159295 |
| 18 | 0.0863798372517452 | 0.172759674503490 | 0.913620162748255 |
| 19 | 0.0369792862610909 | 0.0739585725221819 | 0.96302071373891 |
| 20 | 0.0153069292160224 | 0.0306138584320447 | 0.984693070783978 |
| 21 | 0.0344899884381338 | 0.0689799768762677 | 0.965510011561866 |
| 22 | 0.0427963473997935 | 0.085592694799587 | 0.957203652600206 |
| 23 | 0.0363303254157758 | 0.0726606508315516 | 0.963669674584224 |
| 24 | 0.0194607171334425 | 0.038921434266885 | 0.980539282866558 |
| 25 | 0.0111303371322091 | 0.0222606742644183 | 0.98886966286779 |
| 26 | 0.00522764480384354 | 0.0104552896076871 | 0.994772355196156 |
| 27 | 0.00784437536615896 | 0.0156887507323179 | 0.99215562463384 |
| 28 | 0.00509779149528522 | 0.0101955829905704 | 0.994902208504715 |
| 29 | 0.0231092733771011 | 0.0462185467542022 | 0.9768907266229 |
| 30 | 0.0200901998487483 | 0.0401803996974966 | 0.979909800151252 |
| 31 | 0.0116793341784052 | 0.0233586683568103 | 0.988320665821595 |
| 32 | 0.00867712635546938 | 0.0173542527109388 | 0.99132287364453 |
| 33 | 0.00694403744773601 | 0.0138880748954720 | 0.993055962552264 |
| 34 | 0.00398105957213507 | 0.00796211914427014 | 0.996018940427865 |
| 35 | 0.00178675016884898 | 0.00357350033769796 | 0.99821324983115 |
| 36 | 0.00138006879223453 | 0.00276013758446906 | 0.998619931207765 |
| 37 | 0.00092370081827114 | 0.00184740163654228 | 0.999076299181729 |
| 38 | 0.000609768549411121 | 0.00121953709882224 | 0.999390231450589 |
| 39 | 0.0239771071100782 | 0.0479542142201563 | 0.976022892889922 |
| 40 | 0.0191831765208521 | 0.0383663530417043 | 0.980816823479148 |
| 41 | 0.671518805034876 | 0.656962389930247 | 0.328481194965124 |
| 42 | 0.540369884813941 | 0.919260230372119 | 0.459630115186059 |
| 43 | 0.380022820844370 | 0.760045641688739 | 0.61997717915563 |
| Meta Analysis of Goldfeld-Quandt test for Heteroskedasticity | |||
| Description | # significant tests | % significant tests | OK/NOK |
| 1% type I error level | 5 | 0.185185185185185 | NOK |
| 5% type I error level | 18 | 0.666666666666667 | NOK |
| 10% type I error level | 22 | 0.814814814814815 | NOK |