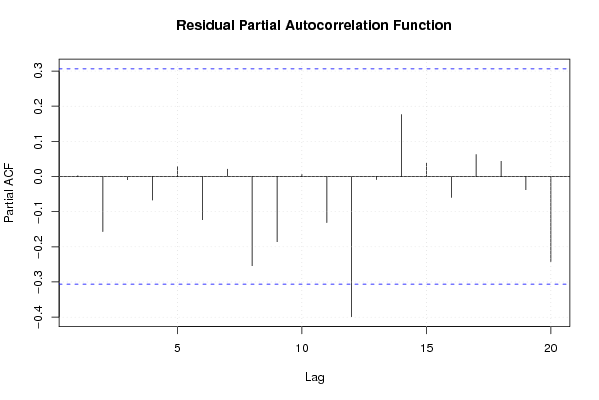
| Multiple Linear Regression - Estimated Regression Equation |
| WINS[t] = -65.0727521149872 + 740.308810456642OBP[t] -27.3151188564579ERA[t] + 0.394195599619473t + e[t] |
| Multiple Linear Regression - Ordinary Least Squares | |||||
| Variable | Parameter | S.D. | T-STAT H0: parameter = 0 | 2-tail p-value | 1-tail p-value |
| (Intercept) | -65.0727521149872 | 38.281106 | -1.6999 | 0.097549 | 0.048775 |
| OBP | 740.308810456642 | 112.351745 | 6.5892 | 0 | 0 |
| ERA | -27.3151188564579 | 4.340911 | -6.2925 | 0 | 0 |
| t | 0.394195599619473 | 0.168953 | 2.3332 | 0.025183 | 0.012592 |
| Multiple Linear Regression - Regression Statistics | |
| Multiple R | 0.840583294456203 |
| R-squared | 0.706580274918843 |
| Adjusted R-squared | 0.68278948639875 |
| F-TEST (value) | 29.6997417434089 |
| F-TEST (DF numerator) | 3 |
| F-TEST (DF denominator) | 37 |
| p-value | 5.92074611560633e-10 |
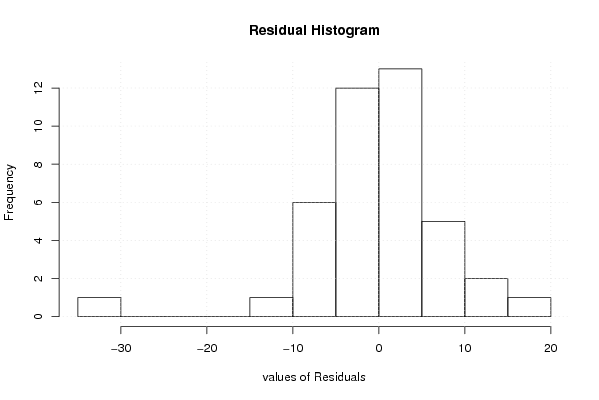
| Multiple Linear Regression - Residual Statistics | |
| Residual Standard Deviation | 7.99893167627598 |
| Sum Squared Residuals | 2367.36759458406 |
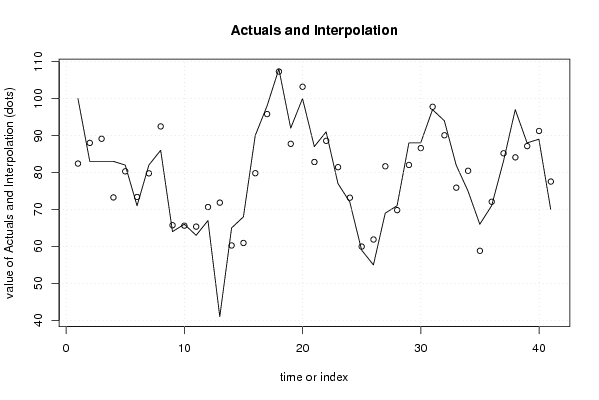
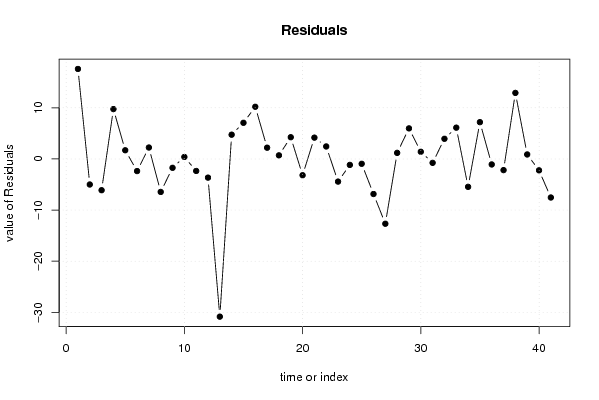
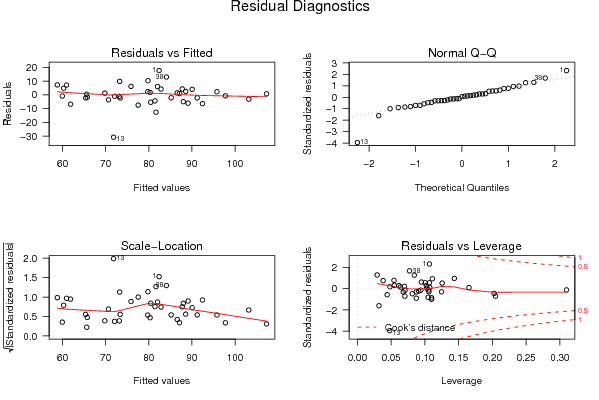
| Multiple Linear Regression - Actuals, Interpolation, and Residuals | |||
| Time or Index | Actuals | Interpolation Forecast | Residuals Prediction Error |
| 1 | 100 | 82.4046605349257 | 17.5953394650743 |
| 2 | 83 | 88.0013129115338 | -5.00131291153377 |
| 3 | 83 | 89.1155222178176 | -6.11552221781763 |
| 4 | 83 | 73.2509300007137 | 9.74906999928627 |
| 5 | 82 | 80.307904894443 | 1.69209510555701 |
| 6 | 71 | 73.3704462352026 | -2.37044623520262 |
| 7 | 82 | 79.7662570737123 | 2.23374292628767 |
| 8 | 86 | 92.4522561587379 | -6.45225615873787 |
| 9 | 64 | 65.7330502447574 | -1.73305024475740 |
| 10 | 66 | 65.616660390101 | 0.383339609898989 |
| 11 | 63 | 65.3496919345009 | -2.34969193450094 |
| 12 | 67 | 70.6528980187523 | -3.65289801875233 |
| 13 | 41 | 71.8385411707428 | -30.8385411707428 |
| 14 | 65 | 60.2575123059045 | 4.74248769409545 |
| 15 | 68 | 60.9325700036191 | 7.0674299963809 |
| 16 | 90 | 79.7987689418013 | 10.2012310581987 |
| 17 | 98 | 95.7982992124551 | 2.20170078754485 |
| 18 | 108 | 107.297126968924 | 0.70287303107574 |
| 19 | 92 | 87.7512858033294 | 4.24871419667056 |
| 20 | 100 | 103.184218593062 | -3.18421859306179 |
| 21 | 87 | 82.8343456808342 | 4.16565431916575 |
| 22 | 91 | 88.5612815545939 | 2.43871844540609 |
| 23 | 77 | 81.429816462026 | -4.42981646202605 |
| 24 | 72 | 73.1700296923466 | -1.17002969234659 |
| 25 | 59 | 59.9500936961209 | -0.950093696120904 |
| 26 | 55 | 61.860623839507 | -6.86062383950696 |
| 27 | 69 | 81.6688489310038 | -12.6688489310038 |
| 28 | 71 | 69.814668877601 | 1.18533112239895 |
| 29 | 88 | 82.025799431204 | 5.97420056879599 |
| 30 | 88 | 86.5964076145293 | 1.40359238547073 |
| 31 | 97 | 97.763234530989 | -0.763234530988965 |
| 32 | 94 | 90.0574610479691 | 3.94253895203085 |
| 33 | 82 | 75.8829147041671 | 6.11708529583291 |
| 34 | 75 | 80.4535228874924 | -5.45352288749235 |
| 35 | 66 | 58.8093278781485 | 7.1906721218515 |
| 36 | 71 | 72.0773462631565 | -1.07734626315651 |
| 37 | 83 | 85.1870751376903 | -2.18707513769031 |
| 38 | 97 | 84.0852312973355 | 12.9147687026645 |
| 39 | 88 | 87.1240831178332 | 0.875916882166853 |
| 40 | 89 | 91.2275336792663 | -2.22753367926633 |
| 41 | 70 | 77.5404400611486 | -7.54044006114858 |
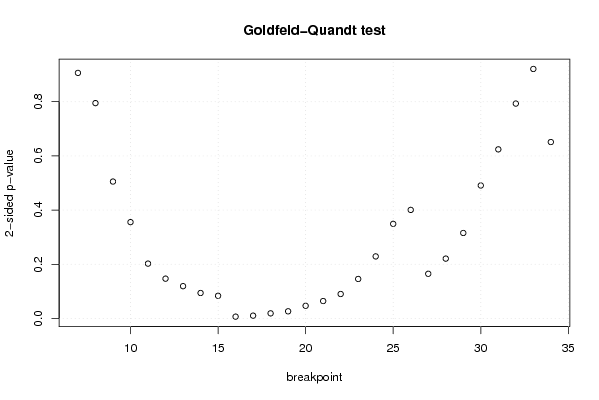
| Goldfeld-Quandt test for Heteroskedasticity | |||
| p-values | Alternative Hypothesis | ||
| breakpoint index | greater | 2-sided | less |
| 7 | 0.546864631607323 | 0.906270736785353 | 0.453135368392677 |
| 8 | 0.397429348668238 | 0.794858697336476 | 0.602570651331762 |
| 9 | 0.252678132050648 | 0.505356264101295 | 0.747321867949352 |
| 10 | 0.177816287871921 | 0.355632575743843 | 0.822183712128079 |
| 11 | 0.101199972494815 | 0.20239994498963 | 0.898800027505185 |
| 12 | 0.0734640959274305 | 0.146928191854861 | 0.92653590407257 |
| 13 | 0.9403767287988 | 0.119246542402401 | 0.0596232712012005 |
| 14 | 0.952967500905792 | 0.0940649981884158 | 0.0470324990942079 |
| 15 | 0.958169417243266 | 0.083661165513468 | 0.041830582756734 |
| 16 | 0.996639846659987 | 0.0067203066800259 | 0.00336015334001295 |
| 17 | 0.994810613034049 | 0.0103787739319027 | 0.00518938696595134 |
| 18 | 0.990524054176932 | 0.0189518916461358 | 0.00947594582306788 |
| 19 | 0.98679013092146 | 0.0264197381570786 | 0.0132098690785393 |
| 20 | 0.976609250439375 | 0.0467814991212509 | 0.0233907495606254 |
| 21 | 0.967825512437515 | 0.0643489751249701 | 0.0321744875624850 |
| 22 | 0.954835793572823 | 0.0903284128543534 | 0.0451642064271767 |
| 23 | 0.927124959346952 | 0.145750081306097 | 0.0728750406530483 |
| 24 | 0.885470468974996 | 0.229059062050008 | 0.114529531025004 |
| 25 | 0.82537921905492 | 0.34924156189016 | 0.17462078094508 |
| 26 | 0.799639731266075 | 0.400720537467849 | 0.200360268733925 |
| 27 | 0.91756827111693 | 0.164863457766140 | 0.0824317288830702 |
| 28 | 0.889537791506494 | 0.220924416987012 | 0.110462208493506 |
| 29 | 0.84221935523279 | 0.315561289534420 | 0.157780644767210 |
| 30 | 0.754579487209996 | 0.490841025580008 | 0.245420512790004 |
| 31 | 0.687900970773805 | 0.62419805845239 | 0.312099029226195 |
| 32 | 0.60343033418691 | 0.79313933162618 | 0.39656966581309 |
| 33 | 0.460473922456701 | 0.920947844913403 | 0.539526077543299 |
| 34 | 0.674400294694962 | 0.651199410610077 | 0.325599705305038 |
| Meta Analysis of Goldfeld-Quandt test for Heteroskedasticity | |||
| Description | # significant tests | % significant tests | OK/NOK |
| 1% type I error level | 1 | 0.0357142857142857 | NOK |
| 5% type I error level | 5 | 0.178571428571429 | NOK |
| 10% type I error level | 9 | 0.321428571428571 | NOK |