| Multiple Linear Regression - Estimated Regression Equation |
| Y[t] = + 8.13958333333333 -1.16458333333333X[t] + e[t] |
| Multiple Linear Regression - Ordinary Least Squares | |||||
| Variable | Parameter | S.D. | T-STAT H0: parameter = 0 | 2-tail p-value | 1-tail p-value |
| (Intercept) | 8.13958333333333 | 0.083857 | 97.0645 | 0 | 0 |
| X | -1.16458333333333 | 0.187511 | -6.2107 | 0 | 0 |
| Multiple Linear Regression - Regression Statistics | |
| Multiple R | 0.6319971943101 |
| R-squared | 0.399420453615838 |
| Adjusted R-squared | 0.389065633850594 |
| F-TEST (value) | 38.573385406136 |
| F-TEST (DF numerator) | 1 |
| F-TEST (DF denominator) | 58 |
| p-value | 6.10789072652551e-08 |
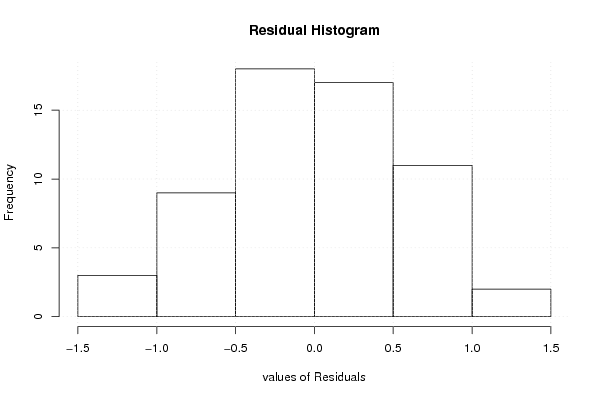
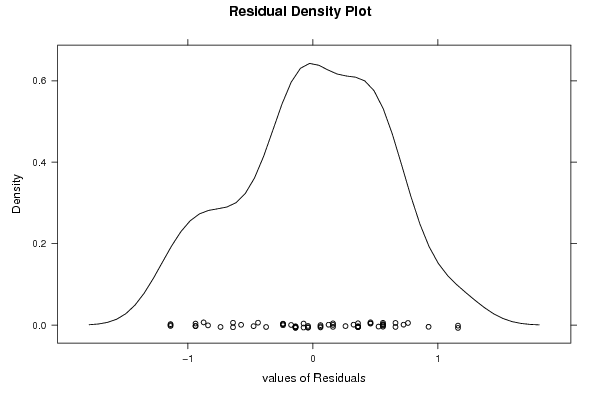
| Multiple Linear Regression - Residual Statistics | |
| Residual Standard Deviation | 0.580981507015716 |
| Sum Squared Residuals | 19.5772916666666 |
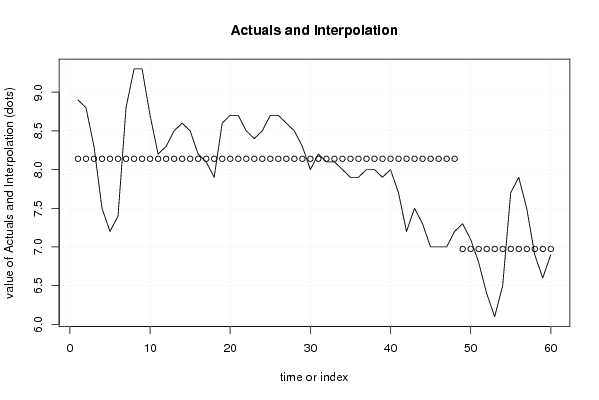
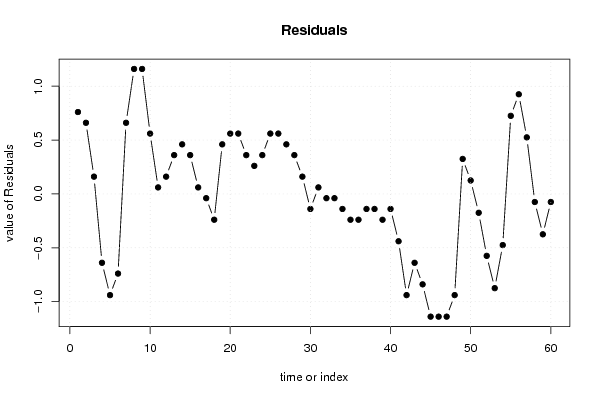
| Multiple Linear Regression - Actuals, Interpolation, and Residuals | |||
| Time or Index | Actuals | Interpolation Forecast | Residuals Prediction Error |
| 1 | 8.9 | 8.13958333333336 | 0.760416666666641 |
| 2 | 8.8 | 8.13958333333333 | 0.660416666666669 |
| 3 | 8.3 | 8.13958333333333 | 0.160416666666668 |
| 4 | 7.5 | 8.13958333333333 | -0.639583333333333 |
| 5 | 7.2 | 8.13958333333333 | -0.939583333333333 |
| 6 | 7.4 | 8.13958333333333 | -0.739583333333332 |
| 7 | 8.8 | 8.13958333333333 | 0.660416666666668 |
| 8 | 9.3 | 8.13958333333333 | 1.16041666666667 |
| 9 | 9.3 | 8.13958333333333 | 1.16041666666667 |
| 10 | 8.7 | 8.13958333333333 | 0.560416666666666 |
| 11 | 8.2 | 8.13958333333333 | 0.0604166666666665 |
| 12 | 8.3 | 8.13958333333333 | 0.160416666666668 |
| 13 | 8.5 | 8.13958333333333 | 0.360416666666667 |
| 14 | 8.6 | 8.13958333333333 | 0.460416666666667 |
| 15 | 8.5 | 8.13958333333333 | 0.360416666666667 |
| 16 | 8.2 | 8.13958333333333 | 0.0604166666666665 |
| 17 | 8.1 | 8.13958333333333 | -0.0395833333333332 |
| 18 | 7.9 | 8.13958333333333 | -0.239583333333333 |
| 19 | 8.6 | 8.13958333333333 | 0.460416666666667 |
| 20 | 8.7 | 8.13958333333333 | 0.560416666666666 |
| 21 | 8.7 | 8.13958333333333 | 0.560416666666666 |
| 22 | 8.5 | 8.13958333333333 | 0.360416666666667 |
| 23 | 8.4 | 8.13958333333333 | 0.260416666666668 |
| 24 | 8.5 | 8.13958333333333 | 0.360416666666667 |
| 25 | 8.7 | 8.13958333333333 | 0.560416666666666 |
| 26 | 8.7 | 8.13958333333333 | 0.560416666666666 |
| 27 | 8.6 | 8.13958333333333 | 0.460416666666667 |
| 28 | 8.5 | 8.13958333333333 | 0.360416666666667 |
| 29 | 8.3 | 8.13958333333333 | 0.160416666666668 |
| 30 | 8 | 8.13958333333333 | -0.139583333333333 |
| 31 | 8.2 | 8.13958333333333 | 0.0604166666666665 |
| 32 | 8.1 | 8.13958333333333 | -0.0395833333333332 |
| 33 | 8.1 | 8.13958333333333 | -0.0395833333333332 |
| 34 | 8 | 8.13958333333333 | -0.139583333333333 |
| 35 | 7.9 | 8.13958333333333 | -0.239583333333333 |
| 36 | 7.9 | 8.13958333333333 | -0.239583333333333 |
| 37 | 8 | 8.13958333333333 | -0.139583333333333 |
| 38 | 8 | 8.13958333333333 | -0.139583333333333 |
| 39 | 7.9 | 8.13958333333333 | -0.239583333333333 |
| 40 | 8 | 8.13958333333333 | -0.139583333333333 |
| 41 | 7.7 | 8.13958333333333 | -0.439583333333333 |
| 42 | 7.2 | 8.13958333333333 | -0.939583333333333 |
| 43 | 7.5 | 8.13958333333333 | -0.639583333333333 |
| 44 | 7.3 | 8.13958333333333 | -0.839583333333333 |
| 45 | 7 | 8.13958333333333 | -1.13958333333333 |
| 46 | 7 | 8.13958333333333 | -1.13958333333333 |
| 47 | 7 | 8.13958333333333 | -1.13958333333333 |
| 48 | 7.2 | 8.13958333333333 | -0.939583333333333 |
| 49 | 7.3 | 6.975 | 0.325 |
| 50 | 7.1 | 6.975 | 0.125000000000000 |
| 51 | 6.8 | 6.975 | -0.175 |
| 52 | 6.4 | 6.975 | -0.575 |
| 53 | 6.1 | 6.975 | -0.875 |
| 54 | 6.5 | 6.975 | -0.475 |
| 55 | 7.7 | 6.975 | 0.725 |
| 56 | 7.9 | 6.975 | 0.925 |
| 57 | 7.5 | 6.975 | 0.525 |
| 58 | 6.9 | 6.975 | -0.0749999999999997 |
| 59 | 6.6 | 6.975 | -0.375 |
| 60 | 6.9 | 6.975 | -0.0749999999999997 |
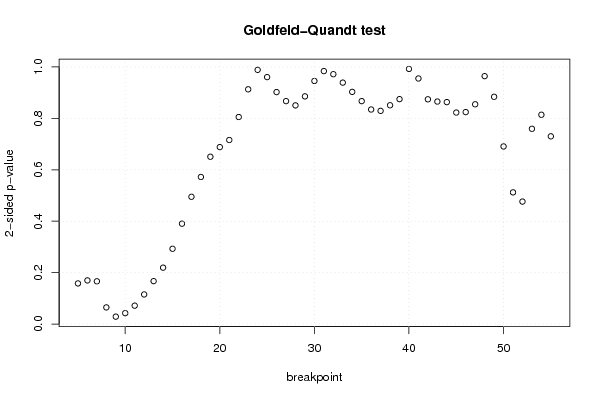
| Goldfeld-Quandt test for Heteroskedasticity | |||
| p-values | Alternative Hypothesis | ||
| breakpoint index | greater | 2-sided | less |
| 5 | 0.920900028545499 | 0.158199942909003 | 0.0790999714545014 |
| 6 | 0.915029542338884 | 0.169940915322232 | 0.0849704576611158 |
| 7 | 0.916765020146124 | 0.166469959707752 | 0.0832349798538762 |
| 8 | 0.967519855709056 | 0.0649602885818875 | 0.0324801442909438 |
| 9 | 0.985509844444822 | 0.028980311110356 | 0.014490155555178 |
| 10 | 0.97868615412584 | 0.0426276917483192 | 0.0213138458741596 |
| 11 | 0.964139658551608 | 0.0717206828967835 | 0.0358603414483918 |
| 12 | 0.942332918748342 | 0.115334162503315 | 0.0576670812516575 |
| 13 | 0.91644733937875 | 0.167105321242499 | 0.0835526606212495 |
| 14 | 0.890235536451572 | 0.219528927096856 | 0.109764463548428 |
| 15 | 0.85350809612099 | 0.29298380775802 | 0.14649190387901 |
| 16 | 0.804763033108088 | 0.390473933783824 | 0.195236966891912 |
| 17 | 0.752426187856406 | 0.495147624287188 | 0.247573812143594 |
| 18 | 0.713964658849598 | 0.572070682300804 | 0.286035341150402 |
| 19 | 0.674597592614608 | 0.650804814770784 | 0.325402407385392 |
| 20 | 0.655814896451309 | 0.688370207097383 | 0.344185103548691 |
| 21 | 0.642090691130587 | 0.715818617738825 | 0.357909308869413 |
| 22 | 0.597425170691013 | 0.805149658617974 | 0.402574829308987 |
| 23 | 0.54350382634983 | 0.91299234730034 | 0.45649617365017 |
| 24 | 0.505653308597814 | 0.988693382804372 | 0.494346691402186 |
| 25 | 0.519772627374613 | 0.960454745250774 | 0.480227372625387 |
| 26 | 0.548896753556475 | 0.90220649288705 | 0.451103246443525 |
| 27 | 0.566454766905962 | 0.867090466188075 | 0.433545233094038 |
| 28 | 0.574707689888277 | 0.850584620223446 | 0.425292310111723 |
| 29 | 0.557192903309045 | 0.88561419338191 | 0.442807096690955 |
| 30 | 0.527242274790356 | 0.945515450419287 | 0.472757725209644 |
| 31 | 0.508025913319986 | 0.983948173360027 | 0.491974086680014 |
| 32 | 0.485878279698655 | 0.97175655939731 | 0.514121720301345 |
| 33 | 0.469492404534103 | 0.938984809068205 | 0.530507595465897 |
| 34 | 0.451521014606312 | 0.903042029212625 | 0.548478985393688 |
| 35 | 0.433501136889183 | 0.867002273778365 | 0.566498863110817 |
| 36 | 0.417235636175256 | 0.834471272350511 | 0.582764363824744 |
| 37 | 0.414596776745127 | 0.829193553490254 | 0.585403223254873 |
| 38 | 0.425508748545049 | 0.851017497090098 | 0.574491251454951 |
| 39 | 0.437417179440686 | 0.874834358881371 | 0.562582820559314 |
| 40 | 0.496093554446248 | 0.992187108892497 | 0.503906445553752 |
| 41 | 0.522408777269904 | 0.955182445460193 | 0.477591222730096 |
| 42 | 0.56293091447487 | 0.87413817105026 | 0.43706908552513 |
| 43 | 0.567277562713854 | 0.865444874572292 | 0.432722437286146 |
| 44 | 0.568380532291037 | 0.863238935417926 | 0.431619467708963 |
| 45 | 0.588676710765876 | 0.822646578468248 | 0.411323289234124 |
| 46 | 0.587814254137407 | 0.824371491725187 | 0.412185745862593 |
| 47 | 0.572621401320372 | 0.854757197359257 | 0.427378598679628 |
| 48 | 0.517900912056687 | 0.964198175886626 | 0.482099087943313 |
| 49 | 0.441958703626813 | 0.883917407253627 | 0.558041296373187 |
| 50 | 0.345399888516658 | 0.690799777033317 | 0.654600111483342 |
| 51 | 0.256149852672976 | 0.512299705345951 | 0.743850147327024 |
| 52 | 0.238246011311241 | 0.476492022622482 | 0.761753988688759 |
| 53 | 0.379771195216744 | 0.759542390433488 | 0.620228804783256 |
| 54 | 0.407071203118371 | 0.814142406236741 | 0.592928796881629 |
| 55 | 0.365102937111075 | 0.730205874222151 | 0.634897062888925 |
| Meta Analysis of Goldfeld-Quandt test for Heteroskedasticity | |||
| Description | # significant tests | % significant tests | OK/NOK |
| 1% type I error level | 0 | 0 | OK |
| 5% type I error level | 2 | 0.0392156862745098 | OK |
| 10% type I error level | 4 | 0.0784313725490196 | OK |