| Multiple Linear Regression - Estimated Regression Equation |
| Werkl[t] = + 8.36169075740133 -0.262638752682671Inflatie[t] + e[t] |
| Multiple Linear Regression - Ordinary Least Squares | |||||
| Variable | Parameter | S.D. | T-STAT H0: parameter = 0 | 2-tail p-value | 1-tail p-value |
| (Intercept) | 8.36169075740133 | 0.366531 | 22.8131 | 0 | 0 |
| Inflatie | -0.262638752682671 | 0.175566 | -1.496 | 0.139996 | 0.069998 |
| Multiple Linear Regression - Regression Statistics | |
| Multiple R | 0.191164899616969 |
| R-squared | 0.036544018845566 |
| Adjusted R-squared | 0.0202142564531180 |
| F-TEST (value) | 2.23787817405514 |
| F-TEST (DF numerator) | 1 |
| F-TEST (DF denominator) | 59 |
| p-value | 0.139995986867343 |
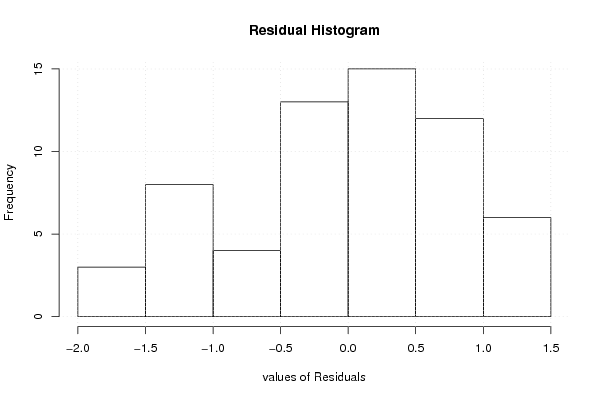
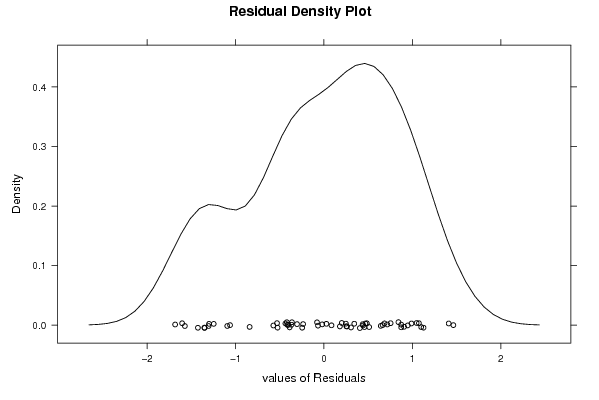
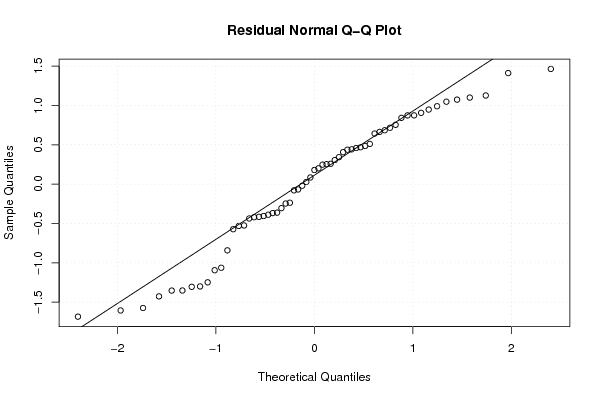
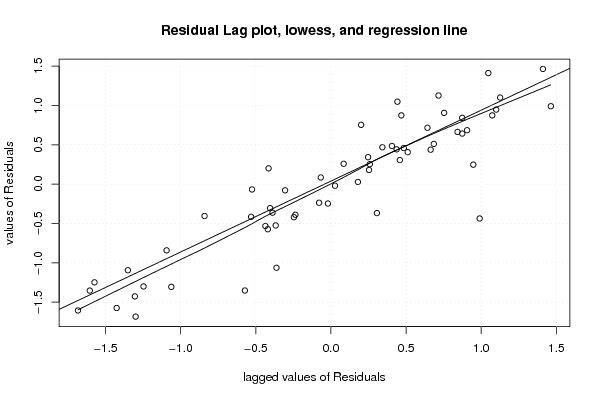
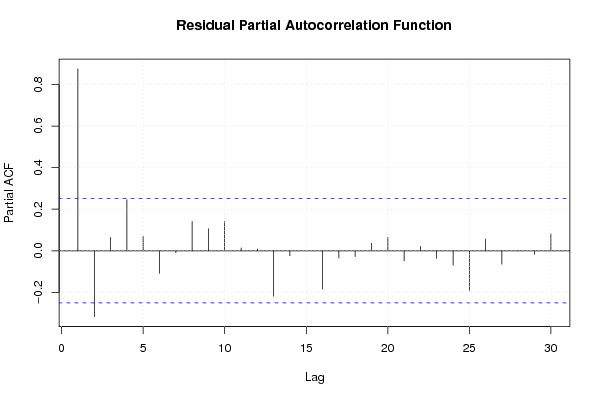
| Multiple Linear Regression - Residual Statistics | |
| Residual Standard Deviation | 0.843238634534586 |
| Sum Squared Residuals | 41.9520322915334 |
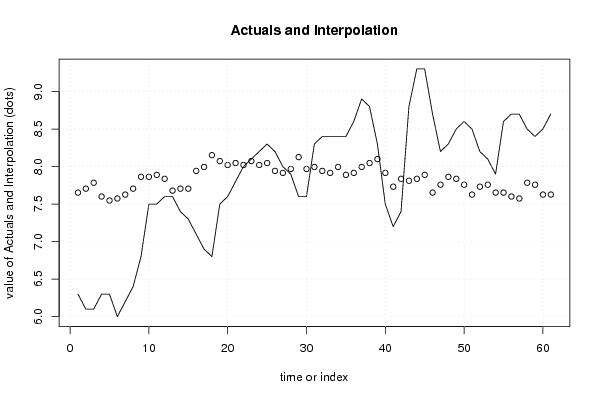
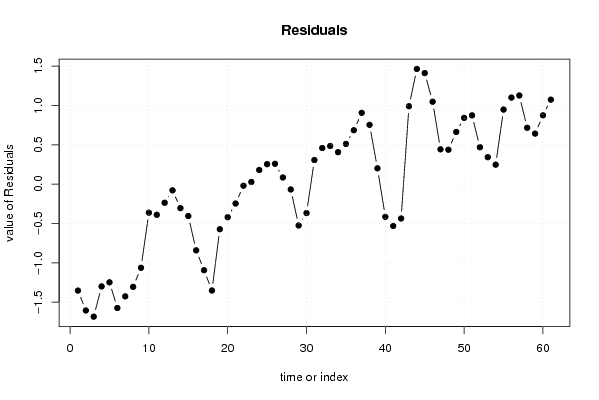
| Multiple Linear Regression - Actuals, Interpolation, and Residuals | |||
| Time or Index | Actuals | Interpolation Forecast | Residuals Prediction Error |
| 1 | 6.3 | 7.65256612515811 | -1.35256612515811 |
| 2 | 6.1 | 7.70509387569465 | -1.60509387569465 |
| 3 | 6.1 | 7.78388550149945 | -1.68388550149945 |
| 4 | 6.3 | 7.60003837462158 | -1.30003837462158 |
| 5 | 6.3 | 7.54751062408505 | -1.24751062408505 |
| 6 | 6 | 7.57377449935332 | -1.57377449935332 |
| 7 | 6.2 | 7.62630224988985 | -1.42630224988985 |
| 8 | 6.4 | 7.70509387569465 | -1.30509387569465 |
| 9 | 6.8 | 7.86267712730425 | -1.06267712730425 |
| 10 | 7.5 | 7.86267712730425 | -0.362677127304254 |
| 11 | 7.5 | 7.88894100257252 | -0.388941002572521 |
| 12 | 7.6 | 7.83641325203599 | -0.236413252035987 |
| 13 | 7.6 | 7.67883000042638 | -0.078830000426385 |
| 14 | 7.4 | 7.70509387569465 | -0.305093875694651 |
| 15 | 7.3 | 7.70509387569465 | -0.405093875694652 |
| 16 | 7.1 | 7.94146875310905 | -0.841468753109055 |
| 17 | 6.9 | 7.99399650364559 | -1.09399650364559 |
| 18 | 6.8 | 8.1515797552552 | -1.35157975525519 |
| 19 | 7.5 | 8.0727881294504 | -0.57278812945039 |
| 20 | 7.6 | 8.02026037891386 | -0.420260378913856 |
| 21 | 7.8 | 8.04652425418212 | -0.246524254182123 |
| 22 | 8 | 8.02026037891386 | -0.0202603789138561 |
| 23 | 8.1 | 8.0727881294504 | 0.0272118705496095 |
| 24 | 8.2 | 8.02026037891386 | 0.179739621086143 |
| 25 | 8.3 | 8.04652425418212 | 0.253475745817878 |
| 26 | 8.2 | 7.94146875310905 | 0.258531246890944 |
| 27 | 8 | 7.91520487784079 | 0.084795122159212 |
| 28 | 7.9 | 7.96773262837732 | -0.0677326283773217 |
| 29 | 7.6 | 8.12531587998692 | -0.525315879986925 |
| 30 | 7.6 | 7.96773262837732 | -0.367732628377322 |
| 31 | 8.3 | 7.99399650364559 | 0.306003496354412 |
| 32 | 8.4 | 7.94146875310905 | 0.458531246890945 |
| 33 | 8.4 | 7.91520487784079 | 0.484795122159212 |
| 34 | 8.4 | 7.99399650364559 | 0.406003496354411 |
| 35 | 8.4 | 7.88894100257252 | 0.51105899742748 |
| 36 | 8.6 | 7.91520487784079 | 0.684795122159212 |
| 37 | 8.9 | 7.99399650364559 | 0.906003496354411 |
| 38 | 8.8 | 8.04652425418212 | 0.753475745817877 |
| 39 | 8.3 | 8.09905200471866 | 0.200947995281343 |
| 40 | 7.5 | 7.91520487784079 | -0.415204877840788 |
| 41 | 7.2 | 7.73135775096292 | -0.531357750962919 |
| 42 | 7.4 | 7.83641325203599 | -0.436413252035987 |
| 43 | 8.8 | 7.81014937676772 | 0.98985062323228 |
| 44 | 9.3 | 7.83641325203599 | 1.46358674796401 |
| 45 | 9.3 | 7.88894100257252 | 1.41105899742748 |
| 46 | 8.7 | 7.65256612515812 | 1.04743387484188 |
| 47 | 8.2 | 7.75762162623119 | 0.442378373768813 |
| 48 | 8.3 | 7.86267712730425 | 0.437322872695747 |
| 49 | 8.5 | 7.83641325203599 | 0.663586747964013 |
| 50 | 8.6 | 7.75762162623119 | 0.842378373768814 |
| 51 | 8.5 | 7.62630224988985 | 0.87369775011015 |
| 52 | 8.2 | 7.73135775096292 | 0.468642249037081 |
| 53 | 8.1 | 7.75762162623119 | 0.342378373768814 |
| 54 | 7.9 | 7.65256612515812 | 0.247433874841883 |
| 55 | 8.6 | 7.65256612515812 | 0.947433874841882 |
| 56 | 8.7 | 7.60003837462158 | 1.09996162537842 |
| 57 | 8.7 | 7.57377449935332 | 1.12622550064668 |
| 58 | 8.5 | 7.78388550149945 | 0.716114498500547 |
| 59 | 8.4 | 7.75762162623119 | 0.642378373768814 |
| 60 | 8.5 | 7.62630224988985 | 0.87369775011015 |
| 61 | 8.7 | 7.62630224988985 | 1.07369775011015 |
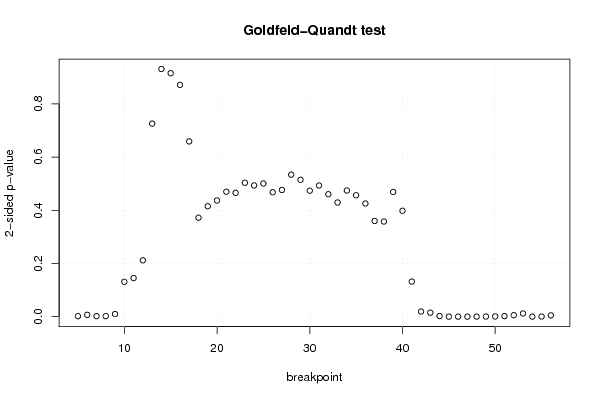
| Goldfeld-Quandt test for Heteroskedasticity | |||
| p-values | Alternative Hypothesis | ||
| breakpoint index | greater | 2-sided | less |
| 5 | 0.000915921582838224 | 0.00183184316567645 | 0.999084078417162 |
| 6 | 0.00341541013459013 | 0.00683082026918027 | 0.99658458986541 |
| 7 | 0.000880612172794921 | 0.00176122434558984 | 0.999119387827205 |
| 8 | 0.000964943562243102 | 0.00192988712448620 | 0.999035056437757 |
| 9 | 0.00493473627427877 | 0.00986947254855754 | 0.995065263725721 |
| 10 | 0.0655840983506843 | 0.131168196701369 | 0.934415901649316 |
| 11 | 0.0725569919738215 | 0.145113983947643 | 0.927443008026179 |
| 12 | 0.105867682088114 | 0.211735364176227 | 0.894132317911886 |
| 13 | 0.362961072586656 | 0.725922145173313 | 0.637038927413344 |
| 14 | 0.465743354914726 | 0.931486709829451 | 0.534256645085274 |
| 15 | 0.542294095693169 | 0.915411808613661 | 0.457705904306831 |
| 16 | 0.564205040081485 | 0.87158991983703 | 0.435794959918515 |
| 17 | 0.670460870493706 | 0.659078259012587 | 0.329539129506294 |
| 18 | 0.813932215527736 | 0.372135568944529 | 0.186067784472264 |
| 19 | 0.792401764985612 | 0.415196470028776 | 0.207598235014388 |
| 20 | 0.7815420904688 | 0.436915819062399 | 0.218457909531199 |
| 21 | 0.765080682719726 | 0.469838634560548 | 0.234919317280274 |
| 22 | 0.767162787509494 | 0.465674424981013 | 0.232837212490507 |
| 23 | 0.748226493551525 | 0.503547012896949 | 0.251773506448475 |
| 24 | 0.753285996570436 | 0.493428006859127 | 0.246714003429564 |
| 25 | 0.749600785608527 | 0.500798428782945 | 0.250399214391473 |
| 26 | 0.76604043839473 | 0.46791912321054 | 0.23395956160527 |
| 27 | 0.761772279560462 | 0.476455440879077 | 0.238227720439538 |
| 28 | 0.732931133018293 | 0.534137733963414 | 0.267068866981707 |
| 29 | 0.74266290383136 | 0.514674192337281 | 0.257337096168640 |
| 30 | 0.763179534561672 | 0.473640930876657 | 0.236820465438328 |
| 31 | 0.753420575072914 | 0.493158849854173 | 0.246579424927086 |
| 32 | 0.76979413240304 | 0.46041173519392 | 0.23020586759696 |
| 33 | 0.785333602657663 | 0.429332794684674 | 0.214666397342337 |
| 34 | 0.76276703060117 | 0.47446593879766 | 0.23723296939883 |
| 35 | 0.77171856782162 | 0.456562864356761 | 0.228281432178380 |
| 36 | 0.78727709373148 | 0.425445812537039 | 0.212722906268519 |
| 37 | 0.820071978001223 | 0.359856043997555 | 0.179928021998777 |
| 38 | 0.821117403638192 | 0.357765192723616 | 0.178882596361808 |
| 39 | 0.765590838281073 | 0.468818323437853 | 0.234409161718927 |
| 40 | 0.800926897186427 | 0.398146205627147 | 0.199073102813573 |
| 41 | 0.934062898516489 | 0.131874202967022 | 0.0659371014835111 |
| 42 | 0.990377263666324 | 0.0192454726673530 | 0.00962273633367652 |
| 43 | 0.99248955323257 | 0.0150208935348605 | 0.00751044676743024 |
| 44 | 0.998934036337923 | 0.00213192732415369 | 0.00106596366207684 |
| 45 | 0.99998504390682 | 2.99121863621365e-05 | 1.49560931810683e-05 |
| 46 | 0.999983120367513 | 3.37592649739792e-05 | 1.68796324869896e-05 |
| 47 | 0.999961910410402 | 7.61791791951082e-05 | 3.80895895975541e-05 |
| 48 | 0.999879584048143 | 0.000240831903713949 | 0.000120415951856974 |
| 49 | 0.999751949679133 | 0.000496100641734812 | 0.000248050320867406 |
| 50 | 0.999628118544116 | 0.00074376291176752 | 0.00037188145588376 |
| 51 | 0.998992874714743 | 0.00201425057051404 | 0.00100712528525702 |
| 52 | 0.997240526883763 | 0.00551894623247407 | 0.00275947311623704 |
| 53 | 0.9940266024018 | 0.0119467951963983 | 0.00597339759819916 |
| 54 | 0.999969288085103 | 6.14238297947148e-05 | 3.07119148973574e-05 |
| 55 | 0.999703071344837 | 0.000593857310325171 | 0.000296928655162585 |
| 56 | 0.997619192752246 | 0.00476161449550861 | 0.00238080724775431 |
| Meta Analysis of Goldfeld-Quandt test for Heteroskedasticity | |||
| Description | # significant tests | % significant tests | OK/NOK |
| 1% type I error level | 17 | 0.326923076923077 | NOK |
| 5% type I error level | 20 | 0.384615384615385 | NOK |
| 10% type I error level | 20 | 0.384615384615385 | NOK |