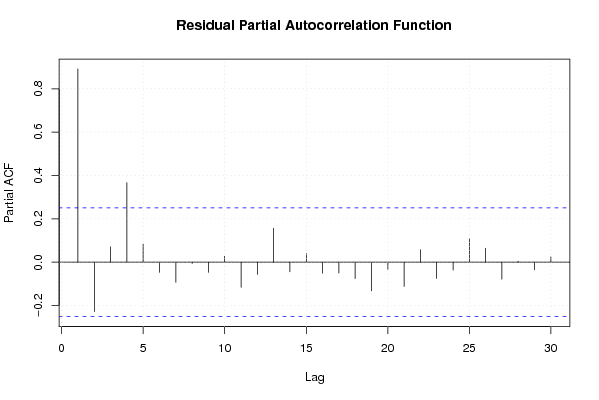
| Multiple Linear Regression - Estimated Regression Equation |
| Werkl[t] = + 8.7074311913167 -0.240943913049847Inflatie[t] -0.147433242027858M1[t] -0.400724486956013M2[t] -0.575905608695016M3[t] -0.820724486956013M4[t] -1.00072448695601M5[t] -1.08554336521701M6[t] -0.340724486956012M7[t] -0.131086730434018M8[t] -0.0448188782609970M9[t] -0.0296377565219940M10[t] -0.139275513043988M11[t] + e[t] |
| Multiple Linear Regression - Ordinary Least Squares | |||||
| Variable | Parameter | S.D. | T-STAT H0: parameter = 0 | 2-tail p-value | 1-tail p-value |
| (Intercept) | 8.7074311913167 | 0.505421 | 17.2281 | 0 | 0 |
| Inflatie | -0.240943913049847 | 0.175277 | -1.3746 | 0.175626 | 0.087813 |
| M1 | -0.147433242027858 | 0.507251 | -0.2907 | 0.77257 | 0.386285 |
| M2 | -0.400724486956013 | 0.529005 | -0.7575 | 0.452449 | 0.226225 |
| M3 | -0.575905608695016 | 0.529109 | -1.0884 | 0.281834 | 0.140917 |
| M4 | -0.820724486956013 | 0.529005 | -1.5515 | 0.127363 | 0.063681 |
| M5 | -1.00072448695601 | 0.529005 | -1.8917 | 0.064571 | 0.032285 |
| M6 | -1.08554336521701 | 0.528923 | -2.0524 | 0.045609 | 0.022804 |
| M7 | -0.340724486956012 | 0.529005 | -0.6441 | 0.522586 | 0.261293 |
| M8 | -0.131086730434018 | 0.529237 | -0.2477 | 0.805431 | 0.402715 |
| M9 | -0.0448188782609970 | 0.52883 | -0.0848 | 0.932812 | 0.466406 |
| M10 | -0.0296377565219940 | 0.528865 | -0.056 | 0.955542 | 0.477771 |
| M11 | -0.139275513043988 | 0.529005 | -0.2633 | 0.793463 | 0.396731 |
| Multiple Linear Regression - Regression Statistics | |
| Multiple R | 0.478874385794768 |
| R-squared | 0.229320677370316 |
| Adjusted R-squared | 0.0366508467128952 |
| F-TEST (value) | 1.19022618428550 |
| F-TEST (DF numerator) | 12 |
| F-TEST (DF denominator) | 48 |
| p-value | 0.317049346785684 |
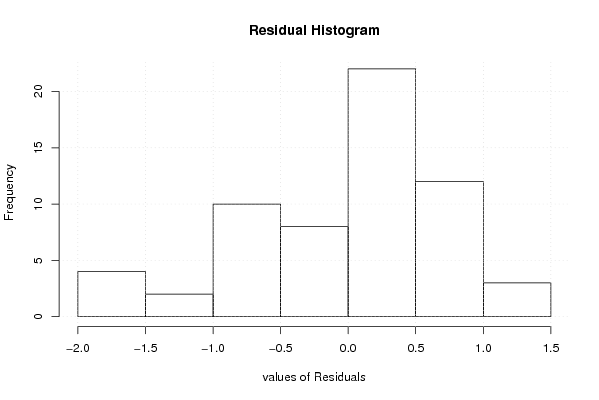
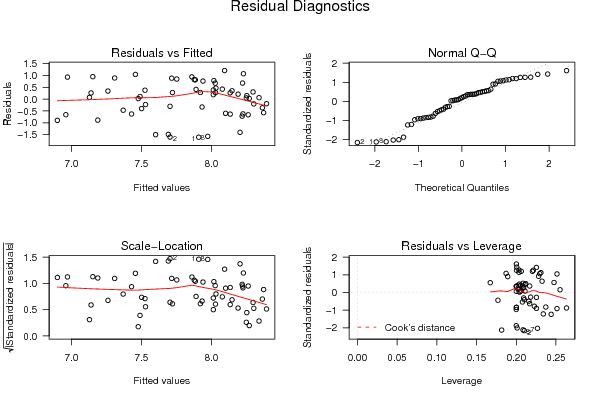
| Multiple Linear Regression - Residual Statistics | |
| Residual Standard Deviation | 0.836135761065297 |
| Sum Squared Residuals | 33.5579045247477 |
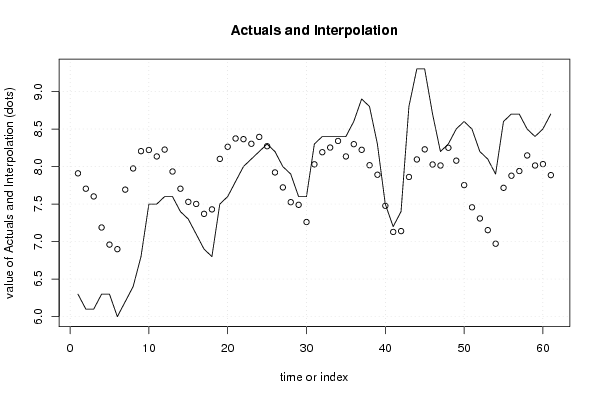
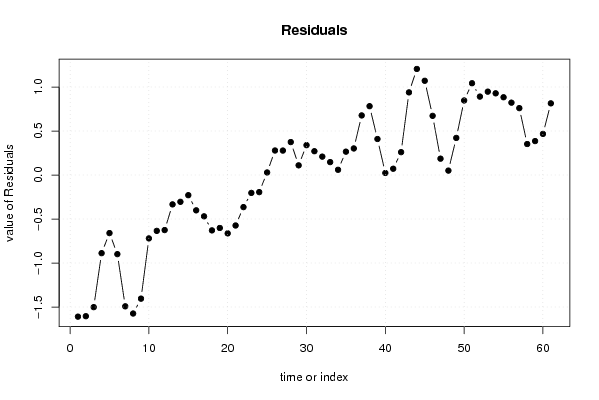
| Multiple Linear Regression - Actuals, Interpolation, and Residuals | |||
| Time or Index | Actuals | Interpolation Forecast | Residuals Prediction Error |
| 1 | 6.3 | 7.90944938405425 | -1.60944938405425 |
| 2 | 6.1 | 7.70434692173608 | -1.60434692173608 |
| 3 | 6.1 | 7.60144897391203 | -1.50144897391203 |
| 4 | 6.3 | 7.18796935651613 | -0.887969356516134 |
| 5 | 6.3 | 6.95978057390616 | -0.659780573906164 |
| 6 | 6 | 6.89905608695015 | -0.899056086950153 |
| 7 | 6.2 | 7.69206374782112 | -1.49206374782112 |
| 8 | 6.4 | 7.97398467825807 | -1.57398467825807 |
| 9 | 6.8 | 8.204818878261 | -1.40481887826100 |
| 10 | 7.5 | 8.22 | -0.72 |
| 11 | 7.5 | 8.13445663478299 | -0.634456634782991 |
| 12 | 7.6 | 8.22554336521701 | -0.62554336521701 |
| 13 | 7.6 | 7.93354377535924 | -0.333543775359243 |
| 14 | 7.4 | 7.70434692173607 | -0.304346921736073 |
| 15 | 7.3 | 7.52916579999707 | -0.229165799997070 |
| 16 | 7.1 | 7.50119644348094 | -0.401196443480936 |
| 17 | 6.9 | 7.3693852260909 | -0.469385226090905 |
| 18 | 6.8 | 7.42913269565982 | -0.629132695659816 |
| 19 | 7.5 | 8.10166840000586 | -0.60166840000586 |
| 20 | 7.6 | 8.26311737391788 | -0.663117373917884 |
| 21 | 7.8 | 8.37347961739589 | -0.57347961739589 |
| 22 | 8 | 8.3645663478299 | -0.364566347829908 |
| 23 | 8.1 | 8.30311737391788 | -0.203117373917884 |
| 24 | 8.2 | 8.3942041043519 | -0.194204104351903 |
| 25 | 8.3 | 8.27086525362903 | 0.0291347463709725 |
| 26 | 8.2 | 7.92119644348094 | 0.278803556519064 |
| 27 | 8 | 7.72192093043695 | 0.278079069563052 |
| 28 | 7.9 | 7.52529083478592 | 0.37470916521408 |
| 29 | 7.6 | 7.48985718261583 | 0.110142817384171 |
| 30 | 7.6 | 7.26047195652492 | 0.339528043475076 |
| 31 | 8.3 | 8.0293852260909 | 0.270614773909095 |
| 32 | 8.4 | 8.19083420000293 | 0.209165799997070 |
| 33 | 8.4 | 8.25300766087097 | 0.146992339129034 |
| 34 | 8.4 | 8.34047195652492 | 0.0595280434750769 |
| 35 | 8.4 | 8.13445663478299 | 0.265543365217009 |
| 36 | 8.6 | 8.29782653913196 | 0.302173460868037 |
| 37 | 8.9 | 8.22267647101906 | 0.677323528980941 |
| 38 | 8.8 | 8.01757400870087 | 0.782425991299127 |
| 39 | 8.3 | 7.89058166957184 | 0.40941833042816 |
| 40 | 7.5 | 7.47710205217595 | 0.0228979478240489 |
| 41 | 7.2 | 7.12844131304106 | 0.0715586869589422 |
| 42 | 7.4 | 7.14 | 0.260000000000000 |
| 43 | 8.8 | 7.86072448695601 | 0.939275513043988 |
| 44 | 9.3 | 8.09445663478299 | 1.20554336521701 |
| 45 | 9.3 | 8.22891326956598 | 1.07108673043402 |
| 46 | 8.7 | 8.02724486956012 | 0.672755130439878 |
| 47 | 8.2 | 8.01398467825807 | 0.186015321741932 |
| 48 | 8.3 | 8.24963775652199 | 0.0503622434780068 |
| 49 | 8.5 | 8.07811012318915 | 0.421889876810849 |
| 50 | 8.6 | 7.75253570434604 | 0.847464295653957 |
| 51 | 8.5 | 7.45688262608212 | 1.04311737391788 |
| 52 | 8.2 | 7.30844131304106 | 0.891558686958941 |
| 53 | 8.1 | 7.15253570434604 | 0.947464295653956 |
| 54 | 7.9 | 6.9713392608651 | 0.928660739134893 |
| 55 | 8.6 | 7.7161581391261 | 0.883841860873896 |
| 56 | 8.7 | 7.87760711303813 | 0.82239288696187 |
| 57 | 8.7 | 7.93978057390617 | 0.760219426093834 |
| 58 | 8.5 | 8.14771682608505 | 0.352283173914954 |
| 59 | 8.4 | 8.01398467825807 | 0.386015321741933 |
| 60 | 8.5 | 8.03278823477713 | 0.467211765222868 |
| 61 | 8.7 | 7.88535499274927 | 0.814645007250726 |
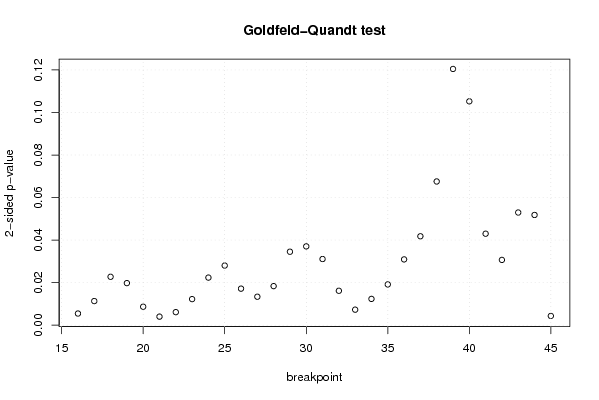
| Goldfeld-Quandt test for Heteroskedasticity | |||
| p-values | Alternative Hypothesis | ||
| breakpoint index | greater | 2-sided | less |
| 16 | 0.99726216622278 | 0.00547566755444006 | 0.00273783377722003 |
| 17 | 0.994334803432443 | 0.0113303931351133 | 0.00566519656755664 |
| 18 | 0.988621490869797 | 0.0227570182604056 | 0.0113785091302028 |
| 19 | 0.990104142110398 | 0.0197917157792038 | 0.0098958578896019 |
| 20 | 0.995664147992209 | 0.00867170401558286 | 0.00433585200779143 |
| 21 | 0.997994419231452 | 0.0040111615370963 | 0.00200558076854815 |
| 22 | 0.996936342295463 | 0.00612731540907337 | 0.00306365770453668 |
| 23 | 0.993871314984384 | 0.0122573700312326 | 0.00612868501561631 |
| 24 | 0.988815327475064 | 0.0223693450498724 | 0.0111846725249362 |
| 25 | 0.985981394175572 | 0.0280372116488571 | 0.0140186058244285 |
| 26 | 0.991412686873553 | 0.0171746262528940 | 0.00858731312644702 |
| 27 | 0.9933082651005 | 0.0133834697989981 | 0.00669173489949904 |
| 28 | 0.99081796435801 | 0.0183640712839786 | 0.00918203564198932 |
| 29 | 0.98273429994343 | 0.0345314001131397 | 0.0172657000565699 |
| 30 | 0.981475888036376 | 0.0370482239272485 | 0.0185241119636242 |
| 31 | 0.984448452719084 | 0.031103094561831 | 0.0155515472809155 |
| 32 | 0.991909984630696 | 0.0161800307386077 | 0.00809001536930386 |
| 33 | 0.996352266992391 | 0.00729546601521725 | 0.00364773300760862 |
| 34 | 0.993818976617273 | 0.0123620467654531 | 0.00618102338272657 |
| 35 | 0.990418461993898 | 0.0191630760122044 | 0.00958153800610218 |
| 36 | 0.984534211578813 | 0.0309315768423742 | 0.0154657884211871 |
| 37 | 0.979101071675194 | 0.0417978566496115 | 0.0208989283248058 |
| 38 | 0.966218019233858 | 0.0675639615322841 | 0.0337819807661421 |
| 39 | 0.939768180842576 | 0.120463638314848 | 0.060231819157424 |
| 40 | 0.947379537213923 | 0.105240925572155 | 0.0526204627860774 |
| 41 | 0.978495006302386 | 0.043009987395229 | 0.0215049936976145 |
| 42 | 0.98465850589066 | 0.0306829882186801 | 0.0153414941093400 |
| 43 | 0.973516492027997 | 0.0529670159440063 | 0.0264835079720031 |
| 44 | 0.974091368299484 | 0.0518172634010322 | 0.0259086317005161 |
| 45 | 0.997828471630278 | 0.00434305673944364 | 0.00217152836972182 |
| Meta Analysis of Goldfeld-Quandt test for Heteroskedasticity | |||
| Description | # significant tests | % significant tests | OK/NOK |
| 1% type I error level | 6 | 0.2 | NOK |
| 5% type I error level | 25 | 0.833333333333333 | NOK |
| 10% type I error level | 28 | 0.933333333333333 | NOK |