| Multiple Linear Regression - Estimated Regression Equation |
| Werkl[t] = + 7.62177873039487 -0.406930054325027Infl[t] + 0.0774000839023803M1[t] + 0.00357261962257999M2[t] -0.207390600818577M3[t] -0.494631023432735M4[t] -0.713732844960393M5[t] -0.840973267574551M6[t] -0.131936488015708M7[t] + 0.0452388926296351M8[t] + 0.0691668634964734M9[t] + 0.041926440882315M10[t] -0.113452582818344M11[t] + 0.0391018215276578t + e[t] |
| Multiple Linear Regression - Ordinary Least Squares | |||||
| Variable | Parameter | S.D. | T-STAT H0: parameter = 0 | 2-tail p-value | 1-tail p-value |
| (Intercept) | 7.62177873039487 | 0.23046 | 33.072 | 0 | 0 |
| Infl | -0.406930054325027 | 0.076462 | -5.322 | 3e-06 | 1e-06 |
| M1 | 0.0774000839023803 | 0.219341 | 0.3529 | 0.725759 | 0.36288 |
| M2 | 0.00357261962257999 | 0.229868 | 0.0155 | 0.987666 | 0.493833 |
| M3 | -0.207390600818577 | 0.229628 | -0.9032 | 0.371047 | 0.185523 |
| M4 | -0.494631023432735 | 0.229279 | -2.1573 | 0.036124 | 0.018062 |
| M5 | -0.713732844960393 | 0.229031 | -3.1163 | 0.00312 | 0.00156 |
| M6 | -0.840973267574551 | 0.228762 | -3.6762 | 0.000607 | 0.000303 |
| M7 | -0.131936488015708 | 0.228629 | -0.5771 | 0.566642 | 0.283321 |
| M8 | 0.0452388926296351 | 0.2286 | 0.1979 | 0.84398 | 0.42199 |
| M9 | 0.0691668634964734 | 0.228237 | 0.303 | 0.76319 | 0.381595 |
| M10 | 0.041926440882315 | 0.22817 | 0.1838 | 0.854999 | 0.4275 |
| M11 | -0.113452582818344 | 0.228184 | -0.4972 | 0.621367 | 0.310684 |
| t | 0.0391018215276578 | 0.002692 | 14.5258 | 0 | 0 |
| Multiple Linear Regression - Regression Statistics | |
| Multiple R | 0.927148263206159 |
| R-squared | 0.859603901966197 |
| Adjusted R-squared | 0.820770938680252 |
| F-TEST (value) | 22.1359337333216 |
| F-TEST (DF numerator) | 13 |
| F-TEST (DF denominator) | 47 |
| p-value | 9.9920072216264e-16 |
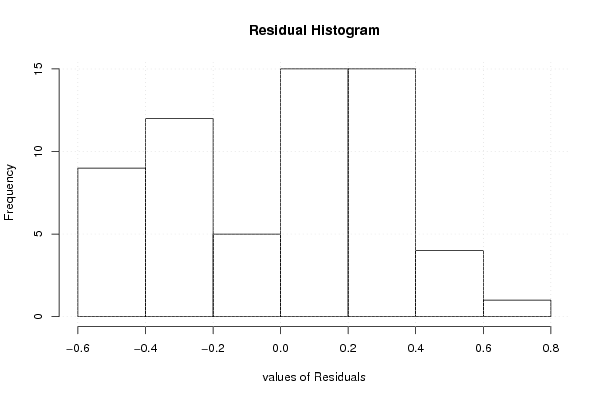
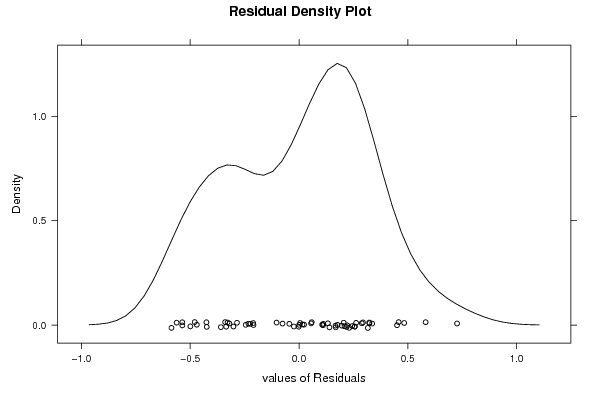
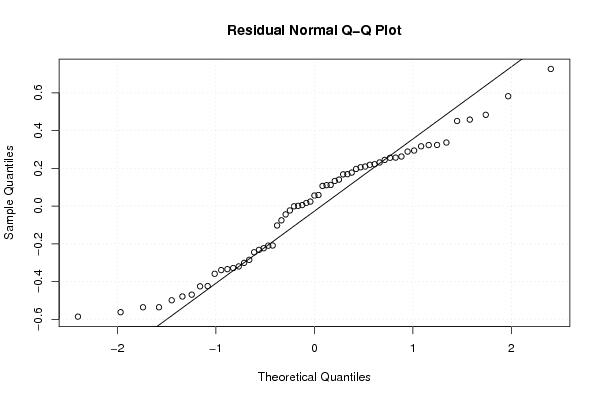
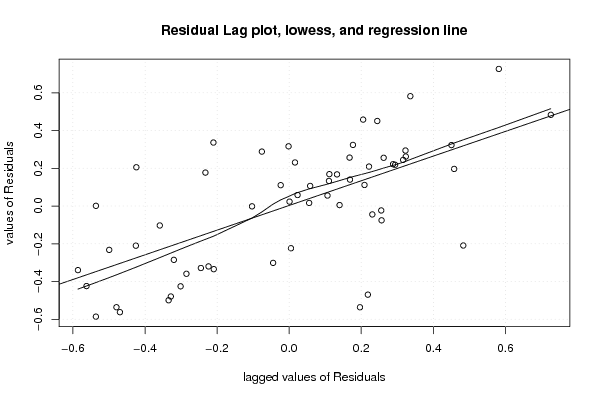
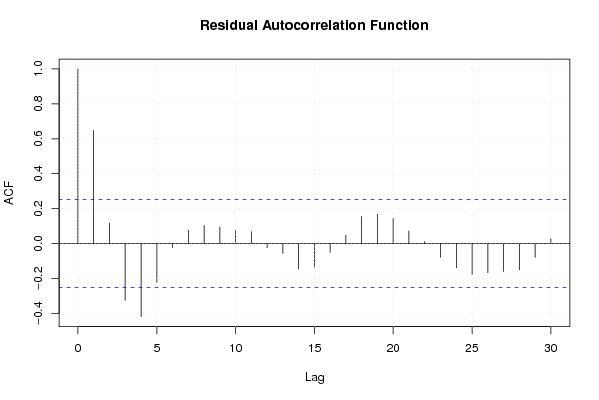
| Multiple Linear Regression - Residual Statistics | |
| Residual Standard Deviation | 0.360652671465877 |
| Sum Squared Residuals | 6.11330642346728 |
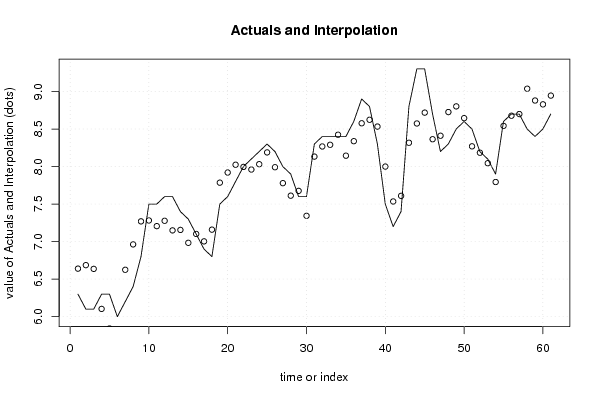
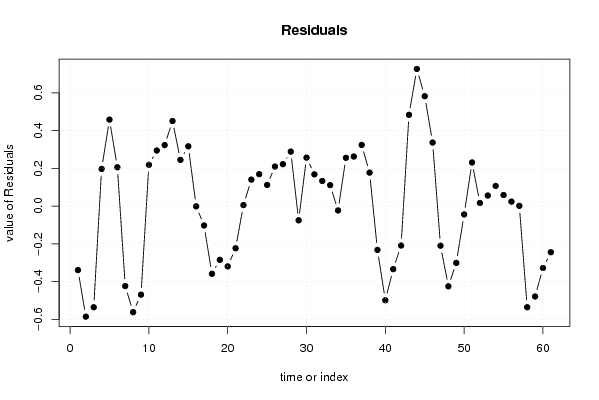
| Multiple Linear Regression - Actuals, Interpolation, and Residuals | |||
| Time or Index | Actuals | Interpolation Forecast | Residuals Prediction Error |
| 1 | 6.3 | 6.63956948914732 | -0.339569489147325 |
| 2 | 6.1 | 6.6862298572602 | -0.586229857260202 |
| 3 | 6.1 | 6.63644747464421 | -0.536447474644211 |
| 4 | 6.3 | 6.10345783553019 | 0.196542164469811 |
| 5 | 6.3 | 5.84207182466518 | 0.457928175334816 |
| 6 | 6 | 5.79462622901119 | 0.205373770988814 |
| 7 | 6.2 | 6.6241508409627 | -0.424150840962692 |
| 8 | 6.4 | 6.9625070594332 | -0.562507059433201 |
| 9 | 6.8 | 7.26969488442271 | -0.469694884422714 |
| 10 | 7.5 | 7.28155628333621 | 0.218443716663787 |
| 11 | 7.5 | 7.20597208659571 | 0.294027913404286 |
| 12 | 7.6 | 7.27714048007671 | 0.322859519923289 |
| 13 | 7.6 | 7.14948435291173 | 0.450515647088268 |
| 14 | 7.4 | 7.15545171559209 | 0.244548284407908 |
| 15 | 7.3 | 6.9835903166786 | 0.316409683321406 |
| 16 | 7.1 | 7.10168876448462 | -0.00168876448461783 |
| 17 | 6.9 | 7.00307477534962 | -0.103074775349623 |
| 18 | 6.8 | 7.15909420685814 | -0.359094206858138 |
| 19 | 7.5 | 7.78515379164713 | -0.285153791647131 |
| 20 | 7.6 | 7.92004498295513 | -0.320044982955127 |
| 21 | 7.8 | 8.02376778078212 | -0.223767780782126 |
| 22 | 8 | 7.99493617426312 | 0.00506382573687796 |
| 23 | 8.1 | 7.96004498295513 | 0.139955017044873 |
| 24 | 8.2 | 8.03121337643612 | 0.168786623563876 |
| 25 | 8.3 | 8.18840828729866 | 0.111591712701338 |
| 26 | 8.2 | 7.99091062281651 | 0.209089377183488 |
| 27 | 8 | 7.77835621847051 | 0.221643781529491 |
| 28 | 7.9 | 7.61160362824901 | 0.288396371750987 |
| 29 | 7.6 | 7.67576166084403 | -0.0757616608440296 |
| 30 | 7.6 | 7.34346502716251 | 0.256534972837486 |
| 31 | 8.3 | 8.13229663368152 | 0.167703366318484 |
| 32 | 8.4 | 8.26718782498951 | 0.132812175010488 |
| 33 | 8.4 | 8.2895246119515 | 0.110475388048495 |
| 34 | 8.4 | 8.42346502716251 | -0.0234650271625128 |
| 35 | 8.4 | 8.1444158032595 | 0.255584196740499 |
| 36 | 8.6 | 8.337663213038 | 0.262336786961994 |
| 37 | 8.9 | 8.57624413476555 | 0.323755865234449 |
| 38 | 8.8 | 8.62290450287841 | 0.177095497121586 |
| 39 | 8.3 | 8.53242911482992 | -0.23242911482992 |
| 40 | 7.5 | 7.9994394757159 | -0.499439475715902 |
| 41 | 7.2 | 7.53458843768838 | -0.334588437688383 |
| 42 | 7.4 | 7.60922185833189 | -0.209221858331893 |
| 43 | 8.8 | 8.3166674539859 | 0.483332546014109 |
| 44 | 9.3 | 8.5736376615914 | 0.726362338408605 |
| 45 | 9.3 | 8.7180534648509 | 0.581946535149104 |
| 46 | 8.7 | 8.36367781487187 | 0.336322185128127 |
| 47 | 8.2 | 8.41017263442888 | -0.210172634428883 |
| 48 | 8.3 | 8.7254990605049 | -0.425499060504893 |
| 49 | 8.5 | 8.80130796050243 | -0.301307960502429 |
| 50 | 8.6 | 8.64450330145278 | -0.0445033014527798 |
| 51 | 8.5 | 8.26917687537677 | 0.230823124623233 |
| 52 | 8.2 | 8.18381029602028 | 0.0161897039797223 |
| 53 | 8.1 | 8.04450330145278 | 0.0554966985472196 |
| 54 | 7.9 | 7.79359267863627 | 0.106407321363731 |
| 55 | 8.6 | 8.54173127972277 | 0.0582687202772301 |
| 56 | 8.7 | 8.67662247103076 | 0.0233775289692344 |
| 57 | 8.7 | 8.69895925799276 | 0.00104074200724086 |
| 58 | 8.5 | 9.03636470036628 | -0.53636470036628 |
| 59 | 8.4 | 8.87939449276078 | -0.479394492760775 |
| 60 | 8.5 | 8.82848386994426 | -0.328483869944264 |
| 61 | 8.7 | 8.9449857753743 | -0.244985775374302 |
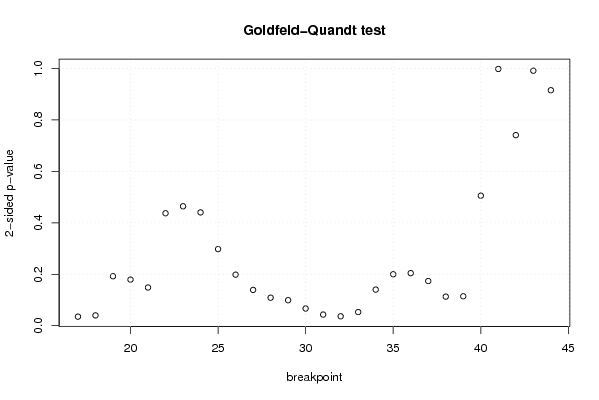
| Goldfeld-Quandt test for Heteroskedasticity | |||
| p-values | Alternative Hypothesis | ||
| breakpoint index | greater | 2-sided | less |
| 17 | 0.0176743188398783 | 0.0353486376797566 | 0.982325681160122 |
| 18 | 0.0201666676766116 | 0.0403333353532233 | 0.979833332323388 |
| 19 | 0.096236739087901 | 0.192473478175802 | 0.903763260912099 |
| 20 | 0.089673789175368 | 0.179347578350736 | 0.910326210824632 |
| 21 | 0.0743697366288306 | 0.148739473257661 | 0.92563026337117 |
| 22 | 0.218651589089328 | 0.437303178178656 | 0.781348410910672 |
| 23 | 0.232216131699221 | 0.464432263398442 | 0.767783868300779 |
| 24 | 0.220374623161972 | 0.440749246323943 | 0.779625376838028 |
| 25 | 0.149032220401235 | 0.29806444080247 | 0.850967779598765 |
| 26 | 0.0993136760177952 | 0.198627352035590 | 0.900686323982205 |
| 27 | 0.0696569937456013 | 0.139313987491203 | 0.930343006254399 |
| 28 | 0.054529322211934 | 0.109058644423868 | 0.945470677788066 |
| 29 | 0.0496819993099501 | 0.0993639986199003 | 0.95031800069005 |
| 30 | 0.0335202056155961 | 0.0670404112311921 | 0.966479794384404 |
| 31 | 0.0217194214010752 | 0.0434388428021504 | 0.978280578598925 |
| 32 | 0.0183533758734193 | 0.0367067517468386 | 0.98164662412658 |
| 33 | 0.0266164235106769 | 0.0532328470213537 | 0.973383576489323 |
| 34 | 0.070325973809434 | 0.140651947618868 | 0.929674026190566 |
| 35 | 0.100102788031697 | 0.200205576063395 | 0.899897211968303 |
| 36 | 0.102265257389802 | 0.204530514779604 | 0.897734742610198 |
| 37 | 0.0869301760937956 | 0.173860352187591 | 0.913069823906204 |
| 38 | 0.0565825683738639 | 0.113165136747728 | 0.943417431626136 |
| 39 | 0.0572709320803939 | 0.114541864160788 | 0.942729067919606 |
| 40 | 0.252823585105221 | 0.505647170210443 | 0.747176414894779 |
| 41 | 0.500788313544133 | 0.998423372911733 | 0.499211686455867 |
| 42 | 0.629424255888555 | 0.74115148822289 | 0.370575744111445 |
| 43 | 0.504213136375013 | 0.991573727249974 | 0.495786863624987 |
| 44 | 0.542181373296135 | 0.91563725340773 | 0.457818626703865 |
| Meta Analysis of Goldfeld-Quandt test for Heteroskedasticity | |||
| Description | # significant tests | % significant tests | OK/NOK |
| 1% type I error level | 0 | 0 | OK |
| 5% type I error level | 4 | 0.142857142857143 | NOK |
| 10% type I error level | 7 | 0.25 | NOK |