| Multiple Linear Regression - Estimated Regression Equation |
| Werkl[t] = + 0.578720388686346 -0.0288976650552464Infl[t] + 1.30143214998577`Yt-1`[t] -0.500215742364641`Yt-2`[t] -0.406060070910419`Yt-3`[t] + 0.510605505838536`Yt-4`[t] -0.0090128947126465M1[t] + 0.00134048665666322M2[t] + 0.749204340383939M3[t] -0.00450670673461415M4[t] + 0.279500612908942M5[t] + 0.582882431043774M6[t] + 0.217843298407681M7[t] + 0.425664336820022M8[t] + 0.326808893226672M9[t] + 0.053531382937026M10[t] + 0.104634569514344M11[t] + 0.00124441197949185t + e[t] |
| Multiple Linear Regression - Ordinary Least Squares | |||||
| Variable | Parameter | S.D. | T-STAT H0: parameter = 0 | 2-tail p-value | 1-tail p-value |
| (Intercept) | 0.578720388686346 | 0.838499 | 0.6902 | 0.494164 | 0.247082 |
| Infl | -0.0288976650552464 | 0.053355 | -0.5416 | 0.591165 | 0.295582 |
| `Yt-1` | 1.30143214998577 | 0.142453 | 9.1359 | 0 | 0 |
| `Yt-2` | -0.500215742364641 | 0.239085 | -2.0922 | 0.042978 | 0.021489 |
| `Yt-3` | -0.406060070910419 | 0.239948 | -1.6923 | 0.098568 | 0.049284 |
| `Yt-4` | 0.510605505838536 | 0.150148 | 3.4007 | 0.001564 | 0.000782 |
| M1 | -0.0090128947126465 | 0.107011 | -0.0842 | 0.933309 | 0.466655 |
| M2 | 0.00134048665666322 | 0.111548 | 0.012 | 0.990473 | 0.495237 |
| M3 | 0.749204340383939 | 0.118082 | 6.3448 | 0 | 0 |
| M4 | -0.00450670673461415 | 0.145622 | -0.0309 | 0.975469 | 0.487734 |
| M5 | 0.279500612908942 | 0.145553 | 1.9203 | 0.062159 | 0.031079 |
| M6 | 0.582882431043774 | 0.141407 | 4.122 | 0.00019 | 9.5e-05 |
| M7 | 0.217843298407681 | 0.105199 | 2.0708 | 0.045044 | 0.022522 |
| M8 | 0.425664336820022 | 0.103074 | 4.1297 | 0.000185 | 9.3e-05 |
| M9 | 0.326808893226672 | 0.110542 | 2.9564 | 0.00526 | 0.00263 |
| M10 | 0.053531382937026 | 0.122196 | 0.4381 | 0.663746 | 0.331873 |
| M11 | 0.104634569514344 | 0.112827 | 0.9274 | 0.359429 | 0.179714 |
| t | 0.00124441197949185 | 0.004874 | 0.2553 | 0.79983 | 0.399915 |
| Multiple Linear Regression - Regression Statistics | |
| Multiple R | 0.98576974984865 |
| R-squared | 0.971741999716672 |
| Adjusted R-squared | 0.95942440984958 |
| F-TEST (value) | 78.8905954981365 |
| F-TEST (DF numerator) | 17 |
| F-TEST (DF denominator) | 39 |
| p-value | 0 |
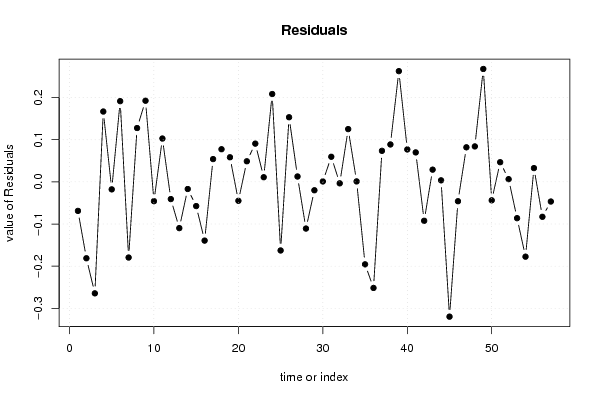
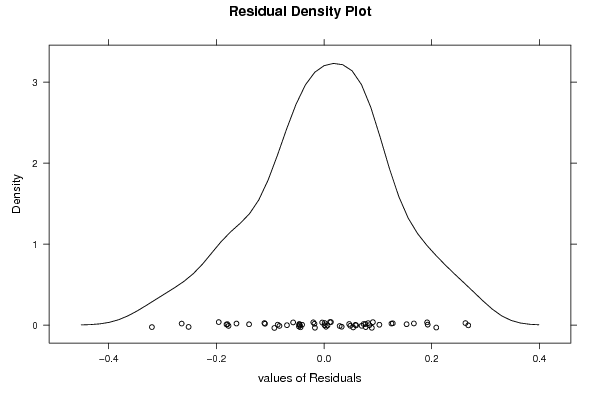
| Multiple Linear Regression - Residual Statistics | |
| Residual Standard Deviation | 0.152322251148176 |
| Sum Squared Residuals | 0.904880659599072 |
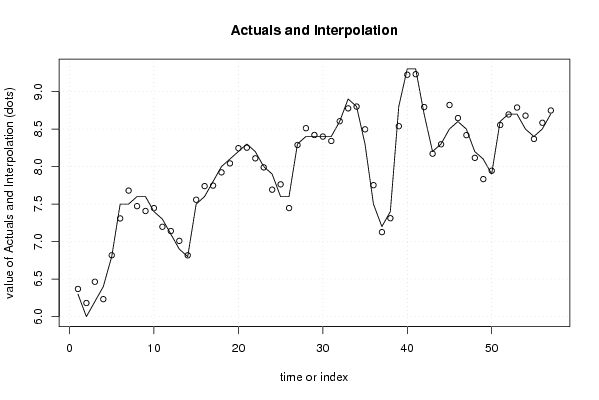
| Multiple Linear Regression - Actuals, Interpolation, and Residuals | |||
| Time or Index | Actuals | Interpolation Forecast | Residuals Prediction Error |
| 1 | 6.3 | 6.36892391499723 | -0.068923914997231 |
| 2 | 6 | 6.18124722521091 | -0.181247225210907 |
| 3 | 6.2 | 6.4644933647509 | -0.264493364750907 |
| 4 | 6.4 | 6.23316828300267 | 0.166831716997327 |
| 5 | 6.8 | 6.81781991645622 | -0.0178199164562220 |
| 6 | 7.5 | 7.30858219215828 | 0.191417807841719 |
| 7 | 7.5 | 7.67950253303701 | -0.179502533037013 |
| 8 | 7.6 | 7.47233450356609 | 0.127665496433911 |
| 9 | 7.6 | 7.40752824061578 | 0.192471759384220 |
| 10 | 7.4 | 7.44578718866166 | -0.0457871886616623 |
| 11 | 7.3 | 7.19724235013028 | 0.102757649869723 |
| 12 | 7.1 | 7.14082057520335 | -0.04082057520335 |
| 13 | 6.9 | 7.00977878390264 | -0.109778783902636 |
| 14 | 6.8 | 6.8169568006837 | -0.0169568006836957 |
| 15 | 7.5 | 7.55744716394647 | -0.0574471639464694 |
| 16 | 7.6 | 7.73931598803724 | -0.139315988037242 |
| 17 | 7.8 | 7.74593458743248 | 0.054065412567522 |
| 18 | 8 | 7.92263330658082 | 0.0773666934191797 |
| 19 | 8.1 | 8.04167924745543 | 0.0583207525445709 |
| 20 | 8.2 | 8.24491376776363 | -0.0449137677636313 |
| 21 | 8.3 | 8.25122323040303 | 0.048776769596967 |
| 22 | 8.2 | 8.10926780090956 | 0.0907321990904372 |
| 23 | 8 | 7.98901538721862 | 0.0109846127813844 |
| 24 | 7.9 | 7.69159445042693 | 0.208405549573066 |
| 25 | 7.6 | 7.76273105787617 | -0.162731057876175 |
| 26 | 7.6 | 7.44673364503079 | 0.153266354969211 |
| 27 | 8.3 | 8.2872813058758 | 0.0127186941241927 |
| 28 | 8.4 | 8.51079511340501 | -0.110795113405013 |
| 29 | 8.4 | 8.4199676221143 | -0.0199676221143032 |
| 30 | 8.4 | 8.39899952787144 | 0.00100047212855698 |
| 31 | 8.4 | 8.34046358818868 | 0.059536411811323 |
| 32 | 8.6 | 8.60347935566989 | -0.00347935566988855 |
| 33 | 8.9 | 8.77482405356976 | 0.125175946430242 |
| 34 | 8.8 | 8.79895698479346 | 0.00104301520654187 |
| 35 | 8.3 | 8.49566416447126 | -0.195664164471265 |
| 36 | 7.5 | 7.7516542205359 | -0.251654220535898 |
| 37 | 7.2 | 7.12640718230037 | 0.073592817699626 |
| 38 | 7.4 | 7.31127647543861 | 0.0887235245613888 |
| 39 | 8.8 | 8.53739143115547 | 0.262608568844532 |
| 40 | 9.3 | 9.22311004063138 | 0.076889959368616 |
| 41 | 9.3 | 9.23016167501423 | 0.0698383249857733 |
| 42 | 8.7 | 8.79230913728963 | -0.0923091372896299 |
| 43 | 8.2 | 8.1710318653824 | 0.0289681346175983 |
| 44 | 8.3 | 8.2963725051415 | 0.00362749485850200 |
| 45 | 8.5 | 8.81975883574927 | -0.319758835749268 |
| 46 | 8.6 | 8.64598802563532 | -0.0459880256353168 |
| 47 | 8.5 | 8.41807809817984 | 0.0819219018201574 |
| 48 | 8.2 | 8.11593075383382 | 0.0840692461661811 |
| 49 | 8.1 | 7.83215906092358 | 0.267840939076416 |
| 50 | 7.9 | 7.943785853636 | -0.0437858536359974 |
| 51 | 8.6 | 8.55338673427135 | 0.0466132657286517 |
| 52 | 8.7 | 8.69361057492369 | 0.00638942507631222 |
| 53 | 8.7 | 8.78611619898277 | -0.08611619898277 |
| 54 | 8.5 | 8.67747583609983 | -0.177475836099826 |
| 55 | 8.4 | 8.36732276593648 | 0.0326772340635212 |
| 56 | 8.5 | 8.5828998678589 | -0.0828998678588934 |
| 57 | 8.7 | 8.74666563966216 | -0.0466656396621606 |
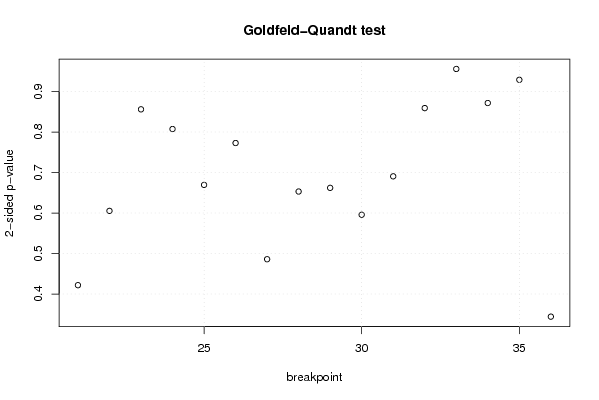
| Goldfeld-Quandt test for Heteroskedasticity | |||
| p-values | Alternative Hypothesis | ||
| breakpoint index | greater | 2-sided | less |
| 21 | 0.789089283343986 | 0.421821433312029 | 0.210910716656015 |
| 22 | 0.697342321008158 | 0.605315357983684 | 0.302657678991842 |
| 23 | 0.571971889105435 | 0.85605622178913 | 0.428028110894565 |
| 24 | 0.59630045665869 | 0.80739908668262 | 0.40369954334131 |
| 25 | 0.665303061369886 | 0.669393877260229 | 0.334696938630114 |
| 26 | 0.613598686332359 | 0.772802627335283 | 0.386401313667641 |
| 27 | 0.75704702750172 | 0.485905944996561 | 0.242952972498281 |
| 28 | 0.673468243917435 | 0.65306351216513 | 0.326531756082565 |
| 29 | 0.668918345512874 | 0.662163308974253 | 0.331081654487126 |
| 30 | 0.702127914442173 | 0.595744171115655 | 0.297872085557827 |
| 31 | 0.654697507138478 | 0.690604985723045 | 0.345302492861522 |
| 32 | 0.570462406882262 | 0.859075186235476 | 0.429537593117738 |
| 33 | 0.522123436894398 | 0.955753126211204 | 0.477876563105602 |
| 34 | 0.564189295785025 | 0.87162140842995 | 0.435810704214975 |
| 35 | 0.464478537345776 | 0.928957074691551 | 0.535521462654224 |
| 36 | 0.827939637566508 | 0.344120724866985 | 0.172060362433492 |
| Meta Analysis of Goldfeld-Quandt test for Heteroskedasticity | |||
| Description | # significant tests | % significant tests | OK/NOK |
| 1% type I error level | 0 | 0 | OK |
| 5% type I error level | 0 | 0 | OK |
| 10% type I error level | 0 | 0 | OK |