| Multiple Linear Regression - Estimated Regression Equation |
| Y[t] = + 2.75622369530088 -0.141185604893304X[t] + 1.39682018713845Y1[t] -0.719429746061353Y2[t] -0.0670407108398949M1[t] -0.080762823187288M2[t] -0.0522366748546463M3[t] -0.00507411743522141M4[t] + 0.701762994805734M5[t] -0.309620090779789M6[t] -0.0347808661624004M7[t] -0.059528429032278M8[t] + 0.0665520989852706M9[t] + 0.277841848919159M10[t] + 0.154825417140026M11[t] -0.00775463632460447t + e[t] |
| Multiple Linear Regression - Ordinary Least Squares | |||||
| Variable | Parameter | S.D. | T-STAT H0: parameter = 0 | 2-tail p-value | 1-tail p-value |
| (Intercept) | 2.75622369530088 | 0.607804 | 4.5347 | 4.7e-05 | 2.4e-05 |
| X | -0.141185604893304 | 0.094346 | -1.4965 | 0.142011 | 0.071005 |
| Y1 | 1.39682018713845 | 0.109413 | 12.7665 | 0 | 0 |
| Y2 | -0.719429746061353 | 0.111227 | -6.4681 | 0 | 0 |
| M1 | -0.0670407108398949 | 0.129837 | -0.5163 | 0.608321 | 0.304161 |
| M2 | -0.080762823187288 | 0.133868 | -0.6033 | 0.549553 | 0.274777 |
| M3 | -0.0522366748546463 | 0.1375 | -0.3799 | 0.705931 | 0.352965 |
| M4 | -0.00507411743522141 | 0.13852 | -0.0366 | 0.970953 | 0.485476 |
| M5 | 0.701762994805734 | 0.13727 | 5.1123 | 7e-06 | 4e-06 |
| M6 | -0.309620090779789 | 0.144785 | -2.1385 | 0.038338 | 0.019169 |
| M7 | -0.0347808661624004 | 0.128514 | -0.2706 | 0.787995 | 0.393997 |
| M8 | -0.059528429032278 | 0.132029 | -0.4509 | 0.654401 | 0.3272 |
| M9 | 0.0665520989852706 | 0.136395 | 0.4879 | 0.628133 | 0.314067 |
| M10 | 0.277841848919159 | 0.134369 | 2.0677 | 0.04486 | 0.02243 |
| M11 | 0.154825417140026 | 0.135219 | 1.145 | 0.258694 | 0.129347 |
| t | -0.00775463632460447 | 0.002642 | -2.9352 | 0.005386 | 0.002693 |
| Multiple Linear Regression - Regression Statistics | |
| Multiple R | 0.974890277812212 |
| R-squared | 0.950411053772772 |
| Adjusted R-squared | 0.932700715834476 |
| F-TEST (value) | 53.6641964192934 |
| F-TEST (DF numerator) | 15 |
| F-TEST (DF denominator) | 42 |
| p-value | 0 |
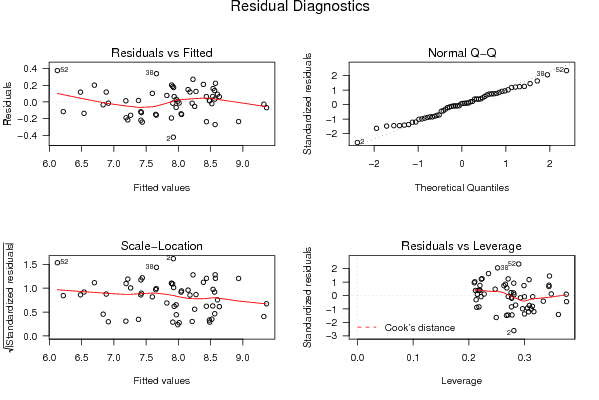
| Multiple Linear Regression - Residual Statistics | |
| Residual Standard Deviation | 0.190545579175235 |
| Sum Squared Residuals | 1.52491994521548 |
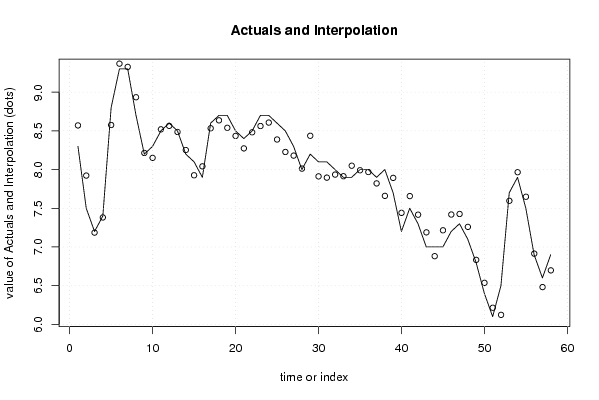
| Multiple Linear Regression - Actuals, Interpolation, and Residuals | |||
| Time or Index | Actuals | Interpolation Forecast | Residuals Prediction Error |
| 1 | 8.3 | 8.57052125500866 | -0.270521255008656 |
| 2 | 7.5 | 7.92257738737358 | -0.422577387373576 |
| 3 | 7.2 | 7.18560762270153 | 0.0143923772984707 |
| 4 | 7.4 | 7.3815132845039 | 0.0184867154960978 |
| 5 | 8.8 | 8.57578872166635 | 0.224211278333653 |
| 6 | 9.3 | 9.36831331253777 | -0.0683133125377741 |
| 7 | 9.3 | 9.32660634991389 | -0.0266063499138856 |
| 8 | 8.7 | 8.93438927768873 | -0.234389277688728 |
| 9 | 8.2 | 8.2146230570986 | -0.0146230570986028 |
| 10 | 8.3 | 8.15140592477547 | 0.148594075224525 |
| 11 | 8.5 | 8.52003174841626 | -0.0200317484162625 |
| 12 | 8.6 | 8.56487275777318 | 0.0351272422268162 |
| 13 | 8.5 | 8.48587348011026 | 0.0141265198897422 |
| 14 | 8.2 | 8.25277173811828 | -0.0527717381182817 |
| 15 | 8.1 | 7.92644016859092 | 0.173559831409081 |
| 16 | 7.9 | 8.0419949947903 | -0.141994994790301 |
| 17 | 8.6 | 8.5336564078851 | 0.0663435921149009 |
| 18 | 8.7 | 8.63617876618415 | 0.063821233815846 |
| 19 | 8.7 | 8.53934455094783 | 0.160655449052165 |
| 20 | 8.5 | 8.43489937714722 | 0.0651006228527828 |
| 21 | 8.4 | 8.27386123141247 | 0.126138768587527 |
| 22 | 8.5 | 8.48160027552018 | 0.0183997244798171 |
| 23 | 8.7 | 8.56245420073643 | 0.137545799263574 |
| 24 | 8.7 | 8.60729521009335 | 0.0927047899066517 |
| 25 | 8.6 | 8.38861391371658 | 0.211386086283422 |
| 26 | 8.5 | 8.22745514633074 | 0.272544853669264 |
| 27 | 8.3 | 8.18048761423107 | 0.119512385768936 |
| 28 | 8 | 8.01247447250433 | -0.0124744725043315 |
| 29 | 8.2 | 8.43639684149142 | -0.236396841491418 |
| 30 | 8.1 | 7.91245208082739 | 0.187547919172614 |
| 31 | 8.1 | 7.89596870119406 | 0.204031298805944 |
| 32 | 8 | 7.93540947660571 | 0.0645905233942918 |
| 33 | 7.9 | 7.9140533495848 | -0.0140533495848079 |
| 34 | 7.9 | 8.04984941908638 | -0.149849419086383 |
| 35 | 8 | 7.99102132558878 | 0.0089786744112186 |
| 36 | 8 | 7.968123290838 | 0.0318767091620054 |
| 37 | 7.9 | 7.82138496906736 | 0.0786150309326401 |
| 38 | 8 | 7.66022620168152 | 0.339773798318482 |
| 39 | 7.7 | 7.89262270700953 | -0.192622707009535 |
| 40 | 7.2 | 7.44104159735669 | -0.241041597356686 |
| 41 | 7.5 | 7.65754290352222 | -0.15754290352222 |
| 42 | 7.3 | 7.4171661107843 | -0.117166110784304 |
| 43 | 7 | 7.18905773783099 | -0.189057737830992 |
| 44 | 7 | 6.88139543170725 | 0.118604568292753 |
| 45 | 7 | 7.2155502472186 | -0.215550247218598 |
| 46 | 7.2 | 7.41908536082788 | -0.219085360827881 |
| 47 | 7.3 | 7.42649272525853 | -0.12649272525853 |
| 48 | 7.1 | 7.25970874129547 | -0.159708741295472 |
| 49 | 6.8 | 6.83360638209715 | -0.0336063820971483 |
| 50 | 6.4 | 6.53696952649589 | -0.136969526495887 |
| 51 | 6.1 | 6.21484188746695 | -0.114841887466954 |
| 52 | 6.5 | 6.12297565084478 | 0.37702434915522 |
| 53 | 7.7 | 7.59661512543492 | 0.103384874565084 |
| 54 | 7.9 | 7.96588972966638 | -0.0658897296663827 |
| 55 | 7.5 | 7.64902266011323 | -0.149022660113232 |
| 56 | 6.9 | 6.9139064368511 | -0.0139064368510995 |
| 57 | 6.6 | 6.48191211468552 | 0.118087885314481 |
| 58 | 6.9 | 6.69805901979008 | 0.201940980209921 |
| Goldfeld-Quandt test for Heteroskedasticity | |||
| p-values | Alternative Hypothesis | ||
| breakpoint index | greater | 2-sided | less |
| 19 | 0.128552176858067 | 0.257104353716135 | 0.871447823141933 |
| 20 | 0.0677591735051601 | 0.135518347010320 | 0.93224082649484 |
| 21 | 0.0741543405728778 | 0.148308681145756 | 0.925845659427122 |
| 22 | 0.140114937601667 | 0.280229875203334 | 0.859885062398333 |
| 23 | 0.0830864282323503 | 0.166172856464701 | 0.91691357176765 |
| 24 | 0.0419937064239044 | 0.0839874128478089 | 0.958006293576096 |
| 25 | 0.0293622041009852 | 0.0587244082019705 | 0.970637795899015 |
| 26 | 0.0546873749382419 | 0.109374749876484 | 0.945312625061758 |
| 27 | 0.0446880471996913 | 0.0893760943993827 | 0.95531195280031 |
| 28 | 0.023294262550278 | 0.046588525100556 | 0.976705737449722 |
| 29 | 0.0994541164545314 | 0.198908232909063 | 0.900545883545468 |
| 30 | 0.0651694570028667 | 0.130338914005733 | 0.934830542997133 |
| 31 | 0.0863957666270655 | 0.172791533254131 | 0.913604233372935 |
| 32 | 0.073222526972664 | 0.146445053945328 | 0.926777473027336 |
| 33 | 0.092733058727208 | 0.185466117454416 | 0.907266941272792 |
| 34 | 0.108215040721592 | 0.216430081443184 | 0.891784959278408 |
| 35 | 0.0818890591873015 | 0.163778118374603 | 0.918110940812699 |
| 36 | 0.0665907197209642 | 0.133181439441928 | 0.933409280279036 |
| 37 | 0.0448371592432377 | 0.0896743184864753 | 0.955162840756762 |
| 38 | 0.366230909200154 | 0.732461818400307 | 0.633769090799846 |
| 39 | 0.85895499718349 | 0.28209000563302 | 0.14104500281651 |
| Meta Analysis of Goldfeld-Quandt test for Heteroskedasticity | |||
| Description | # significant tests | % significant tests | OK/NOK |
| 1% type I error level | 0 | 0 | OK |
| 5% type I error level | 1 | 0.0476190476190476 | OK |
| 10% type I error level | 5 | 0.238095238095238 | NOK |