| Multiple Linear Regression - Estimated Regression Equation |
| Werkl[t] = + 1.42982007691866 -0.161193787467765Infl[t] + 0.929871660400964`M1(t)`[t] + 0.274012559640936`M2(t)`[t] -0.624835761341823`M3(t)`[t] + 0.251487269084980`M4(t)`[t] + 0.0239056796988475M1[t] -0.225226304943252M2[t] -0.22089214657853M3[t] -0.230237762317641M4[t] -0.000204885143931201M5[t] -0.149127441415511M6[t] -0.104503412749335M7[t] + 0.113480030247102M8[t] + 0.120527017026366M9[t] -0.150903024914468M10[t] -0.313224104489284M11[t] + e[t] |
| Multiple Linear Regression - Ordinary Least Squares | |||||
| Variable | Parameter | S.D. | T-STAT H0: parameter = 0 | 2-tail p-value | 1-tail p-value |
| (Intercept) | 1.42982007691866 | 0.377707 | 3.7855 | 0.000517 | 0.000259 |
| Infl | -0.161193787467765 | 0.050531 | -3.19 | 0.002807 | 0.001403 |
| `M1(t)` | 0.929871660400964 | 0.155055 | 5.9971 | 1e-06 | 0 |
| `M2(t)` | 0.274012559640936 | 0.198656 | 1.3793 | 0.175651 | 0.087825 |
| `M3(t)` | -0.624835761341823 | 0.199402 | -3.1336 | 0.003273 | 0.001637 |
| `M4(t)` | 0.251487269084980 | 0.132088 | 1.9039 | 0.064316 | 0.032158 |
| M1 | 0.0239056796988475 | 0.101803 | 0.2348 | 0.815574 | 0.407787 |
| M2 | -0.225226304943252 | 0.117582 | -1.9155 | 0.062784 | 0.031392 |
| M3 | -0.22089214657853 | 0.093864 | -2.3533 | 0.023743 | 0.011872 |
| M4 | -0.230237762317641 | 0.087698 | -2.6254 | 0.0123 | 0.00615 |
| M5 | -0.000204885143931201 | 0.094075 | -0.0022 | 0.998273 | 0.499137 |
| M6 | -0.149127441415511 | 0.111541 | -1.337 | 0.188979 | 0.09449 |
| M7 | -0.104503412749335 | 0.108288 | -0.965 | 0.340467 | 0.170234 |
| M8 | 0.113480030247102 | 0.096637 | 1.1743 | 0.247398 | 0.123699 |
| M9 | 0.120527017026366 | 0.118167 | 1.02 | 0.314029 | 0.157015 |
| M10 | -0.150903024914468 | 0.120953 | -1.2476 | 0.219612 | 0.109806 |
| M11 | -0.313224104489284 | 0.097684 | -3.2065 | 0.002683 | 0.001341 |
| Multiple Linear Regression - Regression Statistics | |
| Multiple R | 0.996807176456464 |
| R-squared | 0.993624547035107 |
| Adjusted R-squared | 0.991008976587972 |
| F-TEST (value) | 379.888275662138 |
| F-TEST (DF numerator) | 16 |
| F-TEST (DF denominator) | 39 |
| p-value | 0 |
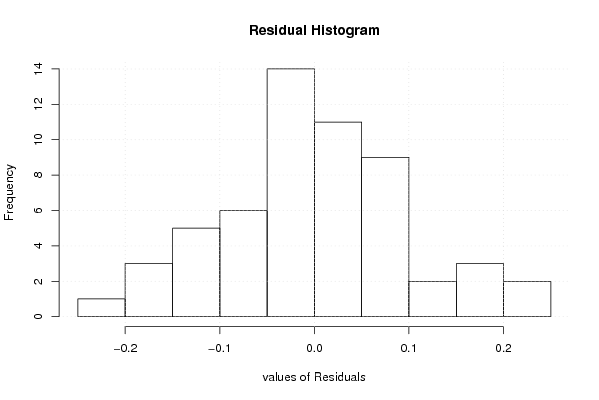
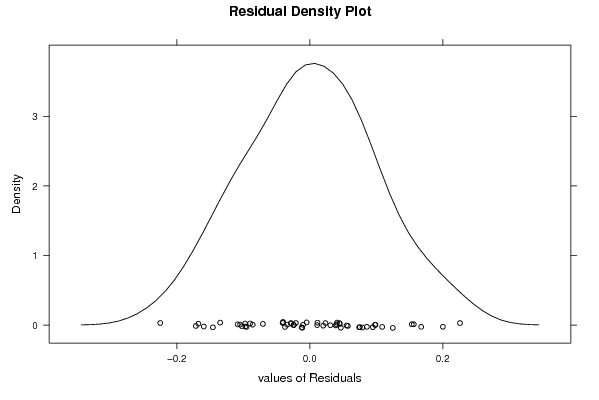
| Multiple Linear Regression - Residual Statistics | |
| Residual Standard Deviation | 0.116875093448220 |
| Sum Squared Residuals | 0.532731711272674 |
| Multiple Linear Regression - Actuals, Interpolation, and Residuals | |||
| Time or Index | Actuals | Interpolation Forecast | Residuals Prediction Error |
| 1 | 3.4 | 3.27509856672449 | 0.124901433275512 |
| 2 | 3.4 | 3.36102172086265 | 0.0389782791373494 |
| 3 | 3.5 | 3.39107640781747 | 0.108923592182528 |
| 4 | 3.2 | 3.30848270019482 | -0.108482700194818 |
| 5 | 3.3 | 3.33725278902933 | -0.0372527890293275 |
| 6 | 3.3 | 3.20110756975849 | 0.0988924302415132 |
| 7 | 3.4 | 3.50185168844658 | -0.101851688446578 |
| 8 | 3.7 | 3.64265378312988 | 0.0573462168701186 |
| 9 | 3.9 | 4.04568976588913 | -0.145689765889134 |
| 10 | 4 | 4.01219300528014 | -0.0121930052801432 |
| 11 | 3.7 | 3.86759835967312 | -0.167598359673116 |
| 12 | 3.9 | 3.87974125046333 | 0.0202587495366665 |
| 13 | 4.2 | 4.04358950827324 | 0.156410491726764 |
| 14 | 4.4 | 4.32470161024388 | 0.0752983897561186 |
| 15 | 4.3 | 4.39680053558722 | -0.0968005355872196 |
| 16 | 4.2 | 4.22823636989742 | -0.0282363698974241 |
| 17 | 4.3 | 4.28835985352407 | 0.0116401464759263 |
| 18 | 4.3 | 4.33392361602645 | -0.0339236160264512 |
| 19 | 4.3 | 4.45940312862918 | -0.159403128629182 |
| 20 | 4.5 | 4.58975426858294 | -0.089754268582938 |
| 21 | 5 | 4.92075996557833 | 0.0792400344216706 |
| 22 | 5.2 | 5.16906826576616 | 0.0309317342338359 |
| 23 | 5.2 | 5.20476064582365 | -0.00476064582364498 |
| 24 | 5.4 | 5.35902497162753 | 0.0409750283724701 |
| 25 | 5.5 | 5.58580084442747 | -0.085800844427473 |
| 26 | 5.4 | 5.53475599157065 | -0.134755991570653 |
| 27 | 5.5 | 5.33241770884423 | 0.167582291155769 |
| 28 | 5.4 | 5.37647188086394 | 0.0235281191360633 |
| 29 | 5.7 | 5.6446705297511 | 0.0553294702488997 |
| 30 | 5.7 | 5.65967591259304 | 0.0403240874069642 |
| 31 | 6.1 | 5.87413601219417 | 0.225863987805826 |
| 32 | 6.5 | 6.29982680028028 | 0.20017319971972 |
| 33 | 6.9 | 6.9283511707889 | -0.0283511707889048 |
| 34 | 6.8 | 6.90465989107488 | -0.104659891074879 |
| 35 | 6.7 | 6.62573665116038 | 0.07426334883962 |
| 36 | 6.6 | 6.6208748005024 | -0.0208748005024079 |
| 37 | 6.5 | 6.67135116321846 | -0.171351163218463 |
| 38 | 6.4 | 6.35528498454463 | 0.0447150154553664 |
| 39 | 6.1 | 6.32492370637118 | -0.224923706371181 |
| 40 | 6.2 | 6.04655018577337 | 0.153449814226630 |
| 41 | 6.3 | 6.34082068906736 | -0.0408206890673564 |
| 42 | 6.4 | 6.41011104130691 | -0.0101110413069089 |
| 43 | 6.5 | 6.45331311386438 | 0.0466868861356242 |
| 44 | 6.7 | 6.7704695083861 | -0.0704695083860944 |
| 45 | 7 | 6.90519909774363 | 0.0948009022563681 |
| 46 | 7 | 6.91407883787881 | 0.0859211621211865 |
| 47 | 6.8 | 6.70190434334286 | 0.0980956566571407 |
| 48 | 6.7 | 6.74035897740673 | -0.0403589774067283 |
| 49 | 6.7 | 6.72415991735634 | -0.0241599173563395 |
| 50 | 6.5 | 6.52423569277818 | -0.0242356927781820 |
| 51 | 6.4 | 6.3547816413799 | 0.0452183586201034 |
| 52 | 6.1 | 6.14025886327045 | -0.040258863270452 |
| 53 | 6.2 | 6.18889613862814 | 0.0111038613718579 |
| 54 | 6 | 6.09518186031512 | -0.0951818603151173 |
| 55 | 6.1 | 6.11129605686569 | -0.0112960568656909 |
| 56 | 6.1 | 6.1972956396208 | -0.0972956396208063 |
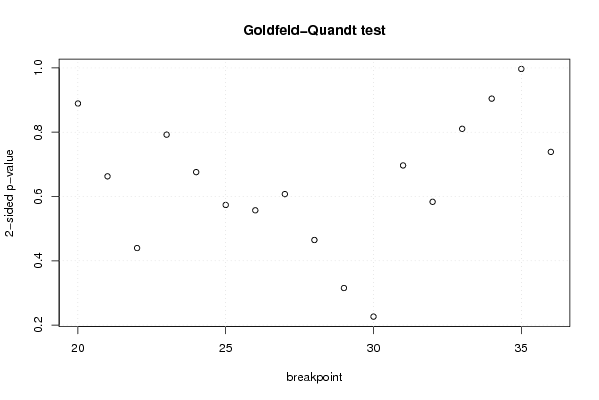
| Goldfeld-Quandt test for Heteroskedasticity | |||
| p-values | Alternative Hypothesis | ||
| breakpoint index | greater | 2-sided | less |
| 20 | 0.444609482169224 | 0.889218964338448 | 0.555390517830776 |
| 21 | 0.331363661541434 | 0.662727323082869 | 0.668636338458566 |
| 22 | 0.219802344045940 | 0.439604688091879 | 0.78019765595406 |
| 23 | 0.396147561896778 | 0.792295123793556 | 0.603852438103222 |
| 24 | 0.337892565477966 | 0.675785130955932 | 0.662107434522034 |
| 25 | 0.286841858082224 | 0.573683716164447 | 0.713158141917776 |
| 26 | 0.278514984570846 | 0.557029969141691 | 0.721485015429155 |
| 27 | 0.303692115391616 | 0.607384230783233 | 0.696307884608384 |
| 28 | 0.232324628376928 | 0.464649256753855 | 0.767675371623072 |
| 29 | 0.157637251458795 | 0.315274502917589 | 0.842362748541205 |
| 30 | 0.113104715705583 | 0.226209431411165 | 0.886895284294417 |
| 31 | 0.34828830891974 | 0.69657661783948 | 0.65171169108026 |
| 32 | 0.708270493012058 | 0.583459013975884 | 0.291729506987942 |
| 33 | 0.594740216237934 | 0.810519567524133 | 0.405259783762066 |
| 34 | 0.54782766782052 | 0.90434466435896 | 0.45217233217948 |
| 35 | 0.498366910491389 | 0.996733820982778 | 0.501633089508611 |
| 36 | 0.369362786686858 | 0.738725573373716 | 0.630637213313142 |
| Meta Analysis of Goldfeld-Quandt test for Heteroskedasticity | |||
| Description | # significant tests | % significant tests | OK/NOK |
| 1% type I error level | 0 | 0 | OK |
| 5% type I error level | 0 | 0 | OK |
| 10% type I error level | 0 | 0 | OK |