| Multiple Linear Regression - Estimated Regression Equation |
| S.[t] = + 5.10746822236075 + 0.395127428651407E.S.[t] + e[t] |
| Multiple Linear Regression - Ordinary Least Squares | |||||
| Variable | Parameter | S.D. | T-STAT H0: parameter = 0 | 2-tail p-value | 1-tail p-value |
| (Intercept) | 5.10746822236075 | 2.256009 | 2.2639 | 0.027269 | 0.013634 |
| E.S. | 0.395127428651407 | 0.070181 | 5.6301 | 1e-06 | 0 |
| Multiple Linear Regression - Regression Statistics | |
| Multiple R | 0.591175992644067 |
| R-squared | 0.349489054278698 |
| Adjusted R-squared | 0.338463445029184 |
| F-TEST (value) | 31.6979358119476 |
| F-TEST (DF numerator) | 1 |
| F-TEST (DF denominator) | 59 |
| p-value | 5.26712907955584e-07 |
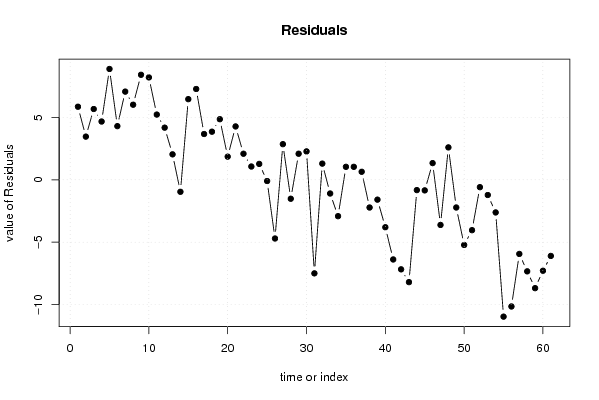
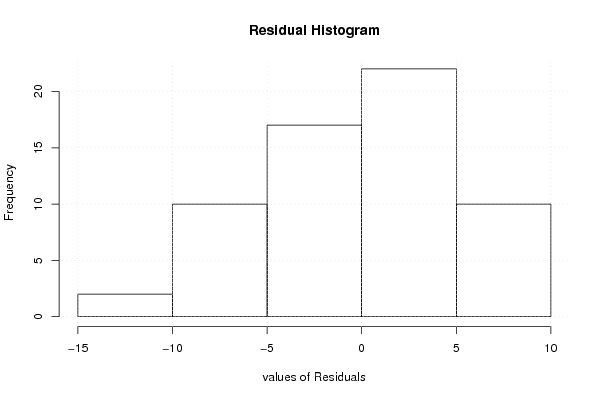
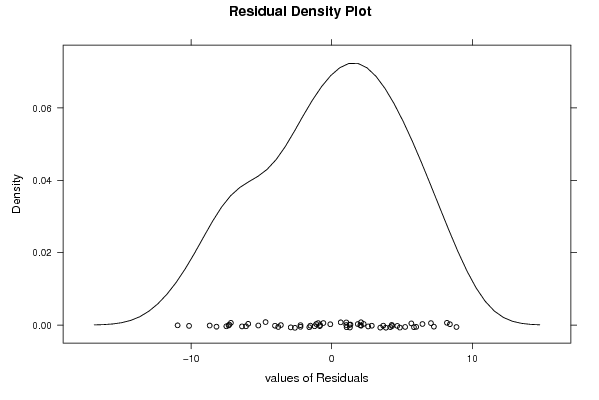
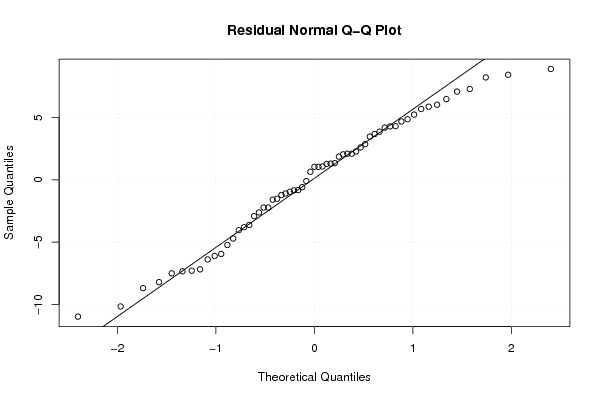
| Multiple Linear Regression - Residual Statistics | |
| Residual Standard Deviation | 5.038238229328 |
| Sum Squared Residuals | 1497.64682287227 |
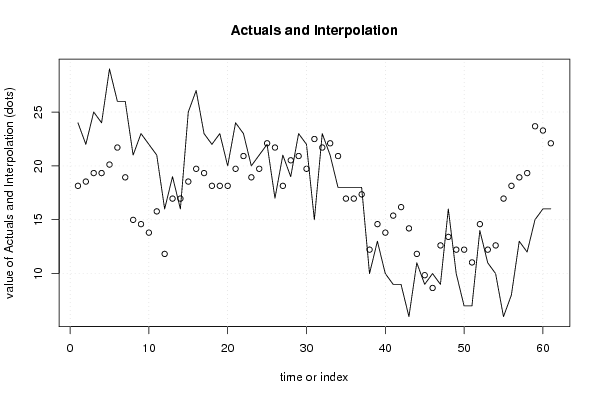
| Multiple Linear Regression - Actuals, Interpolation, and Residuals | |||
| Time or Index | Actuals | Interpolation Forecast | Residuals Prediction Error |
| 1 | 24 | 18.1466733678572 | 5.85332663214276 |
| 2 | 22 | 18.5418007965086 | 3.45819920349143 |
| 3 | 25 | 19.3320556538114 | 5.66794434618859 |
| 4 | 24 | 19.3320556538114 | 4.66794434618859 |
| 5 | 29 | 20.1223105111142 | 8.87768948888578 |
| 6 | 26 | 21.7028202257198 | 4.29717977428015 |
| 7 | 26 | 18.93692822516 | 7.06307177484 |
| 8 | 21 | 14.9856539386459 | 6.01434606135406 |
| 9 | 23 | 14.5905265099945 | 8.40947349000547 |
| 10 | 22 | 13.8002716526917 | 8.19972834730829 |
| 11 | 21 | 15.7759087959487 | 5.22409120405125 |
| 12 | 16 | 11.8246345094347 | 4.17536549056532 |
| 13 | 19 | 16.9612910819030 | 2.03870891809703 |
| 14 | 16 | 16.9612910819030 | -0.961291081902967 |
| 15 | 25 | 18.5418007965086 | 6.4581992034914 |
| 16 | 27 | 19.7271830824628 | 7.27281691753719 |
| 17 | 23 | 19.3320556538114 | 3.66794434618859 |
| 18 | 22 | 18.1466733678572 | 3.85332663214281 |
| 19 | 23 | 18.1466733678572 | 4.85332663214281 |
| 20 | 20 | 18.1466733678572 | 1.85332663214281 |
| 21 | 24 | 19.7271830824628 | 4.27281691753719 |
| 22 | 23 | 20.9125653684170 | 2.08743463158297 |
| 23 | 20 | 18.93692822516 | 1.06307177484 |
| 24 | 21 | 19.7271830824628 | 1.27281691753719 |
| 25 | 22 | 22.0979476543713 | -0.097947654371254 |
| 26 | 17 | 21.7028202257198 | -4.70282022571985 |
| 27 | 21 | 18.1466733678572 | 2.85332663214281 |
| 28 | 19 | 20.5174379397656 | -1.51743793976563 |
| 29 | 23 | 20.9125653684170 | 2.08743463158297 |
| 30 | 22 | 19.7271830824628 | 2.27281691753719 |
| 31 | 15 | 22.4930750830227 | -7.49307508302266 |
| 32 | 23 | 21.7028202257198 | 1.29717977428015 |
| 33 | 21 | 22.0979476543713 | -1.09794765437125 |
| 34 | 18 | 20.9125653684170 | -2.91256536841703 |
| 35 | 18 | 16.9612910819030 | 1.03870891809703 |
| 36 | 18 | 16.9612910819030 | 1.03870891809703 |
| 37 | 18 | 17.3564185105544 | 0.643581489445626 |
| 38 | 10 | 12.2197619380861 | -2.21976193808609 |
| 39 | 13 | 14.5905265099945 | -1.59052650999453 |
| 40 | 10 | 13.8002716526917 | -3.80027165269171 |
| 41 | 9 | 15.3807813672973 | -6.38078136729734 |
| 42 | 9 | 16.1710362246002 | -7.17103622460015 |
| 43 | 6 | 14.1953990813431 | -8.19539908134312 |
| 44 | 11 | 11.8246345094347 | -0.82463450943468 |
| 45 | 9 | 9.84899736617765 | -0.848997366177649 |
| 46 | 10 | 8.66361508022343 | 1.33638491977657 |
| 47 | 9 | 12.6148893667375 | -3.61488936673749 |
| 48 | 16 | 13.4051442240403 | 2.59485577595969 |
| 49 | 10 | 12.2197619380861 | -2.21976193808609 |
| 50 | 7 | 12.2197619380861 | -5.21976193808609 |
| 51 | 7 | 11.0343796521319 | -4.03437965213187 |
| 52 | 14 | 14.5905265099945 | -0.590526509994528 |
| 53 | 11 | 12.2197619380861 | -1.21976193808609 |
| 54 | 10 | 12.6148893667375 | -2.61488936673749 |
| 55 | 6 | 16.9612910819030 | -10.9612910819030 |
| 56 | 8 | 18.1466733678572 | -10.1466733678572 |
| 57 | 13 | 18.93692822516 | -5.93692822516 |
| 58 | 12 | 19.3320556538114 | -7.33205565381141 |
| 59 | 15 | 23.6784573689769 | -8.67845736897688 |
| 60 | 16 | 23.2833299403255 | -7.28332994032548 |
| 61 | 16 | 22.0979476543713 | -6.09794765437125 |
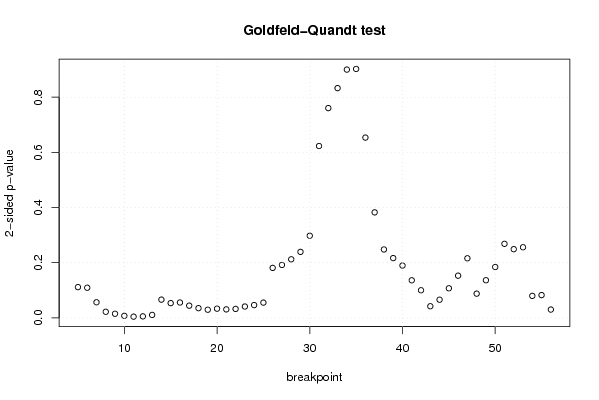
| Goldfeld-Quandt test for Heteroskedasticity | |||
| p-values | Alternative Hypothesis | ||
| breakpoint index | greater | 2-sided | less |
| 5 | 0.0557612081923069 | 0.111522416384614 | 0.944238791807693 |
| 6 | 0.0546545794530045 | 0.109309158906009 | 0.945345420546996 |
| 7 | 0.0283053355045916 | 0.0566106710091831 | 0.971694664495408 |
| 8 | 0.0110591414121162 | 0.0221182828242324 | 0.988940858587884 |
| 9 | 0.00749246328682713 | 0.0149849265736543 | 0.992507536713173 |
| 10 | 0.00372816367146925 | 0.0074563273429385 | 0.99627183632853 |
| 11 | 0.00225045234780598 | 0.00450090469561196 | 0.997749547652194 |
| 12 | 0.00277509539631452 | 0.00555019079262904 | 0.997224904603685 |
| 13 | 0.00538864864423385 | 0.0107772972884677 | 0.994611351355766 |
| 14 | 0.0330982161443004 | 0.0661964322886008 | 0.9669017838557 |
| 15 | 0.0267693042387095 | 0.0535386084774189 | 0.97323069576129 |
| 16 | 0.0279020792688824 | 0.0558041585377648 | 0.972097920731118 |
| 17 | 0.0221667641816602 | 0.0443335283633204 | 0.97783323581834 |
| 18 | 0.0176452173028569 | 0.0352904346057137 | 0.982354782697143 |
| 19 | 0.0148323122081880 | 0.0296646244163760 | 0.985167687791812 |
| 20 | 0.0166999054835323 | 0.0333998109670646 | 0.983300094516468 |
| 21 | 0.0154312900140408 | 0.0308625800280816 | 0.98456870998596 |
| 22 | 0.0162880525122162 | 0.0325761050244323 | 0.983711947487784 |
| 23 | 0.0206046652267144 | 0.0412093304534289 | 0.979395334773286 |
| 24 | 0.0232183790832516 | 0.0464367581665033 | 0.976781620916748 |
| 25 | 0.0276868273846278 | 0.0553736547692556 | 0.972313172615372 |
| 26 | 0.0906323757352462 | 0.181264751470492 | 0.909367624264754 |
| 27 | 0.095948496503149 | 0.191896993006298 | 0.90405150349685 |
| 28 | 0.106165500939976 | 0.212331001879952 | 0.893834499060024 |
| 29 | 0.119664759800560 | 0.239329519601121 | 0.88033524019944 |
| 30 | 0.148861193631211 | 0.297722387262423 | 0.851138806368789 |
| 31 | 0.311495138865389 | 0.622990277730779 | 0.68850486113461 |
| 32 | 0.380204651702648 | 0.760409303405296 | 0.619795348297352 |
| 33 | 0.416412013581423 | 0.832824027162846 | 0.583587986418577 |
| 34 | 0.44999322454458 | 0.89998644908916 | 0.55000677545542 |
| 35 | 0.548827207564037 | 0.902345584871925 | 0.451172792435962 |
| 36 | 0.673225148250941 | 0.653549703498119 | 0.326774851749059 |
| 37 | 0.808762330248808 | 0.382475339502385 | 0.191237669751192 |
| 38 | 0.875969153388706 | 0.248061693222587 | 0.124030846611294 |
| 39 | 0.891621734913653 | 0.216756530172694 | 0.108378265086347 |
| 40 | 0.905100319522335 | 0.189799360955330 | 0.0948996804776652 |
| 41 | 0.931849999783479 | 0.136300000433043 | 0.0681500002165213 |
| 42 | 0.949943027853645 | 0.100113944292709 | 0.0500569721463546 |
| 43 | 0.978876501578052 | 0.0422469968438954 | 0.0211234984219477 |
| 44 | 0.967030186288343 | 0.0659396274233142 | 0.0329698137116571 |
| 45 | 0.946364325518414 | 0.107271348963172 | 0.053635674481586 |
| 46 | 0.9234797448632 | 0.153040510273599 | 0.0765202551367997 |
| 47 | 0.891988286388706 | 0.216023427222588 | 0.108011713611294 |
| 48 | 0.956055575611605 | 0.0878888487767904 | 0.0439444243883952 |
| 49 | 0.931767811690497 | 0.136464376619005 | 0.0682321883095025 |
| 50 | 0.907762701577535 | 0.184474596844930 | 0.0922372984224652 |
| 51 | 0.865745863998316 | 0.268508272003367 | 0.134254136001684 |
| 52 | 0.875461435044739 | 0.249077129910523 | 0.124538564955261 |
| 53 | 0.8720215041222 | 0.2559569917556 | 0.1279784958778 |
| 54 | 0.960087330967138 | 0.0798253380657243 | 0.0399126690328622 |
| 55 | 0.958708136476097 | 0.0825837270478068 | 0.0412918635239034 |
| 56 | 0.984896404211323 | 0.0302071915773544 | 0.0151035957886772 |
| Meta Analysis of Goldfeld-Quandt test for Heteroskedasticity | |||
| Description | # significant tests | % significant tests | OK/NOK |
| 1% type I error level | 3 | 0.0576923076923077 | NOK |
| 5% type I error level | 16 | 0.307692307692308 | NOK |
| 10% type I error level | 25 | 0.480769230769231 | NOK |