| Multiple Linear Regression - Estimated Regression Equation |
| S.[t] = + 5.29372655439379 + 0.400869981642590E.S.[t] -0.35576928193259M1[t] -2.27843403304333M2[t] + 1.52156596695666M3[t] + 0.838782025700374M4[t] + 1.03878202570037M5[t] -0.241391970628143M6[t] -3.32243594859925M7[t] -0.71982600367148M8[t] + 0.6M9[t] -0.079304014685929M10[t] -1.36121797429962M11[t] + e[t] |
| Multiple Linear Regression - Ordinary Least Squares | |||||
| Variable | Parameter | S.D. | T-STAT H0: parameter = 0 | 2-tail p-value | 1-tail p-value |
| (Intercept) | 5.29372655439379 | 3.325294 | 1.592 | 0.117959 | 0.05898 |
| E.S. | 0.400869981642590 | 0.076001 | 5.2745 | 3e-06 | 2e-06 |
| M1 | -0.35576928193259 | 3.264875 | -0.109 | 0.913682 | 0.456841 |
| M2 | -2.27843403304333 | 3.405549 | -0.669 | 0.506678 | 0.253339 |
| M3 | 1.52156596695666 | 3.405549 | 0.4468 | 0.657036 | 0.328518 |
| M4 | 0.838782025700374 | 3.404463 | 0.2464 | 0.806441 | 0.40322 |
| M5 | 1.03878202570037 | 3.404463 | 0.3051 | 0.761591 | 0.380796 |
| M6 | -0.241391970628143 | 3.404972 | -0.0709 | 0.943777 | 0.471888 |
| M7 | -3.32243594859925 | 3.409447 | -0.9745 | 0.334704 | 0.167352 |
| M8 | -0.71982600367148 | 3.402834 | -0.2115 | 0.833364 | 0.416682 |
| M9 | 0.6 | 3.4028 | 0.1763 | 0.86078 | 0.43039 |
| M10 | -0.079304014685929 | 3.403343 | -0.0233 | 0.981506 | 0.490753 |
| M11 | -1.36121797429962 | 3.404463 | -0.3998 | 0.691053 | 0.345526 |
| Multiple Linear Regression - Regression Statistics | |
| Multiple R | 0.62965823162227 |
| R-squared | 0.396469488649684 |
| Adjusted R-squared | 0.245586860812105 |
| F-TEST (value) | 2.62766823677324 |
| F-TEST (DF numerator) | 12 |
| F-TEST (DF denominator) | 48 |
| p-value | 0.00881546071620987 |
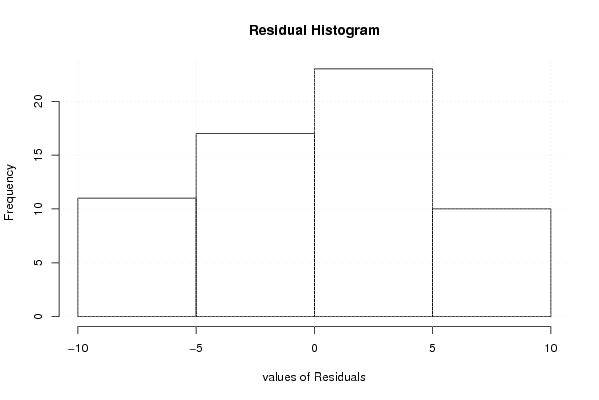
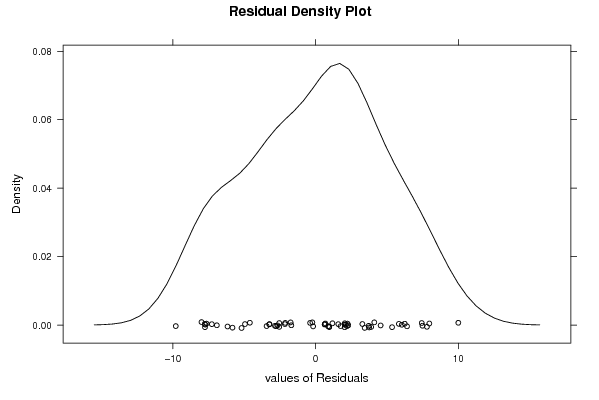
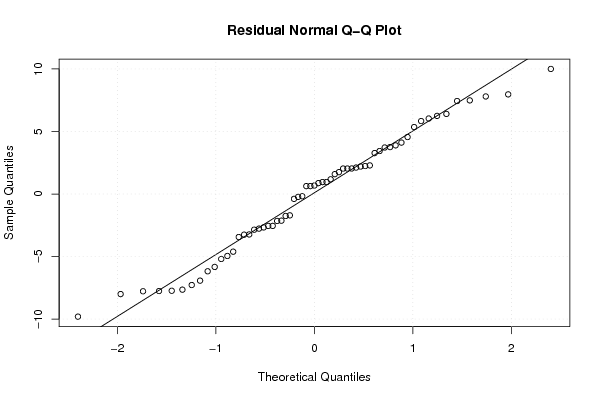
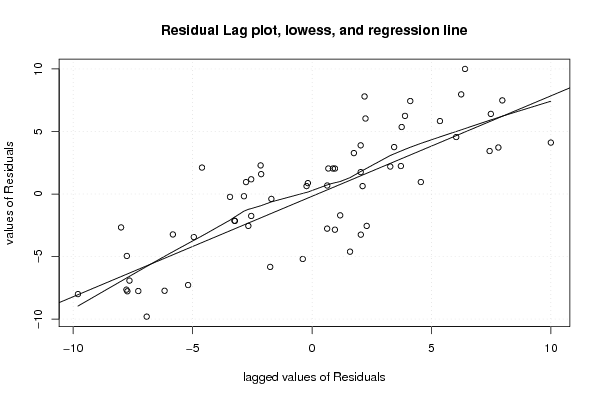
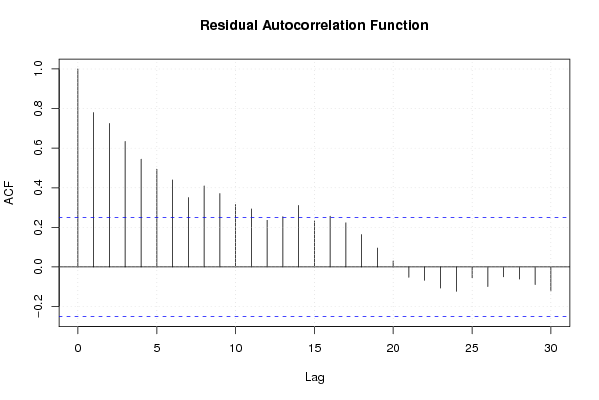
| Multiple Linear Regression - Residual Statistics | |
| Residual Standard Deviation | 5.38029882265957 |
| Sum Squared Residuals | 1389.48554021337 |
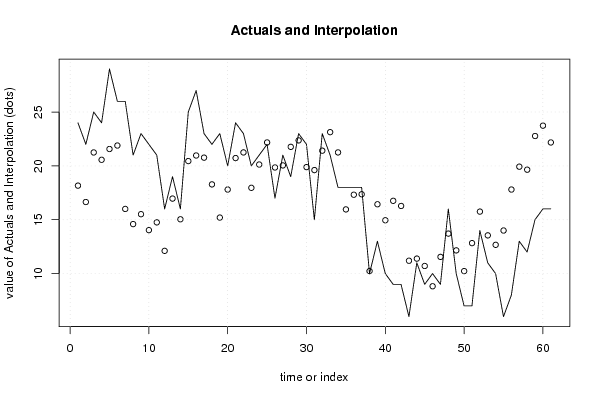
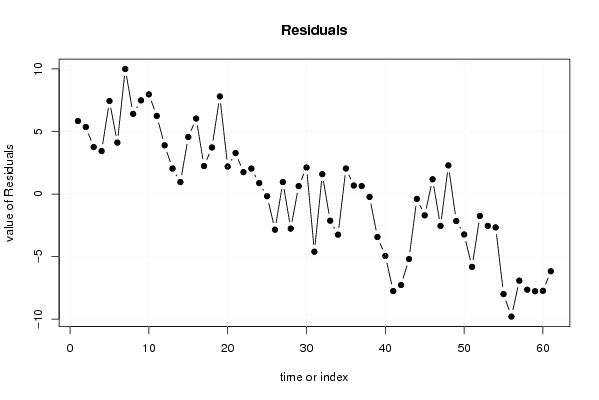
| Multiple Linear Regression - Actuals, Interpolation, and Residuals | |||
| Time or Index | Actuals | Interpolation Forecast | Residuals Prediction Error |
| 1 | 24 | 18.1666666666667 | 5.83333333333329 |
| 2 | 22 | 16.6448718971985 | 5.35512810280152 |
| 3 | 25 | 21.2466118604837 | 3.75338813951632 |
| 4 | 24 | 20.5638279192274 | 3.43617208077261 |
| 5 | 29 | 21.5655678825126 | 7.43443211748743 |
| 6 | 26 | 21.8888738127544 | 4.11112618724559 |
| 7 | 26 | 16.0017399632852 | 9.99826003671482 |
| 8 | 21 | 14.5956500917870 | 6.40434990821295 |
| 9 | 23 | 15.5146061138159 | 7.48539388618406 |
| 10 | 22 | 14.0335621358448 | 7.96643786415516 |
| 11 | 21 | 14.7559980844441 | 6.24400191555591 |
| 12 | 16 | 12.1085162423178 | 3.89148375768218 |
| 13 | 19 | 16.9640567217389 | 2.03594327826111 |
| 14 | 16 | 15.0413919706281 | 0.958608029371852 |
| 15 | 25 | 20.4448718971985 | 4.5551281028015 |
| 16 | 27 | 20.96469790087 | 6.03530209913002 |
| 17 | 23 | 20.7638279192274 | 2.23617208077261 |
| 18 | 22 | 18.2810439779711 | 3.71895602202889 |
| 19 | 23 | 15.2 | 7.8 |
| 20 | 20 | 17.8026099449278 | 2.19739005507223 |
| 21 | 24 | 20.7259158751696 | 3.27408412483039 |
| 22 | 23 | 21.2492218054114 | 1.75077819458855 |
| 23 | 20 | 17.9629579375848 | 2.03704206241520 |
| 24 | 21 | 20.1259158751696 | 0.874084124830393 |
| 25 | 22 | 22.1753664830925 | -0.175366483092550 |
| 26 | 17 | 19.8518317503392 | -2.85183175033922 |
| 27 | 21 | 20.0440019155559 | 0.95599808444409 |
| 28 | 19 | 21.7664378641552 | -2.76643786415516 |
| 29 | 23 | 22.3673078457978 | 0.63269215420225 |
| 30 | 22 | 19.8845239045415 | 2.11547609545854 |
| 31 | 15 | 19.6095697980685 | -4.60956979806848 |
| 32 | 23 | 21.4104397797111 | 1.58956022028893 |
| 33 | 21 | 23.1311357650251 | -2.13113576502514 |
| 34 | 18 | 21.2492218054114 | -3.24922180541145 |
| 35 | 18 | 15.9586080293719 | 2.04139197062814 |
| 36 | 18 | 17.3198260036715 | 0.680173996328518 |
| 37 | 18 | 17.3649267033815 | 0.635073296618521 |
| 38 | 10 | 10.2309521909171 | -0.230952190917076 |
| 39 | 13 | 16.4361720807726 | -3.43617208077261 |
| 40 | 10 | 14.9516481762311 | -4.95164817623114 |
| 41 | 9 | 16.7551281028015 | -7.7551281028015 |
| 42 | 9 | 16.2766940697582 | -7.27669406975816 |
| 43 | 6 | 11.1913001835741 | -5.19130018357411 |
| 44 | 11 | 11.3886902386463 | -0.388690238646338 |
| 45 | 9 | 10.7041663341049 | -1.70416633410488 |
| 46 | 10 | 8.82225237449118 | 1.17774762550882 |
| 47 | 9 | 11.5490382313034 | -2.54903823130338 |
| 48 | 16 | 13.7119961688882 | 2.28800383111182 |
| 49 | 10 | 12.1536169420278 | -2.15361694202782 |
| 50 | 7 | 10.2309521909171 | -3.23095219091708 |
| 51 | 7 | 12.8283422459893 | -5.8283422459893 |
| 52 | 14 | 15.7533881395163 | -1.75338813951632 |
| 53 | 11 | 13.5481682496608 | -2.54816824966079 |
| 54 | 10 | 12.6688642349749 | -2.66886423497486 |
| 55 | 6 | 13.9973900550722 | -7.99739005507223 |
| 56 | 8 | 17.8026099449278 | -9.80260994492777 |
| 57 | 13 | 19.9241759118844 | -6.92417591188443 |
| 58 | 12 | 19.6457418788411 | -7.64574187884109 |
| 59 | 15 | 22.7733977172959 | -7.77339771729588 |
| 60 | 16 | 23.7337457099529 | -7.73374570995291 |
| 61 | 16 | 22.1753664830926 | -6.17536648309255 |
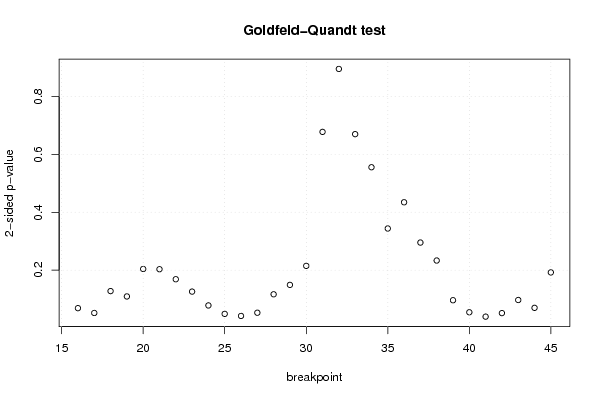
| Goldfeld-Quandt test for Heteroskedasticity | |||
| p-values | Alternative Hypothesis | ||
| breakpoint index | greater | 2-sided | less |
| 16 | 0.0343445118019451 | 0.0686890236038901 | 0.965655488198055 |
| 17 | 0.0260192889578656 | 0.0520385779157311 | 0.973980711042134 |
| 18 | 0.0638090292559883 | 0.127618058511977 | 0.936190970744012 |
| 19 | 0.0545697298288899 | 0.109139459657780 | 0.94543027017111 |
| 20 | 0.102010460358928 | 0.204020920717856 | 0.897989539641072 |
| 21 | 0.101605476698440 | 0.203210953396880 | 0.89839452330156 |
| 22 | 0.0843411421510161 | 0.168682284302032 | 0.915658857848984 |
| 23 | 0.0629388088607004 | 0.125877617721401 | 0.9370611911393 |
| 24 | 0.0390410090077631 | 0.0780820180155262 | 0.960958990992237 |
| 25 | 0.0244545086943207 | 0.0489090173886414 | 0.97554549130568 |
| 26 | 0.0208573148729593 | 0.0417146297459187 | 0.97914268512704 |
| 27 | 0.0264345199960455 | 0.0528690399920911 | 0.973565480003954 |
| 28 | 0.0582830234172677 | 0.116566046834535 | 0.941716976582732 |
| 29 | 0.0745209097453136 | 0.149041819490627 | 0.925479090254686 |
| 30 | 0.107397316201122 | 0.214794632402244 | 0.892602683798878 |
| 31 | 0.338942778746247 | 0.677885557492493 | 0.661057221253753 |
| 32 | 0.552326697845922 | 0.895346604308156 | 0.447673302154078 |
| 33 | 0.664991082529348 | 0.670017834941304 | 0.335008917470652 |
| 34 | 0.722191795481039 | 0.555616409037922 | 0.277808204518961 |
| 35 | 0.828017922151875 | 0.343964155696251 | 0.171982077848125 |
| 36 | 0.782701180013068 | 0.434597639973865 | 0.217298819986932 |
| 37 | 0.85231620676747 | 0.295367586465062 | 0.147683793232531 |
| 38 | 0.883361289061262 | 0.233277421877477 | 0.116638710938738 |
| 39 | 0.951956653499143 | 0.0960866930017131 | 0.0480433465008566 |
| 40 | 0.972764913807646 | 0.0544701723847089 | 0.0272350861923545 |
| 41 | 0.980347872462071 | 0.0393042550758582 | 0.0196521275379291 |
| 42 | 0.974190727130412 | 0.0516185457391762 | 0.0258092728695881 |
| 43 | 0.951579382240186 | 0.0968412355196279 | 0.0484206177598139 |
| 44 | 0.965121969359513 | 0.0697560612809735 | 0.0348780306404868 |
| 45 | 0.903899332675134 | 0.192201334649732 | 0.0961006673248658 |
| Meta Analysis of Goldfeld-Quandt test for Heteroskedasticity | |||
| Description | # significant tests | % significant tests | OK/NOK |
| 1% type I error level | 0 | 0 | OK |
| 5% type I error level | 3 | 0.1 | NOK |
| 10% type I error level | 12 | 0.4 | NOK |