| Multiple Linear Regression - Estimated Regression Equation |
| Y[t] = + 1.56514265470901 -0.0235758497816096X[t] + 1.68719399153885Y1[t] -1.29343276756586Y2[t] + 0.427683431917404Y3[t] -0.107427644430209M1[t] -0.102812179996442M2[t] -0.0659199587151479M3[t] + 0.652841864527273M4[t] -0.524351028227446M5[t] + 0.190058289082015M6[t] -0.0635255450432869M7[t] + 0.024688860327307M8[t] + 0.179878647393655M9[t] + 0.0186545225372861M10[t] -0.0493315602915095M11[t] -0.00590513855989933t + e[t] |
| Multiple Linear Regression - Ordinary Least Squares | |||||
| Variable | Parameter | S.D. | T-STAT H0: parameter = 0 | 2-tail p-value | 1-tail p-value |
| (Intercept) | 1.56514265470901 | 0.697048 | 2.2454 | 0.030338 | 0.015169 |
| X | -0.0235758497816096 | 0.09254 | -0.2548 | 0.80021 | 0.400105 |
| Y1 | 1.68719399153885 | 0.143836 | 11.73 | 0 | 0 |
| Y2 | -1.29343276756586 | 0.225728 | -5.73 | 1e-06 | 1e-06 |
| Y3 | 0.427683431917404 | 0.148415 | 2.8817 | 0.006332 | 0.003166 |
| M1 | -0.107427644430209 | 0.11756 | -0.9138 | 0.366291 | 0.183146 |
| M2 | -0.102812179996442 | 0.121311 | -0.8475 | 0.401753 | 0.200876 |
| M3 | -0.0659199587151479 | 0.124228 | -0.5306 | 0.598604 | 0.299302 |
| M4 | 0.652841864527273 | 0.12499 | 5.2232 | 6e-06 | 3e-06 |
| M5 | -0.524351028227446 | 0.159282 | -3.292 | 0.002085 | 0.001043 |
| M6 | 0.190058289082015 | 0.139563 | 1.3618 | 0.180878 | 0.090439 |
| M7 | -0.0635255450432869 | 0.116041 | -0.5474 | 0.587117 | 0.293559 |
| M8 | 0.024688860327307 | 0.119373 | 0.2068 | 0.837198 | 0.418599 |
| M9 | 0.179878647393655 | 0.123432 | 1.4573 | 0.152837 | 0.076418 |
| M10 | 0.0186545225372861 | 0.13159 | 0.1418 | 0.887979 | 0.44399 |
| M11 | -0.0493315602915095 | 0.123996 | -0.3978 | 0.692858 | 0.346429 |
| t | -0.00590513855989933 | 0.002615 | -2.2582 | 0.029459 | 0.014729 |
| Multiple Linear Regression - Regression Statistics | |
| Multiple R | 0.980473640173153 |
| R-squared | 0.961328559074393 |
| Adjusted R-squared | 0.94585998270415 |
| F-TEST (value) | 62.1471902820818 |
| F-TEST (DF numerator) | 16 |
| F-TEST (DF denominator) | 40 |
| p-value | 0 |
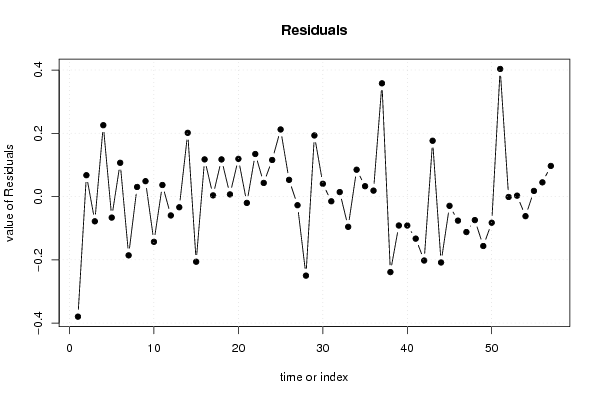
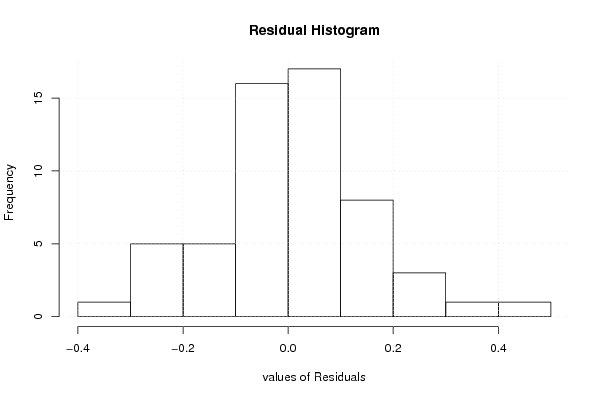
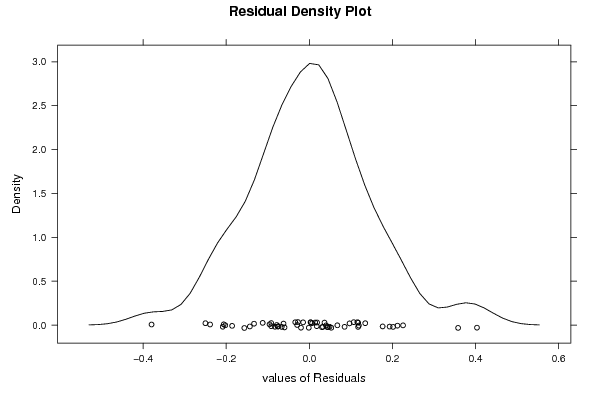
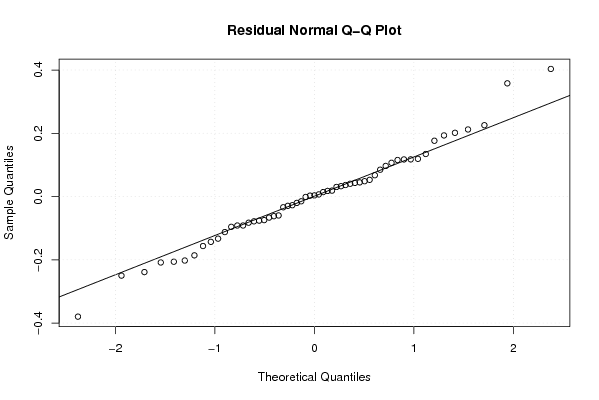
| Multiple Linear Regression - Residual Statistics | |
| Residual Standard Deviation | 0.17190528237177 |
| Sum Squared Residuals | 1.18205704429272 |
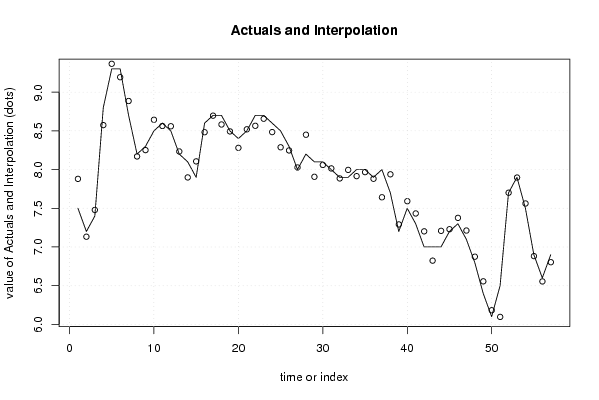
| Multiple Linear Regression - Actuals, Interpolation, and Residuals | |||
| Time or Index | Actuals | Interpolation Forecast | Residuals Prediction Error |
| 1 | 7.5 | 7.87969419097671 | -0.379694190976713 |
| 2 | 7.2 | 7.13259736421066 | 0.0674026357893358 |
| 3 | 7.4 | 7.47833074756439 | -0.07833074756439 |
| 4 | 8.8 | 8.57450931529052 | 0.225490684709479 |
| 5 | 9.3 | 9.3664912890419 | -0.0664912890418988 |
| 6 | 9.3 | 9.19332327535216 | 0.106676724647840 |
| 7 | 8.7 | 8.8858747235684 | -0.185874723568395 |
| 8 | 8.2 | 8.16970931141448 | 0.0302906885855227 |
| 9 | 8.3 | 8.25145662469102 | 0.0485433753089818 |
| 10 | 8.5 | 8.64315308506113 | -0.143153085061126 |
| 11 | 8.6 | 8.56351566926491 | 0.0364843307350891 |
| 12 | 8.5 | 8.55974327982898 | -0.0597432798289745 |
| 13 | 8.2 | 8.23388450731188 | -0.0338845073118772 |
| 14 | 8.1 | 7.89854825567241 | 0.201451744327586 |
| 15 | 7.9 | 8.10607742631794 | -0.206077426317943 |
| 16 | 8.6 | 8.48253355987406 | 0.117466440125940 |
| 17 | 8.7 | 8.69638953295807 | 0.00361046704193212 |
| 18 | 8.7 | 8.58267348718193 | 0.117326512818069 |
| 19 | 8.5 | 8.49321964008233 | 0.00678035991767395 |
| 20 | 8.4 | 8.280858451777 | 0.119141548223009 |
| 21 | 8.5 | 8.52011025464273 | -0.0201102546427272 |
| 22 | 8.7 | 8.56550698075345 | 0.134493019246550 |
| 23 | 8.7 | 8.6569429377242 | 0.0430570622758021 |
| 24 | 8.6 | 8.48445114913438 | 0.115548850865624 |
| 25 | 8.5 | 8.28793565337386 | 0.212064346626136 |
| 26 | 8.3 | 8.24726985685043 | 0.0527301431495681 |
| 27 | 8 | 8.0273930748289 | -0.0273930748289036 |
| 28 | 8.2 | 8.4500097723712 | -0.250009772371200 |
| 29 | 8.1 | 7.90684368325063 | 0.193156316749370 |
| 30 | 8.1 | 8.05963687975791 | 0.0403631202420859 |
| 31 | 8 | 8.01502787021278 | -0.0150278702127787 |
| 32 | 7.9 | 7.88584939467785 | 0.0141506053221519 |
| 33 | 7.9 | 7.995757920787 | -0.0957579207869978 |
| 34 | 8 | 7.91520359093558 | 0.0847964090644246 |
| 35 | 8 | 7.96726342550903 | 0.0327365744909750 |
| 36 | 7.9 | 7.88134657048405 | 0.0186534295159510 |
| 37 | 8 | 7.6420627315318 | 0.357937268468203 |
| 38 | 7.7 | 7.93883573331614 | -0.238835733316135 |
| 39 | 7.2 | 7.29155299862755 | -0.0915529986275479 |
| 40 | 7.5 | 7.59161086100214 | -0.0916108610021422 |
| 41 | 7.3 | 7.43308238135689 | -0.133082381356889 |
| 42 | 7 | 7.20227621557022 | -0.20227621557022 |
| 43 | 7 | 6.82362062851176 | 0.176379371488243 |
| 44 | 7 | 7.20842303920873 | -0.208423039208729 |
| 45 | 7.2 | 7.22940265813996 | -0.0294026581399568 |
| 46 | 7.3 | 7.37613634324985 | -0.076136343249849 |
| 47 | 7.1 | 7.21227796750187 | -0.112277967501866 |
| 48 | 6.8 | 6.8744590005526 | -0.0744590005526006 |
| 49 | 6.4 | 6.55642291680575 | -0.156422916805749 |
| 50 | 6.1 | 6.18274878995036 | -0.0827487899503555 |
| 51 | 6.5 | 6.09664575266122 | 0.403354247338784 |
| 52 | 7.7 | 7.70133649146208 | -0.00133649146207714 |
| 53 | 7.9 | 7.89719311339251 | 0.00280688660748551 |
| 54 | 7.5 | 7.56209014213777 | -0.0620901421377743 |
| 55 | 6.9 | 6.88225713762474 | 0.0177428623752568 |
| 56 | 6.6 | 6.55515980292195 | 0.0448401970780459 |
| 57 | 6.9 | 6.8032725417393 | 0.0967274582606998 |
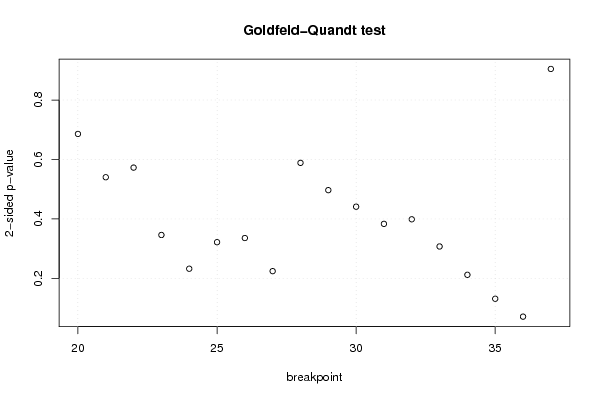
| Goldfeld-Quandt test for Heteroskedasticity | |||
| p-values | Alternative Hypothesis | ||
| breakpoint index | greater | 2-sided | less |
| 20 | 0.342919717452619 | 0.685839434905237 | 0.657080282547381 |
| 21 | 0.270129871525752 | 0.540259743051503 | 0.729870128474248 |
| 22 | 0.286293039842689 | 0.572586079685378 | 0.713706960157311 |
| 23 | 0.172987630463052 | 0.345975260926103 | 0.827012369536948 |
| 24 | 0.116214566225158 | 0.232429132450316 | 0.883785433774842 |
| 25 | 0.160877619289340 | 0.321755238578680 | 0.83912238071066 |
| 26 | 0.167867244196156 | 0.335734488392312 | 0.832132755803844 |
| 27 | 0.112175922931004 | 0.224351845862009 | 0.887824077068996 |
| 28 | 0.29431503898179 | 0.58863007796358 | 0.70568496101821 |
| 29 | 0.248404616396994 | 0.496809232793988 | 0.751595383603006 |
| 30 | 0.220583175358396 | 0.441166350716791 | 0.779416824641604 |
| 31 | 0.191674397310547 | 0.383348794621093 | 0.808325602689453 |
| 32 | 0.199386119370595 | 0.398772238741191 | 0.800613880629405 |
| 33 | 0.153661696585300 | 0.307323393170599 | 0.8463383034147 |
| 34 | 0.105993994487929 | 0.211987988975858 | 0.894006005512071 |
| 35 | 0.0657320343753633 | 0.131464068750727 | 0.934267965624637 |
| 36 | 0.0356153809228538 | 0.0712307618457076 | 0.964384619077146 |
| 37 | 0.452262446030776 | 0.904524892061553 | 0.547737553969224 |
| Meta Analysis of Goldfeld-Quandt test for Heteroskedasticity | |||
| Description | # significant tests | % significant tests | OK/NOK |
| 1% type I error level | 0 | 0 | OK |
| 5% type I error level | 0 | 0 | OK |
| 10% type I error level | 1 | 0.0555555555555556 | OK |