| Multiple Linear Regression - Estimated Regression Equation |
| S.[t] = + 17.8743967092323 + 0.28362403777993E.S[t] -1.28301434053189M1[t] -5.00054413482562M2[t] -0.949437394542677M3[t] -1.00592757515550M4[t] -0.554820834872551M5[t] -1.56043890214559M6[t] -4.24968100719855M7[t] -1.74770215357581M8[t] -0.153320220848849M9[t] -0.675314250341956M10[t] -1.44818039317485M11[t] -0.25110674028295t + e[t] |
| Multiple Linear Regression - Ordinary Least Squares | |||||
| Variable | Parameter | S.D. | T-STAT H0: parameter = 0 | 2-tail p-value | 1-tail p-value |
| (Intercept) | 17.8743967092323 | 1.836813 | 9.7312 | 0 | 0 |
| E.S | 0.28362403777993 | 0.036843 | 7.6983 | 0 | 0 |
| M1 | -1.28301434053189 | 1.536526 | -0.835 | 0.407937 | 0.203968 |
| M2 | -5.00054413482562 | 1.614555 | -3.0972 | 0.003292 | 0.001646 |
| M3 | -0.949437394542677 | 1.612181 | -0.5889 | 0.558738 | 0.279369 |
| M4 | -1.00592757515550 | 1.606739 | -0.6261 | 0.534299 | 0.26715 |
| M5 | -0.554820834872551 | 1.60516 | -0.3456 | 0.731149 | 0.365575 |
| M6 | -1.56043890214559 | 1.603934 | -0.9729 | 0.335592 | 0.167796 |
| M7 | -4.24968100719855 | 1.604423 | -2.6487 | 0.010967 | 0.005484 |
| M8 | -1.74770215357581 | 1.601678 | -1.0912 | 0.280761 | 0.14038 |
| M9 | -0.153320220848849 | 1.600764 | -0.0958 | 0.924103 | 0.462052 |
| M10 | -0.675314250341956 | 1.60063 | -0.4219 | 0.675018 | 0.337509 |
| M11 | -1.44818039317485 | 1.600518 | -0.9048 | 0.370176 | 0.185088 |
| t | -0.25110674028295 | 0.019249 | -13.0454 | 0 | 0 |
| Multiple Linear Regression - Regression Statistics | |
| Multiple R | 0.932411502373107 |
| R-squared | 0.869391209757674 |
| Adjusted R-squared | 0.833265374158733 |
| F-TEST (value) | 24.0656360010440 |
| F-TEST (DF numerator) | 13 |
| F-TEST (DF denominator) | 47 |
| p-value | 2.22044604925031e-16 |
| Multiple Linear Regression - Residual Statistics | |
| Residual Standard Deviation | 2.52938346360975 |
| Sum Squared Residuals | 300.695693181175 |
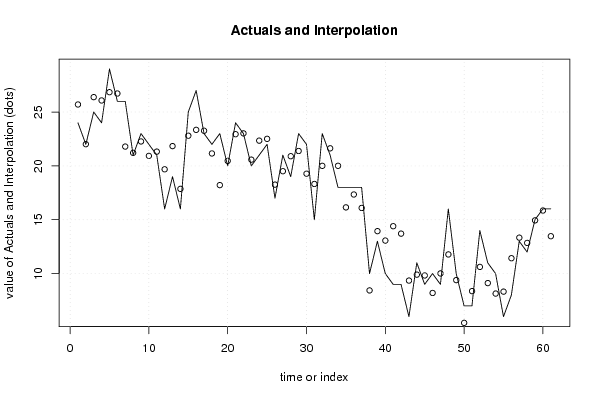
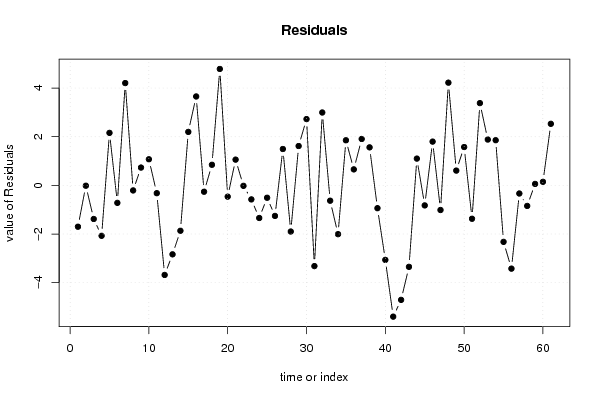
| Multiple Linear Regression - Actuals, Interpolation, and Residuals | |||
| Time or Index | Actuals | Interpolation Forecast | Residuals Prediction Error |
| 1 | 24 | 25.6998688751552 | -1.69986887515521 |
| 2 | 22 | 22.0148563783584 | -0.0148563783583963 |
| 3 | 25 | 26.3821044539183 | -1.38210445391827 |
| 4 | 24 | 26.0745075330225 | -2.07450753302250 |
| 5 | 29 | 26.8417556085823 | 2.15824439141765 |
| 6 | 26 | 26.7195269521461 | -0.719526952146089 |
| 7 | 26 | 21.7938098423507 | 4.20619015764934 |
| 8 | 21 | 21.2084415778911 | -0.208441577891149 |
| 9 | 23 | 22.2680927325552 | 0.731907267444769 |
| 10 | 22 | 20.9277438872193 | 1.07225611278068 |
| 11 | 21 | 21.3218911930031 | -0.321891193003126 |
| 12 | 16 | 19.6827244680957 | -3.68272446809572 |
| 13 | 19 | 21.8357158784200 | -2.83571587841997 |
| 14 | 16 | 17.8670793438433 | -1.86707934384330 |
| 15 | 25 | 22.801575494963 | 2.19842450503699 |
| 16 | 27 | 23.344850687407 | 3.65514931259298 |
| 17 | 23 | 23.2612266496271 | -0.261226649627091 |
| 18 | 22 | 21.1536297287313 | 0.846370271268685 |
| 19 | 23 | 18.2132808833954 | 4.7867191166046 |
| 20 | 20 | 20.4641529967352 | -0.464152996735191 |
| 21 | 24 | 22.9419243402989 | 1.05807565970108 |
| 22 | 23 | 23.0196956838627 | -0.0196956838626574 |
| 23 | 20 | 20.5776026118472 | -0.577602611847163 |
| 24 | 21 | 22.3419243402989 | -1.34192434029892 |
| 25 | 22 | 22.5095474861637 | -0.509547486163658 |
| 26 | 17 | 18.2572869138071 | -1.25728691380705 |
| 27 | 21 | 19.5046705737877 | 1.49532942621232 |
| 28 | 19 | 20.8988178795715 | -1.89881787957148 |
| 29 | 23 | 21.3824419173514 | 1.61755808264859 |
| 30 | 22 | 19.2748449964556 | 2.72515500354436 |
| 31 | 15 | 18.3198644155792 | -3.31986441557923 |
| 32 | 23 | 20.0034884533592 | 2.99651154664084 |
| 33 | 21 | 21.6303876835831 | -0.630387683583105 |
| 34 | 18 | 20.0064148004673 | -2.00641480046726 |
| 35 | 18 | 16.1462015395521 | 1.85379846044789 |
| 36 | 18 | 17.343275192444 | 0.656724807555986 |
| 37 | 18 | 16.0927781494091 | 1.90722185059090 |
| 38 | 10 | 8.43702912369333 | 1.56297087630667 |
| 39 | 13 | 13.9387733503729 | -0.938773350372907 |
| 40 | 10 | 13.0639283539173 | -3.06392835391727 |
| 41 | 9 | 14.398424505037 | -5.39842450503699 |
| 42 | 9 | 13.7089477730409 | -4.70894777304087 |
| 43 | 6 | 9.3504787388053 | -3.3504787388053 |
| 44 | 11 | 9.89960662546551 | 1.10039337453449 |
| 45 | 9 | 9.82476162900988 | -0.824761629009875 |
| 46 | 10 | 8.20078874589403 | 1.79921125410597 |
| 47 | 9 | 10.0130562405775 | -1.01305624057748 |
| 48 | 16 | 11.7773779690292 | 4.22262203097076 |
| 49 | 10 | 9.3923847748746 | 0.607615225125391 |
| 50 | 7 | 5.42374824029793 | 1.57625175970207 |
| 51 | 7 | 8.37287612695814 | -1.37287612695814 |
| 52 | 14 | 10.6178955460817 | 3.38210445391827 |
| 53 | 11 | 9.11615131940215 | 1.88384868059785 |
| 54 | 10 | 8.1430505496261 | 1.85694945037390 |
| 55 | 6 | 8.32256611986941 | -2.32256611986941 |
| 56 | 8 | 11.4243103465490 | -3.42431034654899 |
| 57 | 13 | 13.3348336145529 | -0.334833614552865 |
| 58 | 12 | 12.8453568825567 | -0.845356882556735 |
| 59 | 15 | 14.9412484150201 | 0.0587515849798848 |
| 60 | 16 | 15.8546980301321 | 0.145301969867906 |
| 61 | 16 | 13.4697048359775 | 2.53029516402254 |
| Goldfeld-Quandt test for Heteroskedasticity | |||
| p-values | Alternative Hypothesis | ||
| breakpoint index | greater | 2-sided | less |
| 17 | 0.286903576026991 | 0.573807152053982 | 0.713096423973009 |
| 18 | 0.503946114457648 | 0.992107771084704 | 0.496053885542352 |
| 19 | 0.481022028168762 | 0.962044056337524 | 0.518977971831238 |
| 20 | 0.407119981781704 | 0.814239963563409 | 0.592880018218296 |
| 21 | 0.29738267450978 | 0.59476534901956 | 0.70261732549022 |
| 22 | 0.211446468865883 | 0.422892937731767 | 0.788553531134117 |
| 23 | 0.135191231941780 | 0.270382463883561 | 0.86480876805822 |
| 24 | 0.113535555728901 | 0.227071111457801 | 0.8864644442711 |
| 25 | 0.0748331285526746 | 0.149666257105349 | 0.925166871447325 |
| 26 | 0.0535676066650276 | 0.107135213330055 | 0.946432393334972 |
| 27 | 0.0338629269635512 | 0.0677258539271023 | 0.96613707303645 |
| 28 | 0.0447431544289080 | 0.0894863088578161 | 0.955256845571092 |
| 29 | 0.0329532666490065 | 0.065906533298013 | 0.967046733350994 |
| 30 | 0.0426618963298799 | 0.0853237926597598 | 0.95733810367012 |
| 31 | 0.265821046595439 | 0.531642093190877 | 0.734178953404561 |
| 32 | 0.418951292056361 | 0.837902584112722 | 0.581048707943639 |
| 33 | 0.389341857138154 | 0.778683714276309 | 0.610658142861846 |
| 34 | 0.330675589541358 | 0.661351179082716 | 0.669324410458642 |
| 35 | 0.374631726757619 | 0.749263453515238 | 0.625368273242381 |
| 36 | 0.319671087180859 | 0.639342174361718 | 0.680328912819141 |
| 37 | 0.357930355464067 | 0.715860710928133 | 0.642069644535933 |
| 38 | 0.310593790623056 | 0.621187581246111 | 0.689406209376944 |
| 39 | 0.536143295009435 | 0.92771340998113 | 0.463856704990565 |
| 40 | 0.54729007875488 | 0.90541984249024 | 0.45270992124512 |
| 41 | 0.594615516954635 | 0.81076896609073 | 0.405384483045365 |
| 42 | 0.651191348414926 | 0.697617303170148 | 0.348808651585074 |
| 43 | 0.701200338895713 | 0.597599322208574 | 0.298799661104287 |
| 44 | 0.57559147041526 | 0.848817059169479 | 0.424408529584739 |
| Meta Analysis of Goldfeld-Quandt test for Heteroskedasticity | |||
| Description | # significant tests | % significant tests | OK/NOK |
| 1% type I error level | 0 | 0 | OK |
| 5% type I error level | 0 | 0 | OK |
| 10% type I error level | 4 | 0.142857142857143 | NOK |