| Multiple Linear Regression - Estimated Regression Equation |
| S.[t] = + 14.3407345050678 + 0.234013754567813E.S[t] + 0.182528854816488`Y(t-1)`[t] + 0.221610208613917`Y(t-2)`[t] -0.0975425120261347`Y(t-3)`[t] -0.103045667145648`Y(T-4)`[t] -1.6722068286102M1[t] -2.94233377172629M2[t] -4.99006069053998M3[t] -1.85789829104282M4[t] -0.0722188170639816M5[t] -1.61978987381349M6[t] -2.58542682860624M7[t] -0.674084410588761M8[t] -1.53170254156695M9[t] -5.87072081026486M10[t] -0.623269007966605M11[t] -0.208277960241533t + e[t] |
| Multiple Linear Regression - Ordinary Least Squares | |||||
| Variable | Parameter | S.D. | T-STAT H0: parameter = 0 | 2-tail p-value | 1-tail p-value |
| (Intercept) | 14.3407345050678 | 4.084762 | 3.5108 | 0.001145 | 0.000572 |
| E.S | 0.234013754567813 | 0.048161 | 4.859 | 2e-05 | 1e-05 |
| `Y(t-1)` | 0.182528854816488 | 0.138719 | 1.3158 | 0.195917 | 0.097958 |
| `Y(t-2)` | 0.221610208613917 | 0.14096 | 1.5721 | 0.123995 | 0.061997 |
| `Y(t-3)` | -0.0975425120261347 | 0.141112 | -0.6912 | 0.493507 | 0.246753 |
| `Y(T-4)` | -0.103045667145648 | 0.134927 | -0.7637 | 0.449634 | 0.224817 |
| M1 | -1.6722068286102 | 1.938508 | -0.8626 | 0.393617 | 0.196809 |
| M2 | -2.94233377172629 | 1.976043 | -1.489 | 0.144529 | 0.072265 |
| M3 | -4.99006069053998 | 1.857959 | -2.6858 | 0.010574 | 0.005287 |
| M4 | -1.85789829104282 | 1.85734 | -1.0003 | 0.323331 | 0.161666 |
| M5 | -0.0722188170639816 | 1.723861 | -0.0419 | 0.966797 | 0.483399 |
| M6 | -1.61978987381349 | 1.835893 | -0.8823 | 0.383026 | 0.191513 |
| M7 | -2.58542682860624 | 1.92103 | -1.3459 | 0.186122 | 0.093061 |
| M8 | -0.674084410588761 | 1.832372 | -0.3679 | 0.714955 | 0.357478 |
| M9 | -1.53170254156695 | 1.792892 | -0.8543 | 0.398145 | 0.199073 |
| M10 | -5.87072081026486 | 1.929636 | -3.0424 | 0.004185 | 0.002093 |
| M11 | -0.623269007966605 | 2.051635 | -0.3038 | 0.762902 | 0.381451 |
| t | -0.208277960241533 | 0.056308 | -3.6989 | 0.000666 | 0.000333 |
| Multiple Linear Regression - Regression Statistics | |
| Multiple R | 0.939675191863558 |
| R-squared | 0.882989466203815 |
| Adjusted R-squared | 0.831984874549068 |
| F-TEST (value) | 17.3119603070409 |
| F-TEST (DF numerator) | 17 |
| F-TEST (DF denominator) | 39 |
| p-value | 4.01234601099532e-13 |
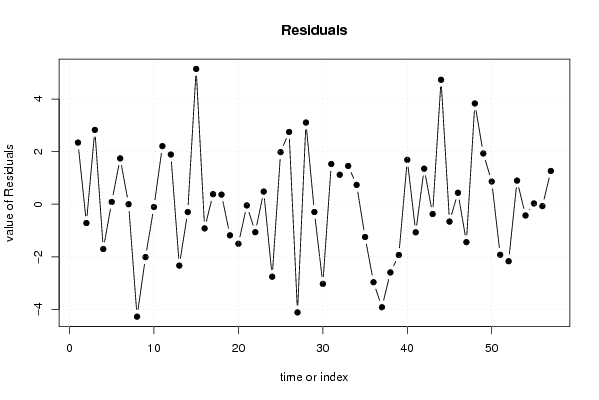
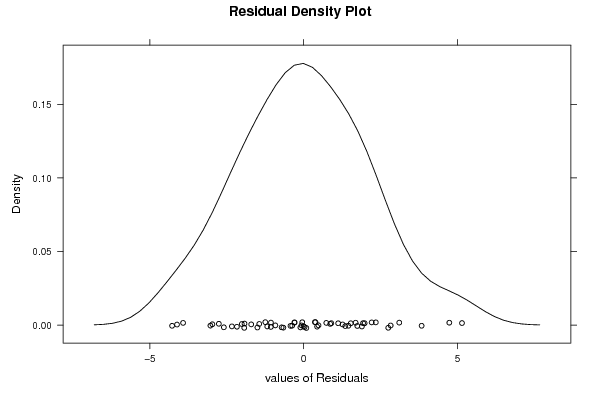
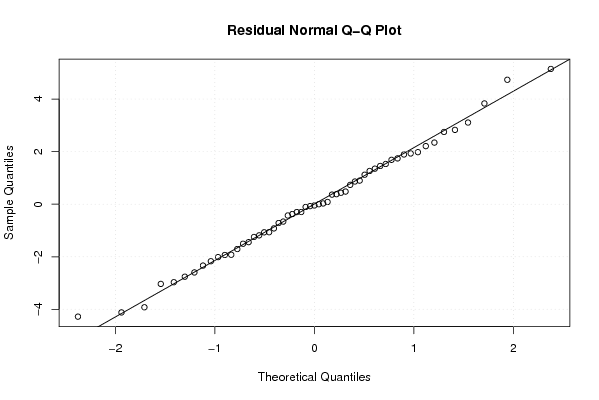
| Multiple Linear Regression - Residual Statistics | |
| Residual Standard Deviation | 2.52097381474045 |
| Sum Squared Residuals | 247.857050009673 |
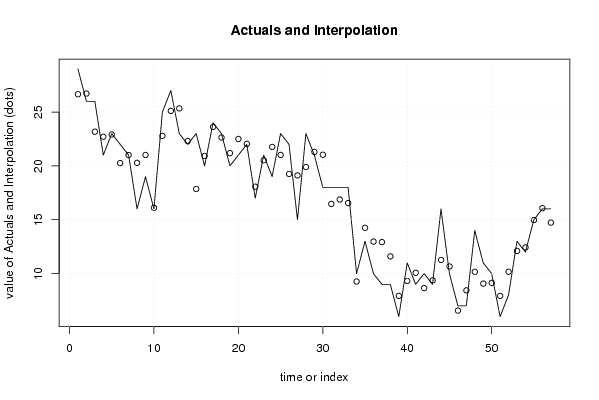
| Multiple Linear Regression - Actuals, Interpolation, and Residuals | |||
| Time or Index | Actuals | Interpolation Forecast | Residuals Prediction Error |
| 1 | 29 | 26.6546888446661 | 2.34531115533393 |
| 2 | 26 | 26.7168368232611 | -0.716836823261103 |
| 3 | 26 | 23.1716056514405 | 2.8283943485595 |
| 4 | 21 | 22.7058550261912 | -1.70585502619122 |
| 5 | 23 | 22.9139977116284 | 0.0860022883715736 |
| 6 | 22 | 20.2562648535021 | 1.74373514649791 |
| 7 | 21 | 21.0008228338489 | -0.000822833848893367 |
| 8 | 16 | 20.2797539941923 | -4.27975399419228 |
| 9 | 19 | 21.0132334073926 | -2.01323340739260 |
| 10 | 16 | 16.1060608790048 | -0.106060879004820 |
| 11 | 25 | 22.7892920280014 | 2.21070797199860 |
| 12 | 27 | 25.1068542065864 | 1.89314579341360 |
| 13 | 23 | 25.3353957849665 | -2.33539578496654 |
| 14 | 22 | 22.2993090090691 | -0.299309009069098 |
| 15 | 23 | 17.8518384123786 | 5.1481615876214 |
| 16 | 20 | 20.9207202116500 | -0.920720211650043 |
| 17 | 24 | 23.6179255684318 | 0.382074431568217 |
| 18 | 23 | 22.6349057636879 | 0.365094236312106 |
| 19 | 20 | 21.1844159243865 | -1.18441592438648 |
| 20 | 21 | 22.5052780715671 | -1.50527807156708 |
| 21 | 22 | 22.0465225801725 | -0.0465225801725065 |
| 22 | 17 | 18.0650248633197 | -1.06502486331971 |
| 23 | 21 | 20.5186353382084 | 0.481364661791596 |
| 24 | 19 | 21.7591851103649 | -2.75918511036494 |
| 25 | 23 | 21.0187640938887 | 1.98123590611126 |
| 26 | 22 | 19.2502712164895 | 2.7497287835105 |
| 27 | 15 | 19.1191769545178 | -4.11917695451782 |
| 28 | 23 | 19.8916429784952 | 3.10835702150476 |
| 29 | 21 | 21.2973774684784 | -0.297377468478387 |
| 30 | 18 | 21.0331543983909 | -3.03315439839085 |
| 31 | 18 | 16.4692745298116 | 1.53072547018839 |
| 32 | 18 | 16.8782280486329 | 1.12177195136712 |
| 33 | 18 | 16.5450645823507 | 1.45493541764933 |
| 34 | 10 | 9.2647265454666 | 0.735273454533395 |
| 35 | 13 | 14.2477520763983 | -1.24775207639830 |
| 36 | 10 | 12.9694205105259 | -2.96942051052588 |
| 37 | 9 | 12.9225748975468 | -3.92257489754676 |
| 38 | 9 | 11.5965758237533 | -2.59657582375331 |
| 39 | 6 | 7.93238249788656 | -1.93238249788656 |
| 40 | 11 | 9.31127735874892 | 1.68872264125108 |
| 41 | 9 | 10.0694694150335 | -1.06946941503350 |
| 42 | 10 | 8.64720000385403 | 1.35279999614597 |
| 43 | 9 | 9.37415551339281 | -0.374155513392805 |
| 44 | 16 | 11.2641855224258 | 4.73581447757417 |
| 45 | 10 | 10.6608887648693 | -0.660888764869333 |
| 46 | 7 | 6.56418771220886 | 0.435812287791136 |
| 47 | 7 | 8.44432055739189 | -1.44432055739189 |
| 48 | 14 | 10.1645401725228 | 3.83545982747721 |
| 49 | 11 | 9.0685763789319 | 1.9314236210681 |
| 50 | 10 | 9.13700712742699 | 0.862992872573009 |
| 51 | 6 | 7.92499648377652 | -1.92499648377652 |
| 52 | 8 | 10.1705044249146 | -2.17050442491458 |
| 53 | 13 | 12.1012298364279 | 0.898770163572101 |
| 54 | 12 | 12.4284749805651 | -0.428474980565132 |
| 55 | 15 | 14.9713311985602 | 0.0286688014397883 |
| 56 | 16 | 16.0725543631819 | -0.0725543631819249 |
| 57 | 16 | 14.7342906652149 | 1.26570933478511 |
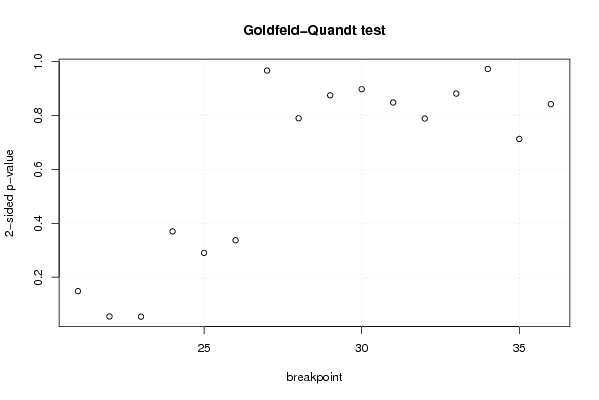
| Goldfeld-Quandt test for Heteroskedasticity | |||
| p-values | Alternative Hypothesis | ||
| breakpoint index | greater | 2-sided | less |
| 21 | 0.0742261920587546 | 0.148452384117509 | 0.925773807941245 |
| 22 | 0.0272668689267298 | 0.0545337378534596 | 0.97273313107327 |
| 23 | 0.0268987234728617 | 0.0537974469457234 | 0.973101276527138 |
| 24 | 0.184956505898214 | 0.369913011796427 | 0.815043494101786 |
| 25 | 0.145064645525647 | 0.290129291051294 | 0.854935354474353 |
| 26 | 0.168535343666131 | 0.337070687332262 | 0.831464656333869 |
| 27 | 0.516838813978542 | 0.966322372042917 | 0.483161186021458 |
| 28 | 0.605295142352772 | 0.789409715294456 | 0.394704857647228 |
| 29 | 0.562810772645609 | 0.874378454708782 | 0.437189227354391 |
| 30 | 0.448590488894184 | 0.897180977788368 | 0.551409511105816 |
| 31 | 0.423952920152533 | 0.847905840305066 | 0.576047079847467 |
| 32 | 0.394213032658269 | 0.788426065316537 | 0.605786967341731 |
| 33 | 0.440422290002927 | 0.880844580005854 | 0.559577709997073 |
| 34 | 0.513897776409635 | 0.97220444718073 | 0.486102223590365 |
| 35 | 0.643630862922817 | 0.712738274154367 | 0.356369137077183 |
| 36 | 0.579234922610978 | 0.841530154778044 | 0.420765077389022 |
| Meta Analysis of Goldfeld-Quandt test for Heteroskedasticity | |||
| Description | # significant tests | % significant tests | OK/NOK |
| 1% type I error level | 0 | 0 | OK |
| 5% type I error level | 0 | 0 | OK |
| 10% type I error level | 2 | 0.125 | NOK |