| Multiple Linear Regression - Estimated Regression Equation |
| Y[t] = + 661.39268292683 + 75.0182926829268X[t] + 7.60121951219552M1[t] -8.06544715447153M2[t] + 98.4345528455284M3[t] -9.06544715447148M4[t] -2.89878048780486M5[t] + 134.101219512195M6[t] -253.735162601626M7[t] -342.568495934959M8[t] + 146.098170731707M9[t] + 76.4315040650406M10[t] -29.2M11[t] + e[t] |
| Multiple Linear Regression - Ordinary Least Squares | |||||
| Variable | Parameter | S.D. | T-STAT H0: parameter = 0 | 2-tail p-value | 1-tail p-value |
| (Intercept) | 661.39268292683 | 28.884941 | 22.8975 | 0 | 0 |
| X | 75.0182926829268 | 15.573716 | 4.817 | 1.1e-05 | 6e-06 |
| M1 | 7.60121951219552 | 38.204132 | 0.199 | 0.842999 | 0.4215 |
| M2 | -8.06544715447153 | 38.204132 | -0.2111 | 0.833551 | 0.416775 |
| M3 | 98.4345528455284 | 38.204132 | 2.5765 | 0.012594 | 0.006297 |
| M4 | -9.06544715447148 | 38.204132 | -0.2373 | 0.813283 | 0.406641 |
| M5 | -2.89878048780486 | 38.204132 | -0.0759 | 0.939783 | 0.469892 |
| M6 | 134.101219512195 | 38.204132 | 3.5101 | 0.000883 | 0.000441 |
| M7 | -253.735162601626 | 38.221763 | -6.6385 | 0 | 0 |
| M8 | -342.568495934959 | 38.221763 | -8.9627 | 0 | 0 |
| M9 | 146.098170731707 | 38.221763 | 3.8224 | 0.000329 | 0.000165 |
| M10 | 76.4315040650406 | 38.221763 | 1.9997 | 0.050308 | 0.025154 |
| M11 | -29.2 | 39.888177 | -0.732 | 0.46714 | 0.23357 |
| Multiple Linear Regression - Regression Statistics | |
| Multiple R | 0.930216186377923 |
| R-squared | 0.865302153399486 |
| Adjusted R-squared | 0.836944712009904 |
| F-TEST (value) | 30.5141123810057 |
| F-TEST (DF numerator) | 12 |
| F-TEST (DF denominator) | 57 |
| p-value | 0 |
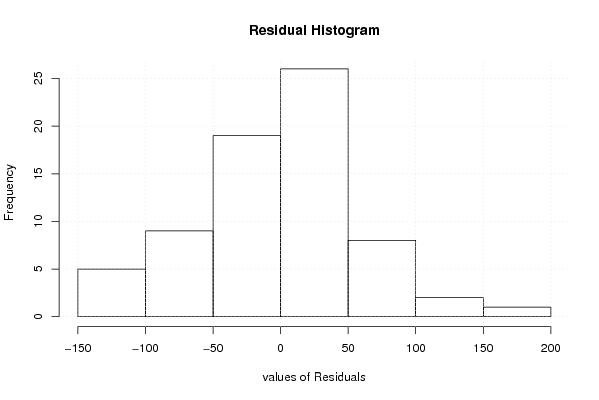
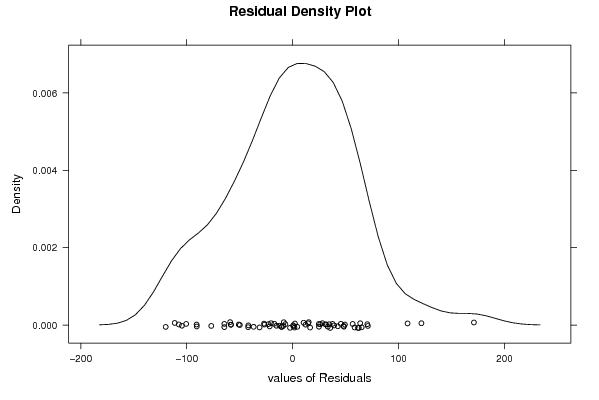
| Multiple Linear Regression - Residual Statistics | |
| Residual Standard Deviation | 63.0687447979535 |
| Sum Squared Residuals | 226726.994512195 |
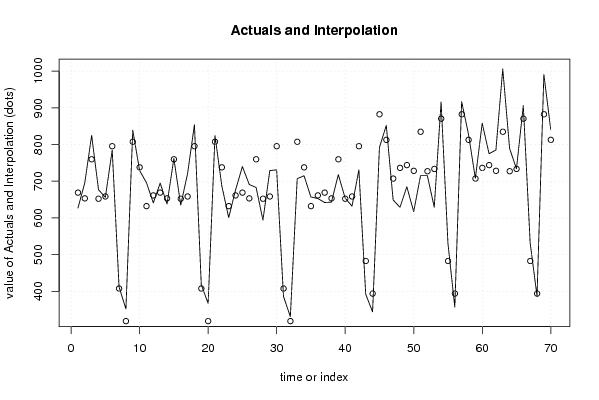
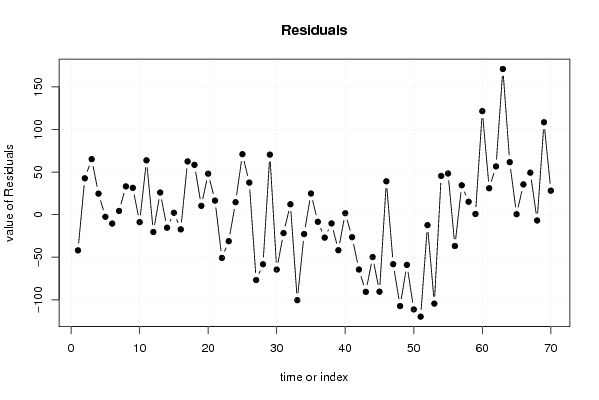
| Multiple Linear Regression - Actuals, Interpolation, and Residuals | |||
| Time or Index | Actuals | Interpolation Forecast | Residuals Prediction Error |
| 1 | 627 | 668.993902439022 | -41.9939024390224 |
| 2 | 696 | 653.327235772358 | 42.6727642276422 |
| 3 | 825 | 759.827235772358 | 65.1727642276424 |
| 4 | 677 | 652.327235772358 | 24.6727642276422 |
| 5 | 656 | 658.493902439024 | -2.49390243902429 |
| 6 | 785 | 795.493902439025 | -10.4939024390246 |
| 7 | 412 | 407.657520325203 | 4.34247967479673 |
| 8 | 352 | 318.82418699187 | 33.1758130081301 |
| 9 | 839 | 807.490853658536 | 31.5091463414637 |
| 10 | 729 | 737.82418699187 | -8.82418699187037 |
| 11 | 696 | 632.192682926829 | 63.8073170731707 |
| 12 | 641 | 661.392682926829 | -20.3926829268292 |
| 13 | 695 | 668.993902439025 | 26.0060975609752 |
| 14 | 638 | 653.327235772358 | -15.3272357723577 |
| 15 | 762 | 759.827235772358 | 2.17276422764226 |
| 16 | 635 | 652.327235772358 | -17.3272357723577 |
| 17 | 721 | 658.493902439024 | 62.5060975609756 |
| 18 | 854 | 795.493902439024 | 58.5060975609756 |
| 19 | 418 | 407.657520325203 | 10.3424796747967 |
| 20 | 367 | 318.82418699187 | 48.1758130081300 |
| 21 | 824 | 807.490853658537 | 16.5091463414633 |
| 22 | 687 | 737.82418699187 | -50.8241869918699 |
| 23 | 601 | 632.192682926829 | -31.1926829268293 |
| 24 | 676 | 661.392682926829 | 14.6073170731707 |
| 25 | 740 | 668.993902439025 | 71.0060975609752 |
| 26 | 691 | 653.327235772358 | 37.6727642276423 |
| 27 | 683 | 759.827235772358 | -76.8272357723577 |
| 28 | 594 | 652.327235772358 | -58.3272357723577 |
| 29 | 729 | 658.493902439024 | 70.5060975609756 |
| 30 | 731 | 795.493902439024 | -64.4939024390244 |
| 31 | 386 | 407.657520325203 | -21.6575203252033 |
| 32 | 331 | 318.82418699187 | 12.1758130081300 |
| 33 | 707 | 807.490853658537 | -100.490853658537 |
| 34 | 715 | 737.82418699187 | -22.8241869918699 |
| 35 | 657 | 632.192682926829 | 24.8073170731707 |
| 36 | 653 | 661.392682926829 | -8.39268292682928 |
| 37 | 642 | 668.993902439025 | -26.9939024390248 |
| 38 | 643 | 653.327235772358 | -10.3272357723577 |
| 39 | 718 | 759.827235772358 | -41.8272357723578 |
| 40 | 654 | 652.327235772358 | 1.67276422764227 |
| 41 | 632 | 658.493902439024 | -26.4939024390245 |
| 42 | 731 | 795.493902439024 | -64.4939024390244 |
| 43 | 392 | 482.67581300813 | -90.67581300813 |
| 44 | 344 | 393.842479674797 | -49.8424796747967 |
| 45 | 792 | 882.509146341463 | -90.5091463414634 |
| 46 | 852 | 812.842479674797 | 39.1575203252033 |
| 47 | 649 | 707.210975609756 | -58.2109756097561 |
| 48 | 629 | 736.410975609756 | -107.410975609756 |
| 49 | 685 | 744.012195121952 | -59.0121951219516 |
| 50 | 617 | 728.345528455284 | -111.345528455284 |
| 51 | 715 | 834.845528455285 | -119.845528455285 |
| 52 | 715 | 727.345528455284 | -12.3455284552845 |
| 53 | 629 | 733.512195121951 | -104.512195121951 |
| 54 | 916 | 870.512195121951 | 45.4878048780488 |
| 55 | 531 | 482.67581300813 | 48.3241869918699 |
| 56 | 357 | 393.842479674797 | -36.8424796747967 |
| 57 | 917 | 882.509146341464 | 34.4908536585365 |
| 58 | 828 | 812.842479674797 | 15.1575203252034 |
| 59 | 708 | 707.210975609756 | 0.789024390243946 |
| 60 | 858 | 736.410975609756 | 121.589024390244 |
| 61 | 775 | 744.012195121952 | 30.9878048780484 |
| 62 | 785 | 728.345528455284 | 56.6544715447155 |
| 63 | 1006 | 834.845528455285 | 171.154471544715 |
| 64 | 789 | 727.345528455284 | 61.6544715447155 |
| 65 | 734 | 733.512195121951 | 0.487804878048803 |
| 66 | 906 | 870.512195121951 | 35.4878048780488 |
| 67 | 532 | 482.67581300813 | 49.3241869918699 |
| 68 | 387 | 393.842479674797 | -6.84247967479674 |
| 69 | 991 | 882.509146341463 | 108.490853658537 |
| 70 | 841 | 812.842479674797 | 28.1575203252033 |
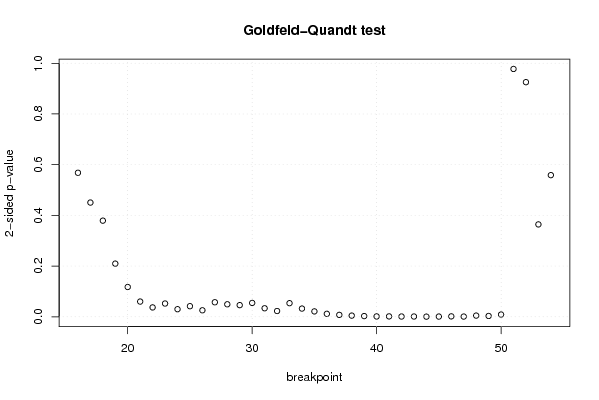
| Goldfeld-Quandt test for Heteroskedasticity | |||
| p-values | Alternative Hypothesis | ||
| breakpoint index | greater | 2-sided | less |
| 16 | 0.283994948779162 | 0.567989897558324 | 0.716005051220838 |
| 17 | 0.225272970620628 | 0.450545941241257 | 0.774727029379372 |
| 18 | 0.189595830558681 | 0.379191661117362 | 0.810404169441319 |
| 19 | 0.104801763121337 | 0.209603526242674 | 0.895198236878663 |
| 20 | 0.0587301108500135 | 0.117460221700027 | 0.941269889149986 |
| 21 | 0.0299888351723092 | 0.0599776703446183 | 0.97001116482769 |
| 22 | 0.0184325135810061 | 0.0368650271620122 | 0.981567486418994 |
| 23 | 0.0261332836250375 | 0.052266567250075 | 0.973866716374962 |
| 24 | 0.0149217914654033 | 0.0298435829308066 | 0.985078208534597 |
| 25 | 0.0208588884519247 | 0.0417177769038494 | 0.979141111548075 |
| 26 | 0.0127749201709348 | 0.0255498403418695 | 0.987225079829065 |
| 27 | 0.0286287560252879 | 0.0572575120505758 | 0.971371243974712 |
| 28 | 0.0246289237725529 | 0.0492578475451058 | 0.975371076227447 |
| 29 | 0.0229282514103949 | 0.0458565028207898 | 0.977071748589605 |
| 30 | 0.0273216716961565 | 0.054643343392313 | 0.972678328303843 |
| 31 | 0.0167567237978379 | 0.0335134475956759 | 0.983243276202162 |
| 32 | 0.0113592598925707 | 0.0227185197851414 | 0.98864074010743 |
| 33 | 0.0267879254099278 | 0.0535758508198556 | 0.973212074590072 |
| 34 | 0.0161453400743632 | 0.0322906801487264 | 0.983854659925637 |
| 35 | 0.0105986107544418 | 0.0211972215088836 | 0.989401389245558 |
| 36 | 0.0058082255841414 | 0.0116164511682828 | 0.994191774415859 |
| 37 | 0.00372967643800005 | 0.00745935287600011 | 0.996270323562 |
| 38 | 0.00230395755264915 | 0.00460791510529829 | 0.997696042447351 |
| 39 | 0.00136074582422031 | 0.00272149164844063 | 0.99863925417578 |
| 40 | 0.000675784261014619 | 0.00135156852202924 | 0.999324215738985 |
| 41 | 0.000728127876403002 | 0.00145625575280600 | 0.999271872123597 |
| 42 | 0.000475030468647181 | 0.000950060937294363 | 0.999524969531353 |
| 43 | 0.000499514600915729 | 0.000999029201831458 | 0.999500485399084 |
| 44 | 0.000229270405653065 | 0.00045854081130613 | 0.999770729594347 |
| 45 | 0.000388730782884489 | 0.000777461565768979 | 0.999611269217116 |
| 46 | 0.000769685901222576 | 0.00153937180244515 | 0.999230314098777 |
| 47 | 0.000418259657201288 | 0.000836519314402575 | 0.999581740342799 |
| 48 | 0.00232952952782195 | 0.00465905905564389 | 0.997670470472178 |
| 49 | 0.00159435587518208 | 0.00318871175036416 | 0.998405644124818 |
| 50 | 0.00439131111480057 | 0.00878262222960114 | 0.9956086888852 |
| 51 | 0.488826292470925 | 0.97765258494185 | 0.511173707529075 |
| 52 | 0.537228702366755 | 0.92554259526649 | 0.462771297633245 |
| 53 | 0.817798065158885 | 0.364403869682230 | 0.182201934841115 |
| 54 | 0.720668173247186 | 0.558663653505629 | 0.279331826752814 |
| Meta Analysis of Goldfeld-Quandt test for Heteroskedasticity | |||
| Description | # significant tests | % significant tests | OK/NOK |
| 1% type I error level | 14 | 0.358974358974359 | NOK |
| 5% type I error level | 25 | 0.641025641025641 | NOK |
| 10% type I error level | 30 | 0.769230769230769 | NOK |