| Multiple Linear Regression - Estimated Regression Equation |
| Y[t] = + 653.402013422819 + 62.2332214765102X[t] + 8.56897837434788M1[t] -7.4617076808352M2[t] + 98.6742729306487M3[t] -9.1897464578672M4[t] -3.38709917971661M5[t] + 133.248881431767M6[t] -252.820674869500M7[t] -342.018027591349M8[t] + 146.284619686801M9[t] + 76.2539336316181M10[t] -28.835980611484M11[t] + 0.364019388516028t + e[t] |
| Multiple Linear Regression - Ordinary Least Squares | |||||
| Variable | Parameter | S.D. | T-STAT H0: parameter = 0 | 2-tail p-value | 1-tail p-value |
| (Intercept) | 653.402013422819 | 33.056482 | 19.7662 | 0 | 0 |
| X | 62.2332214765102 | 29.648835 | 2.099 | 0.040337 | 0.020168 |
| M1 | 8.56897837434788 | 38.502366 | 0.2226 | 0.82469 | 0.412345 |
| M2 | -7.4617076808352 | 38.473572 | -0.1939 | 0.846922 | 0.423461 |
| M3 | 98.6742729306487 | 38.458109 | 2.5658 | 0.012999 | 0.006499 |
| M4 | -9.1897464578672 | 38.455993 | -0.239 | 0.812003 | 0.406001 |
| M5 | -3.38709917971661 | 38.467225 | -0.0881 | 0.93015 | 0.465075 |
| M6 | 133.248881431767 | 38.491794 | 3.4617 | 0.001035 | 0.000517 |
| M7 | -252.820674869500 | 38.515048 | -6.5642 | 0 | 0 |
| M8 | -342.018027591349 | 38.488216 | -8.8863 | 0 | 0 |
| M9 | 146.284619686801 | 38.474711 | 3.8021 | 0.000356 | 0.000178 |
| M10 | 76.2539336316181 | 38.474549 | 1.9819 | 0.052403 | 0.026201 |
| M11 | -28.835980611484 | 40.15672 | -0.7181 | 0.475689 | 0.237845 |
| t | 0.364019388516028 | 0.716524 | 0.508 | 0.613424 | 0.306712 |
| Multiple Linear Regression - Regression Statistics | |
| Multiple R | 0.930548288163138 |
| R-squared | 0.865920116603346 |
| Adjusted R-squared | 0.834794429386265 |
| F-TEST (value) | 27.8201123902628 |
| F-TEST (DF numerator) | 13 |
| F-TEST (DF denominator) | 56 |
| p-value | 0 |
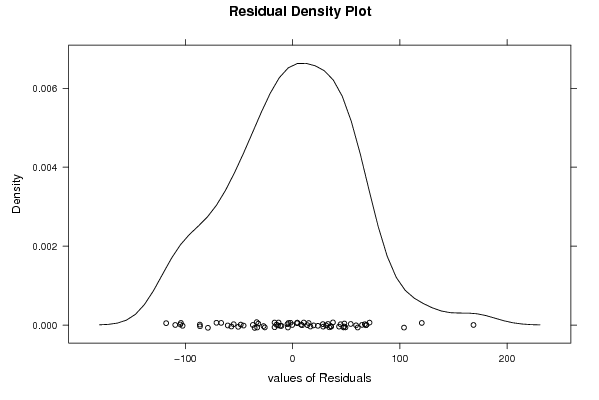
| Multiple Linear Regression - Residual Statistics | |
| Residual Standard Deviation | 63.483240536844 |
| Sum Squared Residuals | 225686.822427293 |
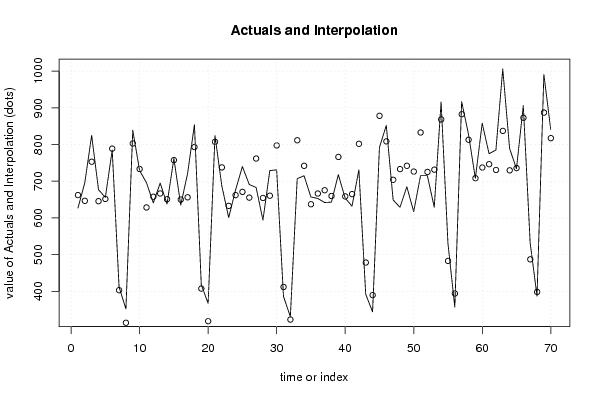
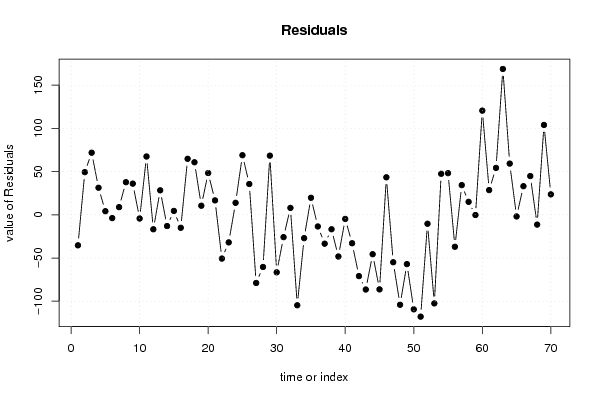
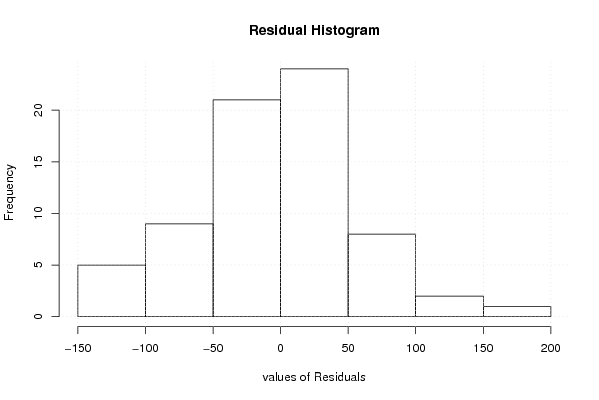
| Multiple Linear Regression - Actuals, Interpolation, and Residuals | |||
| Time or Index | Actuals | Interpolation Forecast | Residuals Prediction Error |
| 1 | 627 | 662.33501118568 | -35.3350111856805 |
| 2 | 696 | 646.668344519016 | 49.3316554809842 |
| 3 | 825 | 753.168344519016 | 71.8316554809844 |
| 4 | 677 | 645.668344519016 | 31.3316554809842 |
| 5 | 656 | 651.835011185682 | 4.16498881431766 |
| 6 | 785 | 788.835011185683 | -3.8350111856826 |
| 7 | 412 | 403.129474272931 | 8.87052572706928 |
| 8 | 352 | 314.296140939597 | 37.7038590604026 |
| 9 | 839 | 802.962807606264 | 36.0371923937363 |
| 10 | 729 | 733.296140939598 | -4.29614093959782 |
| 11 | 696 | 628.570246085011 | 67.4297539149887 |
| 12 | 641 | 657.770246085011 | -16.7702460850112 |
| 13 | 695 | 666.703243847875 | 28.2967561521248 |
| 14 | 638 | 651.036577181208 | -13.0365771812081 |
| 15 | 762 | 757.536577181208 | 4.4634228187919 |
| 16 | 635 | 650.036577181208 | -15.0365771812081 |
| 17 | 721 | 656.203243847875 | 64.7967561521252 |
| 18 | 854 | 793.203243847875 | 60.7967561521252 |
| 19 | 418 | 407.497706935123 | 10.5022930648769 |
| 20 | 367 | 318.66437360179 | 48.3356263982103 |
| 21 | 824 | 807.331040268456 | 16.6689597315435 |
| 22 | 687 | 737.66437360179 | -50.6643736017897 |
| 23 | 601 | 632.938478747204 | -31.9384787472036 |
| 24 | 676 | 662.138478747204 | 13.8615212527964 |
| 25 | 740 | 671.071476510067 | 68.9285234899325 |
| 26 | 691 | 655.4048098434 | 35.5951901565996 |
| 27 | 683 | 761.9048098434 | -78.9048098434004 |
| 28 | 594 | 654.4048098434 | -60.4048098434004 |
| 29 | 729 | 660.571476510067 | 68.4285234899329 |
| 30 | 731 | 797.571476510067 | -66.5714765100671 |
| 31 | 386 | 411.865939597315 | -25.8659395973154 |
| 32 | 331 | 323.032606263982 | 7.96739373601793 |
| 33 | 707 | 811.699272930649 | -104.699272930649 |
| 34 | 715 | 742.032606263982 | -27.0326062639820 |
| 35 | 657 | 637.306711409396 | 19.6932885906041 |
| 36 | 653 | 666.506711409396 | -13.5067114093959 |
| 37 | 642 | 675.43970917226 | -33.4397091722599 |
| 38 | 643 | 659.773042505593 | -16.7730425055927 |
| 39 | 718 | 766.273042505593 | -48.2730425055928 |
| 40 | 654 | 658.773042505593 | -4.77304250559275 |
| 41 | 632 | 664.93970917226 | -32.9397091722595 |
| 42 | 731 | 801.93970917226 | -70.9397091722594 |
| 43 | 392 | 478.467393736018 | -86.467393736018 |
| 44 | 344 | 389.634060402685 | -45.6340604026846 |
| 45 | 792 | 878.300727069351 | -86.3007270693513 |
| 46 | 852 | 808.634060402685 | 43.3659395973154 |
| 47 | 649 | 703.908165548099 | -54.9081655480985 |
| 48 | 629 | 733.108165548098 | -104.108165548098 |
| 49 | 685 | 742.041163310962 | -57.0411633109624 |
| 50 | 617 | 726.374496644295 | -109.374496644295 |
| 51 | 715 | 832.874496644295 | -117.874496644295 |
| 52 | 715 | 725.374496644295 | -10.3744966442953 |
| 53 | 629 | 731.541163310962 | -102.541163310962 |
| 54 | 916 | 868.541163310962 | 47.458836689038 |
| 55 | 531 | 482.83562639821 | 48.1643736017897 |
| 56 | 357 | 394.002293064877 | -37.0022930648770 |
| 57 | 917 | 882.668959731544 | 34.3310402684563 |
| 58 | 828 | 813.002293064877 | 14.9977069351232 |
| 59 | 708 | 708.27639821029 | -0.276398210290772 |
| 60 | 858 | 737.476398210291 | 120.523601789709 |
| 61 | 775 | 746.409395973155 | 28.5906040268453 |
| 62 | 785 | 730.742729306488 | 54.2572706935124 |
| 63 | 1006 | 837.242729306488 | 168.757270693512 |
| 64 | 789 | 729.742729306488 | 59.2572706935124 |
| 65 | 734 | 735.909395973154 | -1.90939597315432 |
| 66 | 906 | 872.909395973154 | 33.0906040268457 |
| 67 | 532 | 487.203859060403 | 44.7961409395974 |
| 68 | 387 | 398.370525727069 | -11.3705257270693 |
| 69 | 991 | 887.037192393736 | 103.962807606264 |
| 70 | 841 | 817.37052572707 | 23.6294742729308 |
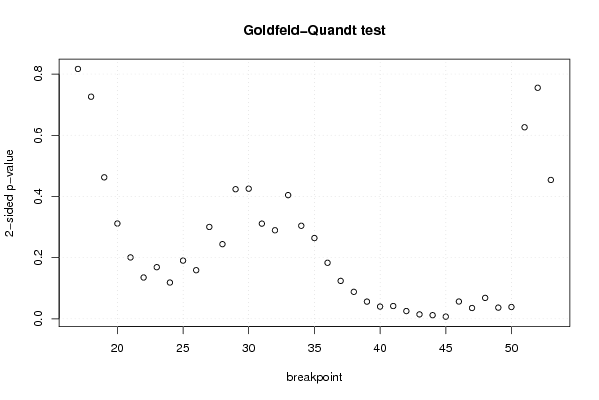
| Goldfeld-Quandt test for Heteroskedasticity | |||
| p-values | Alternative Hypothesis | ||
| breakpoint index | greater | 2-sided | less |
| 17 | 0.408441754453173 | 0.816883508906346 | 0.591558245546827 |
| 18 | 0.363053788636595 | 0.72610757727319 | 0.636946211363405 |
| 19 | 0.231306039955762 | 0.462612079911525 | 0.768693960044238 |
| 20 | 0.155798614843686 | 0.311597229687372 | 0.844201385156314 |
| 21 | 0.100414442665162 | 0.200828885330324 | 0.899585557334838 |
| 22 | 0.0675941802724733 | 0.135188360544947 | 0.932405819727527 |
| 23 | 0.084441195625729 | 0.168882391251458 | 0.915558804374271 |
| 24 | 0.0593682220997772 | 0.118736444199554 | 0.940631777900223 |
| 25 | 0.0952281054219894 | 0.190456210843979 | 0.90477189457801 |
| 26 | 0.0795133255364059 | 0.159026651072812 | 0.920486674463594 |
| 27 | 0.150210816771051 | 0.300421633542101 | 0.84978918322895 |
| 28 | 0.122079874906202 | 0.244159749812405 | 0.877920125093798 |
| 29 | 0.211878623816001 | 0.423757247632001 | 0.788121376183999 |
| 30 | 0.212712585237741 | 0.425425170475481 | 0.78728741476226 |
| 31 | 0.155632147061364 | 0.311264294122728 | 0.844367852938636 |
| 32 | 0.144785211521003 | 0.289570423042005 | 0.855214788478997 |
| 33 | 0.202236548170474 | 0.404473096340948 | 0.797763451829526 |
| 34 | 0.152118915249178 | 0.304237830498355 | 0.847881084750822 |
| 35 | 0.132041395924903 | 0.264082791849806 | 0.867958604075097 |
| 36 | 0.0916316863861793 | 0.183263372772359 | 0.90836831361382 |
| 37 | 0.0620615421197921 | 0.124123084239584 | 0.937938457880208 |
| 38 | 0.0441701858975508 | 0.0883403717951017 | 0.95582981410245 |
| 39 | 0.0281955231063068 | 0.0563910462126135 | 0.971804476893693 |
| 40 | 0.0200634490419236 | 0.0401268980838472 | 0.979936550958076 |
| 41 | 0.0209450871610194 | 0.0418901743220387 | 0.97905491283898 |
| 42 | 0.0127362398834531 | 0.0254724797669062 | 0.987263760116547 |
| 43 | 0.00733921547486367 | 0.0146784309497273 | 0.992660784525136 |
| 44 | 0.00601040256017692 | 0.0120208051203538 | 0.993989597439823 |
| 45 | 0.00360574145717533 | 0.00721148291435067 | 0.996394258542825 |
| 46 | 0.0283325358082796 | 0.0566650716165592 | 0.97166746419172 |
| 47 | 0.0177421628262654 | 0.0354843256525308 | 0.982257837173735 |
| 48 | 0.0342755063991048 | 0.0685510127982096 | 0.965724493600895 |
| 49 | 0.0183395061397966 | 0.0366790122795933 | 0.981660493860203 |
| 50 | 0.0193820344118218 | 0.0387640688236437 | 0.980617965588178 |
| 51 | 0.686882898763557 | 0.626234202472886 | 0.313117101236443 |
| 52 | 0.622328940644581 | 0.755342118710838 | 0.377671059355419 |
| 53 | 0.77298857517378 | 0.454022849652439 | 0.227011424826220 |
| Meta Analysis of Goldfeld-Quandt test for Heteroskedasticity | |||
| Description | # significant tests | % significant tests | OK/NOK |
| 1% type I error level | 1 | 0.0270270270270270 | NOK |
| 5% type I error level | 9 | 0.243243243243243 | NOK |
| 10% type I error level | 13 | 0.351351351351351 | NOK |