Free Statistics

of Irreproducible Research!

Author's title

Author*The author of this computation has been verified*
R Software Modulerwasp_autocorrelation.wasp
Title produced by software(Partial) Autocorrelation Function
Date of computationThu, 10 Dec 2009 08:57:24 -0700
Cite this page as followsStatistical Computations at FreeStatistics.org, Office for Research Development and Education, URL https://freestatistics.org/blog/index.php?v=date/2009/Dec/10/t1260460700ewoj951e64aygpt.htm/, Retrieved Fri, 19 Apr 2024 13:06:35 +0000
Statistical Computations at FreeStatistics.org, Office for Research Development and Education, URL https://freestatistics.org/blog/index.php?pk=65519, Retrieved Fri, 19 Apr 2024 13:06:35 +0000
QR Codes:

Original text written by user:
IsPrivate?No (this computation is public)
User-defined keywords
Estimated Impact107
Family? (F = Feedback message, R = changed R code, M = changed R Module, P = changed Parameters, D = changed Data)
-     [Univariate Data Series] [data set] [2008-12-01 19:54:57] [b98453cac15ba1066b407e146608df68]
- RMP   [Standard Deviation-Mean Plot] [] [2009-11-27 14:40:44] [b98453cac15ba1066b407e146608df68]
- RMPD      [(Partial) Autocorrelation Function] [] [2009-12-10 15:57:24] [66ffaa9e54a90d3ae4874684602d24e9] [Current]
Feedback Forum

Post a new message
Dataseries X:
462
455
461
461
463
462
456
455
456
472
472
471
465
459
465
468
467
463
460
462
461
476
476
471
453
443
442
444
438
427
424
416
406
431
434
418
412
404
409
412
406
398
397
385
390
413
413
401
397
397
409
419
424
428
430
424
433
456
459
446


Summary of computational transaction
Raw Inputview raw input (R code)
Raw Outputview raw output of R engine
Computing time2 seconds
R Server'Gwilym Jenkins' @ 72.249.127.135

\begin{tabular}{lllllllll}
\hline
Summary of computational transaction \tabularnewline
Raw Input & view raw input (R code)  \tabularnewline
Raw Output & view raw output of R engine  \tabularnewline
Computing time & 2 seconds \tabularnewline
R Server & 'Gwilym Jenkins' @ 72.249.127.135 \tabularnewline
\hline
\end{tabular}
%Source: https://freestatistics.org/blog/index.php?pk=65519&T=0

[TABLE]
[ROW][C]Summary of computational transaction[/C][/ROW]
[ROW][C]Raw Input[/C][C]view raw input (R code) [/C][/ROW]
[ROW][C]Raw Output[/C][C]view raw output of R engine [/C][/ROW]
[ROW][C]Computing time[/C][C]2 seconds[/C][/ROW]
[ROW][C]R Server[/C][C]'Gwilym Jenkins' @ 72.249.127.135[/C][/ROW]
[/TABLE]
Source: https://freestatistics.org/blog/index.php?pk=65519&T=0

Globally Unique Identifier (entire table): ba.freestatistics.org/blog/index.php?pk=65519&T=0

As an alternative you can also use a QR Code:  

The GUIDs for individual cells are displayed in the table below:

Summary of computational transaction
Raw Inputview raw input (R code)
Raw Outputview raw output of R engine
Computing time2 seconds
R Server'Gwilym Jenkins' @ 72.249.127.135


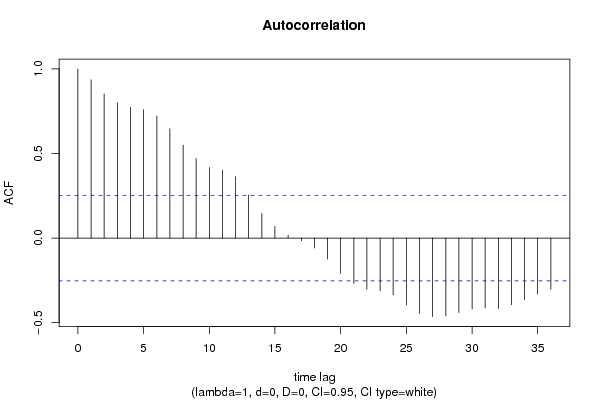
Autocorrelation Function
Time lag kACF(k)T-STATP-value
10.9359777.250
20.8520666.60010
30.7996466.1940
40.7742885.99760
50.7589765.8790
60.7212065.58640
70.6461325.00493e-06
80.5500924.2613.6e-05
90.4701323.64160.000283
100.4173443.23270.000997
110.4015683.11050.001428
120.3631492.81290.003313
130.2547841.97350.026522
140.1458051.12940.131612
150.0679510.52630.300295
160.0173480.13440.446778
17-0.016106-0.12480.450566
18-0.058613-0.4540.325728
19-0.12403-0.96070.170271
20-0.208225-1.61290.056007
21-0.268956-2.08330.020745
22-0.302886-2.34610.011145
23-0.311426-2.41230.009463
24-0.336165-2.60390.0058
25-0.394857-3.05850.001661
26-0.445895-3.45390.00051
27-0.464463-3.59770.000325
28-0.460553-3.56740.000358
29-0.440402-3.41130.000581
30-0.419206-3.24720.000955
31-0.412944-3.19870.001103
32-0.416555-3.22660.001015
33-0.39446-3.05550.001675
34-0.364271-2.82160.003235
35-0.330425-2.55950.006511
36-0.303192-2.34850.011081

\begin{tabular}{lllllllll}
\hline
Autocorrelation Function \tabularnewline
Time lag k & ACF(k) & T-STAT & P-value \tabularnewline
1 & 0.935977 & 7.25 & 0 \tabularnewline
2 & 0.852066 & 6.6001 & 0 \tabularnewline
3 & 0.799646 & 6.194 & 0 \tabularnewline
4 & 0.774288 & 5.9976 & 0 \tabularnewline
5 & 0.758976 & 5.879 & 0 \tabularnewline
6 & 0.721206 & 5.5864 & 0 \tabularnewline
7 & 0.646132 & 5.0049 & 3e-06 \tabularnewline
8 & 0.550092 & 4.261 & 3.6e-05 \tabularnewline
9 & 0.470132 & 3.6416 & 0.000283 \tabularnewline
10 & 0.417344 & 3.2327 & 0.000997 \tabularnewline
11 & 0.401568 & 3.1105 & 0.001428 \tabularnewline
12 & 0.363149 & 2.8129 & 0.003313 \tabularnewline
13 & 0.254784 & 1.9735 & 0.026522 \tabularnewline
14 & 0.145805 & 1.1294 & 0.131612 \tabularnewline
15 & 0.067951 & 0.5263 & 0.300295 \tabularnewline
16 & 0.017348 & 0.1344 & 0.446778 \tabularnewline
17 & -0.016106 & -0.1248 & 0.450566 \tabularnewline
18 & -0.058613 & -0.454 & 0.325728 \tabularnewline
19 & -0.12403 & -0.9607 & 0.170271 \tabularnewline
20 & -0.208225 & -1.6129 & 0.056007 \tabularnewline
21 & -0.268956 & -2.0833 & 0.020745 \tabularnewline
22 & -0.302886 & -2.3461 & 0.011145 \tabularnewline
23 & -0.311426 & -2.4123 & 0.009463 \tabularnewline
24 & -0.336165 & -2.6039 & 0.0058 \tabularnewline
25 & -0.394857 & -3.0585 & 0.001661 \tabularnewline
26 & -0.445895 & -3.4539 & 0.00051 \tabularnewline
27 & -0.464463 & -3.5977 & 0.000325 \tabularnewline
28 & -0.460553 & -3.5674 & 0.000358 \tabularnewline
29 & -0.440402 & -3.4113 & 0.000581 \tabularnewline
30 & -0.419206 & -3.2472 & 0.000955 \tabularnewline
31 & -0.412944 & -3.1987 & 0.001103 \tabularnewline
32 & -0.416555 & -3.2266 & 0.001015 \tabularnewline
33 & -0.39446 & -3.0555 & 0.001675 \tabularnewline
34 & -0.364271 & -2.8216 & 0.003235 \tabularnewline
35 & -0.330425 & -2.5595 & 0.006511 \tabularnewline
36 & -0.303192 & -2.3485 & 0.011081 \tabularnewline
\hline
\end{tabular}
%Source: https://freestatistics.org/blog/index.php?pk=65519&T=1

[TABLE]
[ROW][C]Autocorrelation Function[/C][/ROW]
[ROW][C]Time lag k[/C][C]ACF(k)[/C][C]T-STAT[/C][C]P-value[/C][/ROW]
[ROW][C]1[/C][C]0.935977[/C][C]7.25[/C][C]0[/C][/ROW]
[ROW][C]2[/C][C]0.852066[/C][C]6.6001[/C][C]0[/C][/ROW]
[ROW][C]3[/C][C]0.799646[/C][C]6.194[/C][C]0[/C][/ROW]
[ROW][C]4[/C][C]0.774288[/C][C]5.9976[/C][C]0[/C][/ROW]
[ROW][C]5[/C][C]0.758976[/C][C]5.879[/C][C]0[/C][/ROW]
[ROW][C]6[/C][C]0.721206[/C][C]5.5864[/C][C]0[/C][/ROW]
[ROW][C]7[/C][C]0.646132[/C][C]5.0049[/C][C]3e-06[/C][/ROW]
[ROW][C]8[/C][C]0.550092[/C][C]4.261[/C][C]3.6e-05[/C][/ROW]
[ROW][C]9[/C][C]0.470132[/C][C]3.6416[/C][C]0.000283[/C][/ROW]
[ROW][C]10[/C][C]0.417344[/C][C]3.2327[/C][C]0.000997[/C][/ROW]
[ROW][C]11[/C][C]0.401568[/C][C]3.1105[/C][C]0.001428[/C][/ROW]
[ROW][C]12[/C][C]0.363149[/C][C]2.8129[/C][C]0.003313[/C][/ROW]
[ROW][C]13[/C][C]0.254784[/C][C]1.9735[/C][C]0.026522[/C][/ROW]
[ROW][C]14[/C][C]0.145805[/C][C]1.1294[/C][C]0.131612[/C][/ROW]
[ROW][C]15[/C][C]0.067951[/C][C]0.5263[/C][C]0.300295[/C][/ROW]
[ROW][C]16[/C][C]0.017348[/C][C]0.1344[/C][C]0.446778[/C][/ROW]
[ROW][C]17[/C][C]-0.016106[/C][C]-0.1248[/C][C]0.450566[/C][/ROW]
[ROW][C]18[/C][C]-0.058613[/C][C]-0.454[/C][C]0.325728[/C][/ROW]
[ROW][C]19[/C][C]-0.12403[/C][C]-0.9607[/C][C]0.170271[/C][/ROW]
[ROW][C]20[/C][C]-0.208225[/C][C]-1.6129[/C][C]0.056007[/C][/ROW]
[ROW][C]21[/C][C]-0.268956[/C][C]-2.0833[/C][C]0.020745[/C][/ROW]
[ROW][C]22[/C][C]-0.302886[/C][C]-2.3461[/C][C]0.011145[/C][/ROW]
[ROW][C]23[/C][C]-0.311426[/C][C]-2.4123[/C][C]0.009463[/C][/ROW]
[ROW][C]24[/C][C]-0.336165[/C][C]-2.6039[/C][C]0.0058[/C][/ROW]
[ROW][C]25[/C][C]-0.394857[/C][C]-3.0585[/C][C]0.001661[/C][/ROW]
[ROW][C]26[/C][C]-0.445895[/C][C]-3.4539[/C][C]0.00051[/C][/ROW]
[ROW][C]27[/C][C]-0.464463[/C][C]-3.5977[/C][C]0.000325[/C][/ROW]
[ROW][C]28[/C][C]-0.460553[/C][C]-3.5674[/C][C]0.000358[/C][/ROW]
[ROW][C]29[/C][C]-0.440402[/C][C]-3.4113[/C][C]0.000581[/C][/ROW]
[ROW][C]30[/C][C]-0.419206[/C][C]-3.2472[/C][C]0.000955[/C][/ROW]
[ROW][C]31[/C][C]-0.412944[/C][C]-3.1987[/C][C]0.001103[/C][/ROW]
[ROW][C]32[/C][C]-0.416555[/C][C]-3.2266[/C][C]0.001015[/C][/ROW]
[ROW][C]33[/C][C]-0.39446[/C][C]-3.0555[/C][C]0.001675[/C][/ROW]
[ROW][C]34[/C][C]-0.364271[/C][C]-2.8216[/C][C]0.003235[/C][/ROW]
[ROW][C]35[/C][C]-0.330425[/C][C]-2.5595[/C][C]0.006511[/C][/ROW]
[ROW][C]36[/C][C]-0.303192[/C][C]-2.3485[/C][C]0.011081[/C][/ROW]
[/TABLE]
Source: https://freestatistics.org/blog/index.php?pk=65519&T=1

Globally Unique Identifier (entire table): ba.freestatistics.org/blog/index.php?pk=65519&T=1

As an alternative you can also use a QR Code:  

The GUIDs for individual cells are displayed in the table below:

Autocorrelation Function
Time lag kACF(k)T-STATP-value
10.9359777.250
20.8520666.60010
30.7996466.1940
40.7742885.99760
50.7589765.8790
60.7212065.58640
70.6461325.00493e-06
80.5500924.2613.6e-05
90.4701323.64160.000283
100.4173443.23270.000997
110.4015683.11050.001428
120.3631492.81290.003313
130.2547841.97350.026522
140.1458051.12940.131612
150.0679510.52630.300295
160.0173480.13440.446778
17-0.016106-0.12480.450566
18-0.058613-0.4540.325728
19-0.12403-0.96070.170271
20-0.208225-1.61290.056007
21-0.268956-2.08330.020745
22-0.302886-2.34610.011145
23-0.311426-2.41230.009463
24-0.336165-2.60390.0058
25-0.394857-3.05850.001661
26-0.445895-3.45390.00051
27-0.464463-3.59770.000325
28-0.460553-3.56740.000358
29-0.440402-3.41130.000581
30-0.419206-3.24720.000955
31-0.412944-3.19870.001103
32-0.416555-3.22660.001015
33-0.39446-3.05550.001675
34-0.364271-2.82160.003235
35-0.330425-2.55950.006511
36-0.303192-2.34850.011081


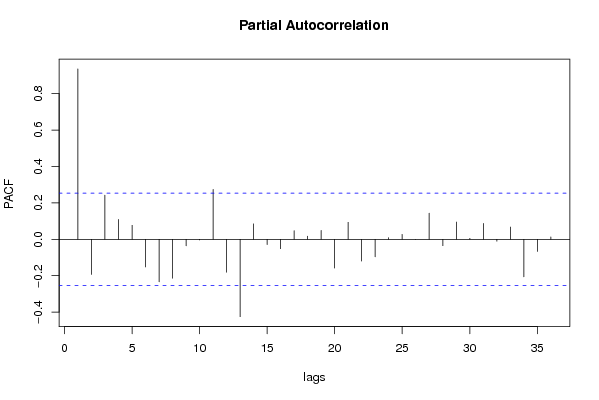
Partial Autocorrelation Function
Time lag kPACF(k)T-STATP-value
10.9359777.250
2-0.193531-1.49910.069548
30.2424761.87820.032607
40.108790.84270.201377
50.0768440.59520.276964
6-0.151818-1.1760.122125
7-0.234042-1.81290.037426
8-0.213774-1.65590.051483
9-0.036167-0.28010.390165
10-0.003349-0.02590.489694
110.2738372.12110.019026
12-0.1811-1.40280.082916
13-0.425171-3.29340.000832
140.0846820.65590.257184
15-0.028948-0.22420.411669
16-0.051981-0.40260.344322
170.04740.36720.357396
180.0172860.13390.446968
190.0484040.37490.354514
20-0.158285-1.22610.112481
210.0931920.72190.236592
22-0.11994-0.9290.178293
23-0.096207-0.74520.229526
240.0088270.06840.472857
250.0269690.20890.417617
26-0.00044-0.00340.498645
270.1435691.11210.13527
28-0.035565-0.27550.391946
290.0947460.73390.232935
300.0053170.04120.483643
310.0870670.67440.251317
32-0.01072-0.0830.46705
330.0671410.52010.302463
34-0.206214-1.59730.057723
35-0.06715-0.52010.30244
360.0130730.10130.459839

\begin{tabular}{lllllllll}
\hline
Partial Autocorrelation Function \tabularnewline
Time lag k & PACF(k) & T-STAT & P-value \tabularnewline
1 & 0.935977 & 7.25 & 0 \tabularnewline
2 & -0.193531 & -1.4991 & 0.069548 \tabularnewline
3 & 0.242476 & 1.8782 & 0.032607 \tabularnewline
4 & 0.10879 & 0.8427 & 0.201377 \tabularnewline
5 & 0.076844 & 0.5952 & 0.276964 \tabularnewline
6 & -0.151818 & -1.176 & 0.122125 \tabularnewline
7 & -0.234042 & -1.8129 & 0.037426 \tabularnewline
8 & -0.213774 & -1.6559 & 0.051483 \tabularnewline
9 & -0.036167 & -0.2801 & 0.390165 \tabularnewline
10 & -0.003349 & -0.0259 & 0.489694 \tabularnewline
11 & 0.273837 & 2.1211 & 0.019026 \tabularnewline
12 & -0.1811 & -1.4028 & 0.082916 \tabularnewline
13 & -0.425171 & -3.2934 & 0.000832 \tabularnewline
14 & 0.084682 & 0.6559 & 0.257184 \tabularnewline
15 & -0.028948 & -0.2242 & 0.411669 \tabularnewline
16 & -0.051981 & -0.4026 & 0.344322 \tabularnewline
17 & 0.0474 & 0.3672 & 0.357396 \tabularnewline
18 & 0.017286 & 0.1339 & 0.446968 \tabularnewline
19 & 0.048404 & 0.3749 & 0.354514 \tabularnewline
20 & -0.158285 & -1.2261 & 0.112481 \tabularnewline
21 & 0.093192 & 0.7219 & 0.236592 \tabularnewline
22 & -0.11994 & -0.929 & 0.178293 \tabularnewline
23 & -0.096207 & -0.7452 & 0.229526 \tabularnewline
24 & 0.008827 & 0.0684 & 0.472857 \tabularnewline
25 & 0.026969 & 0.2089 & 0.417617 \tabularnewline
26 & -0.00044 & -0.0034 & 0.498645 \tabularnewline
27 & 0.143569 & 1.1121 & 0.13527 \tabularnewline
28 & -0.035565 & -0.2755 & 0.391946 \tabularnewline
29 & 0.094746 & 0.7339 & 0.232935 \tabularnewline
30 & 0.005317 & 0.0412 & 0.483643 \tabularnewline
31 & 0.087067 & 0.6744 & 0.251317 \tabularnewline
32 & -0.01072 & -0.083 & 0.46705 \tabularnewline
33 & 0.067141 & 0.5201 & 0.302463 \tabularnewline
34 & -0.206214 & -1.5973 & 0.057723 \tabularnewline
35 & -0.06715 & -0.5201 & 0.30244 \tabularnewline
36 & 0.013073 & 0.1013 & 0.459839 \tabularnewline
\hline
\end{tabular}
%Source: https://freestatistics.org/blog/index.php?pk=65519&T=2

[TABLE]
[ROW][C]Partial Autocorrelation Function[/C][/ROW]
[ROW][C]Time lag k[/C][C]PACF(k)[/C][C]T-STAT[/C][C]P-value[/C][/ROW]
[ROW][C]1[/C][C]0.935977[/C][C]7.25[/C][C]0[/C][/ROW]
[ROW][C]2[/C][C]-0.193531[/C][C]-1.4991[/C][C]0.069548[/C][/ROW]
[ROW][C]3[/C][C]0.242476[/C][C]1.8782[/C][C]0.032607[/C][/ROW]
[ROW][C]4[/C][C]0.10879[/C][C]0.8427[/C][C]0.201377[/C][/ROW]
[ROW][C]5[/C][C]0.076844[/C][C]0.5952[/C][C]0.276964[/C][/ROW]
[ROW][C]6[/C][C]-0.151818[/C][C]-1.176[/C][C]0.122125[/C][/ROW]
[ROW][C]7[/C][C]-0.234042[/C][C]-1.8129[/C][C]0.037426[/C][/ROW]
[ROW][C]8[/C][C]-0.213774[/C][C]-1.6559[/C][C]0.051483[/C][/ROW]
[ROW][C]9[/C][C]-0.036167[/C][C]-0.2801[/C][C]0.390165[/C][/ROW]
[ROW][C]10[/C][C]-0.003349[/C][C]-0.0259[/C][C]0.489694[/C][/ROW]
[ROW][C]11[/C][C]0.273837[/C][C]2.1211[/C][C]0.019026[/C][/ROW]
[ROW][C]12[/C][C]-0.1811[/C][C]-1.4028[/C][C]0.082916[/C][/ROW]
[ROW][C]13[/C][C]-0.425171[/C][C]-3.2934[/C][C]0.000832[/C][/ROW]
[ROW][C]14[/C][C]0.084682[/C][C]0.6559[/C][C]0.257184[/C][/ROW]
[ROW][C]15[/C][C]-0.028948[/C][C]-0.2242[/C][C]0.411669[/C][/ROW]
[ROW][C]16[/C][C]-0.051981[/C][C]-0.4026[/C][C]0.344322[/C][/ROW]
[ROW][C]17[/C][C]0.0474[/C][C]0.3672[/C][C]0.357396[/C][/ROW]
[ROW][C]18[/C][C]0.017286[/C][C]0.1339[/C][C]0.446968[/C][/ROW]
[ROW][C]19[/C][C]0.048404[/C][C]0.3749[/C][C]0.354514[/C][/ROW]
[ROW][C]20[/C][C]-0.158285[/C][C]-1.2261[/C][C]0.112481[/C][/ROW]
[ROW][C]21[/C][C]0.093192[/C][C]0.7219[/C][C]0.236592[/C][/ROW]
[ROW][C]22[/C][C]-0.11994[/C][C]-0.929[/C][C]0.178293[/C][/ROW]
[ROW][C]23[/C][C]-0.096207[/C][C]-0.7452[/C][C]0.229526[/C][/ROW]
[ROW][C]24[/C][C]0.008827[/C][C]0.0684[/C][C]0.472857[/C][/ROW]
[ROW][C]25[/C][C]0.026969[/C][C]0.2089[/C][C]0.417617[/C][/ROW]
[ROW][C]26[/C][C]-0.00044[/C][C]-0.0034[/C][C]0.498645[/C][/ROW]
[ROW][C]27[/C][C]0.143569[/C][C]1.1121[/C][C]0.13527[/C][/ROW]
[ROW][C]28[/C][C]-0.035565[/C][C]-0.2755[/C][C]0.391946[/C][/ROW]
[ROW][C]29[/C][C]0.094746[/C][C]0.7339[/C][C]0.232935[/C][/ROW]
[ROW][C]30[/C][C]0.005317[/C][C]0.0412[/C][C]0.483643[/C][/ROW]
[ROW][C]31[/C][C]0.087067[/C][C]0.6744[/C][C]0.251317[/C][/ROW]
[ROW][C]32[/C][C]-0.01072[/C][C]-0.083[/C][C]0.46705[/C][/ROW]
[ROW][C]33[/C][C]0.067141[/C][C]0.5201[/C][C]0.302463[/C][/ROW]
[ROW][C]34[/C][C]-0.206214[/C][C]-1.5973[/C][C]0.057723[/C][/ROW]
[ROW][C]35[/C][C]-0.06715[/C][C]-0.5201[/C][C]0.30244[/C][/ROW]
[ROW][C]36[/C][C]0.013073[/C][C]0.1013[/C][C]0.459839[/C][/ROW]
[/TABLE]
Source: https://freestatistics.org/blog/index.php?pk=65519&T=2

Globally Unique Identifier (entire table): ba.freestatistics.org/blog/index.php?pk=65519&T=2

As an alternative you can also use a QR Code:  

The GUIDs for individual cells are displayed in the table below:

Partial Autocorrelation Function
Time lag kPACF(k)T-STATP-value
10.9359777.250
2-0.193531-1.49910.069548
30.2424761.87820.032607
40.108790.84270.201377
50.0768440.59520.276964
6-0.151818-1.1760.122125
7-0.234042-1.81290.037426
8-0.213774-1.65590.051483
9-0.036167-0.28010.390165
10-0.003349-0.02590.489694
110.2738372.12110.019026
12-0.1811-1.40280.082916
13-0.425171-3.29340.000832
140.0846820.65590.257184
15-0.028948-0.22420.411669
16-0.051981-0.40260.344322
170.04740.36720.357396
180.0172860.13390.446968
190.0484040.37490.354514
20-0.158285-1.22610.112481
210.0931920.72190.236592
22-0.11994-0.9290.178293
23-0.096207-0.74520.229526
240.0088270.06840.472857
250.0269690.20890.417617
26-0.00044-0.00340.498645
270.1435691.11210.13527
28-0.035565-0.27550.391946
290.0947460.73390.232935
300.0053170.04120.483643
310.0870670.67440.251317
32-0.01072-0.0830.46705
330.0671410.52010.302463
34-0.206214-1.59730.057723
35-0.06715-0.52010.30244
360.0130730.10130.459839


Parameters (Session):
par1 = 36 ; par2 = 1 ; par3 = 0 ; par4 = 0 ; par5 = 12 ; par6 = White Noise ; par7 = 0.95 ;
Parameters (R input):
par1 = 36 ; par2 = 1 ; par3 = 0 ; par4 = 0 ; par5 = 12 ; par6 = White Noise ; par7 = 0.95 ;
R code (references can be found in the software module):
if (par1 == 'Default') {
par1 = 10*log10(length(x))
} else {
par1 <- as.numeric(par1)
}
par2 <- as.numeric(par2)
par3 <- as.numeric(par3)
par4 <- as.numeric(par4)
par5 <- as.numeric(par5)
if (par6 == 'White Noise') par6 <- 'white' else par6 <- 'ma'
par7 <- as.numeric(par7)
if (par2 == 0) {
x <- log(x)
} else {
x <- (x ^ par2 - 1) / par2
}
if (par3 > 0) x <- diff(x,lag=1,difference=par3)
if (par4 > 0) x <- diff(x,lag=par5,difference=par4)
bitmap(file='pic1.png')
racf <- acf(x, par1, main='Autocorrelation', xlab='time lag', ylab='ACF', ci.type=par6, ci=par7, sub=paste('(lambda=',par2,', d=',par3,', D=',par4,', CI=', par7, ', CI type=',par6,')',sep=''))
dev.off()
bitmap(file='pic2.png')
rpacf <- pacf(x,par1,main='Partial Autocorrelation',xlab='lags',ylab='PACF')
dev.off()
(myacf <- c(racf$acf))
(mypacf <- c(rpacf$acf))
lengthx <- length(x)
sqrtn <- sqrt(lengthx)
load(file='createtable')
a<-table.start()
a<-table.row.start(a)
a<-table.element(a,'Autocorrelation Function',4,TRUE)
a<-table.row.end(a)
a<-table.row.start(a)
a<-table.element(a,'Time lag k',header=TRUE)
a<-table.element(a,hyperlink('basics.htm','ACF(k)','click here for more information about the Autocorrelation Function'),header=TRUE)
a<-table.element(a,'T-STAT',header=TRUE)
a<-table.element(a,'P-value',header=TRUE)
a<-table.row.end(a)
for (i in 2:(par1+1)) {
a<-table.row.start(a)
a<-table.element(a,i-1,header=TRUE)
a<-table.element(a,round(myacf[i],6))
mytstat <- myacf[i]*sqrtn
a<-table.element(a,round(mytstat,4))
a<-table.element(a,round(1-pt(abs(mytstat),lengthx),6))
a<-table.row.end(a)
}
a<-table.end(a)
table.save(a,file='mytable.tab')
a<-table.start()
a<-table.row.start(a)
a<-table.element(a,'Partial Autocorrelation Function',4,TRUE)
a<-table.row.end(a)
a<-table.row.start(a)
a<-table.element(a,'Time lag k',header=TRUE)
a<-table.element(a,hyperlink('basics.htm','PACF(k)','click here for more information about the Partial Autocorrelation Function'),header=TRUE)
a<-table.element(a,'T-STAT',header=TRUE)
a<-table.element(a,'P-value',header=TRUE)
a<-table.row.end(a)
for (i in 1:par1) {
a<-table.row.start(a)
a<-table.element(a,i,header=TRUE)
a<-table.element(a,round(mypacf[i],6))
mytstat <- mypacf[i]*sqrtn
a<-table.element(a,round(mytstat,4))
a<-table.element(a,round(1-pt(abs(mytstat),lengthx),6))
a<-table.row.end(a)
}
a<-table.end(a)
table.save(a,file='mytable1.tab')