Free Statistics

of Irreproducible Research!

Author's title

Author*The author of this computation has been verified*
R Software Modulerwasp_autocorrelation.wasp
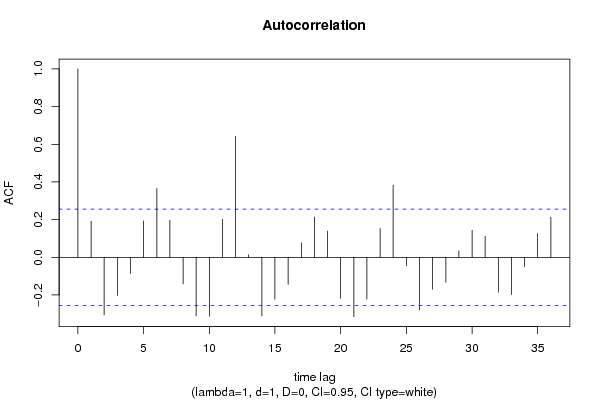
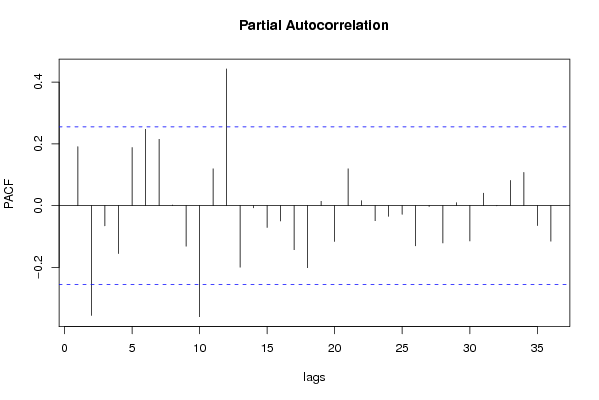
Title produced by software(Partial) Autocorrelation Function
Date of computationThu, 10 Dec 2009 09:00:26 -0700
Cite this page as followsStatistical Computations at FreeStatistics.org, Office for Research Development and Education, URL https://freestatistics.org/blog/index.php?v=date/2009/Dec/10/t12604609136sim6vbe1c5mvit.htm/, Retrieved Fri, 19 Apr 2024 17:37:08 +0000
Statistical Computations at FreeStatistics.org, Office for Research Development and Education, URL https://freestatistics.org/blog/index.php?pk=65524, Retrieved Fri, 19 Apr 2024 17:37:08 +0000
QR Codes:

Original text written by user:
IsPrivate?No (this computation is public)
User-defined keywords
Estimated Impact116
Family? (F = Feedback message, R = changed R code, M = changed R Module, P = changed Parameters, D = changed Data)
-     [Univariate Data Series] [data set] [2008-12-01 19:54:57] [b98453cac15ba1066b407e146608df68]
- RMP   [Standard Deviation-Mean Plot] [] [2009-11-27 14:40:44] [b98453cac15ba1066b407e146608df68]
- RMPD      [(Partial) Autocorrelation Function] [] [2009-12-10 16:00:26] [66ffaa9e54a90d3ae4874684602d24e9] [Current]
Feedback Forum

Post a new message
Dataseries X:
462
455
461
461
463
462
456
455
456
472
472
471
465
459
465
468
467
463
460
462
461
476
476
471
453
443
442
444
438
427
424
416
406
431
434
418
412
404
409
412
406
398
397
385
390
413
413
401
397
397
409
419
424
428
430
424
433
456
459
446


Summary of computational transaction
Raw Inputview raw input (R code)
Raw Outputview raw output of R engine
Computing time1 seconds
R Server'Gwilym Jenkins' @ 72.249.127.135

\begin{tabular}{lllllllll}
\hline
Summary of computational transaction \tabularnewline
Raw Input & view raw input (R code)  \tabularnewline
Raw Output & view raw output of R engine  \tabularnewline
Computing time & 1 seconds \tabularnewline
R Server & 'Gwilym Jenkins' @ 72.249.127.135 \tabularnewline
\hline
\end{tabular}
%Source: https://freestatistics.org/blog/index.php?pk=65524&T=0

[TABLE]
[ROW][C]Summary of computational transaction[/C][/ROW]
[ROW][C]Raw Input[/C][C]view raw input (R code) [/C][/ROW]
[ROW][C]Raw Output[/C][C]view raw output of R engine [/C][/ROW]
[ROW][C]Computing time[/C][C]1 seconds[/C][/ROW]
[ROW][C]R Server[/C][C]'Gwilym Jenkins' @ 72.249.127.135[/C][/ROW]
[/TABLE]
Source: https://freestatistics.org/blog/index.php?pk=65524&T=0

Globally Unique Identifier (entire table): ba.freestatistics.org/blog/index.php?pk=65524&T=0

As an alternative you can also use a QR Code:  

The GUIDs for individual cells are displayed in the table below:

Summary of computational transaction
Raw Inputview raw input (R code)
Raw Outputview raw output of R engine
Computing time1 seconds
R Server'Gwilym Jenkins' @ 72.249.127.135


Autocorrelation Function
Time lag kACF(k)T-STATP-value
10.1909961.46710.073834
2-0.306562-2.35470.010941
3-0.202607-1.55630.062498
4-0.086513-0.66450.254474
50.192711.48020.072065
60.3649312.80310.00342
70.1968381.51190.067944
8-0.141923-1.09010.140044
9-0.311362-2.39160.00999
10-0.313159-2.40540.009654
110.2022431.55350.062831
120.6428534.93783e-06
130.0128560.09870.460837
14-0.311445-2.39230.009975
15-0.222989-1.71280.045999
16-0.14382-1.10470.136886
170.0763650.58660.279864
180.213841.64250.052899
190.1392891.06990.144512
20-0.217271-1.66890.050219
21-0.315456-2.42310.009239
22-0.221886-1.70430.04679
230.152431.17080.123186
240.3827952.94030.002338
25-0.044949-0.34530.365563
26-0.27967-2.14820.017908
27-0.169691-1.30340.098747
28-0.132514-1.01790.15645
290.0332470.25540.399662
300.1429991.09840.138247
310.1110760.85320.198503
32-0.185609-1.42570.079614
33-0.198211-1.52250.066614
34-0.049865-0.3830.351539
350.1260160.9680.16851
360.2128671.63510.053681

\begin{tabular}{lllllllll}
\hline
Autocorrelation Function \tabularnewline
Time lag k & ACF(k) & T-STAT & P-value \tabularnewline
1 & 0.190996 & 1.4671 & 0.073834 \tabularnewline
2 & -0.306562 & -2.3547 & 0.010941 \tabularnewline
3 & -0.202607 & -1.5563 & 0.062498 \tabularnewline
4 & -0.086513 & -0.6645 & 0.254474 \tabularnewline
5 & 0.19271 & 1.4802 & 0.072065 \tabularnewline
6 & 0.364931 & 2.8031 & 0.00342 \tabularnewline
7 & 0.196838 & 1.5119 & 0.067944 \tabularnewline
8 & -0.141923 & -1.0901 & 0.140044 \tabularnewline
9 & -0.311362 & -2.3916 & 0.00999 \tabularnewline
10 & -0.313159 & -2.4054 & 0.009654 \tabularnewline
11 & 0.202243 & 1.5535 & 0.062831 \tabularnewline
12 & 0.642853 & 4.9378 & 3e-06 \tabularnewline
13 & 0.012856 & 0.0987 & 0.460837 \tabularnewline
14 & -0.311445 & -2.3923 & 0.009975 \tabularnewline
15 & -0.222989 & -1.7128 & 0.045999 \tabularnewline
16 & -0.14382 & -1.1047 & 0.136886 \tabularnewline
17 & 0.076365 & 0.5866 & 0.279864 \tabularnewline
18 & 0.21384 & 1.6425 & 0.052899 \tabularnewline
19 & 0.139289 & 1.0699 & 0.144512 \tabularnewline
20 & -0.217271 & -1.6689 & 0.050219 \tabularnewline
21 & -0.315456 & -2.4231 & 0.009239 \tabularnewline
22 & -0.221886 & -1.7043 & 0.04679 \tabularnewline
23 & 0.15243 & 1.1708 & 0.123186 \tabularnewline
24 & 0.382795 & 2.9403 & 0.002338 \tabularnewline
25 & -0.044949 & -0.3453 & 0.365563 \tabularnewline
26 & -0.27967 & -2.1482 & 0.017908 \tabularnewline
27 & -0.169691 & -1.3034 & 0.098747 \tabularnewline
28 & -0.132514 & -1.0179 & 0.15645 \tabularnewline
29 & 0.033247 & 0.2554 & 0.399662 \tabularnewline
30 & 0.142999 & 1.0984 & 0.138247 \tabularnewline
31 & 0.111076 & 0.8532 & 0.198503 \tabularnewline
32 & -0.185609 & -1.4257 & 0.079614 \tabularnewline
33 & -0.198211 & -1.5225 & 0.066614 \tabularnewline
34 & -0.049865 & -0.383 & 0.351539 \tabularnewline
35 & 0.126016 & 0.968 & 0.16851 \tabularnewline
36 & 0.212867 & 1.6351 & 0.053681 \tabularnewline
\hline
\end{tabular}
%Source: https://freestatistics.org/blog/index.php?pk=65524&T=1

[TABLE]
[ROW][C]Autocorrelation Function[/C][/ROW]
[ROW][C]Time lag k[/C][C]ACF(k)[/C][C]T-STAT[/C][C]P-value[/C][/ROW]
[ROW][C]1[/C][C]0.190996[/C][C]1.4671[/C][C]0.073834[/C][/ROW]
[ROW][C]2[/C][C]-0.306562[/C][C]-2.3547[/C][C]0.010941[/C][/ROW]
[ROW][C]3[/C][C]-0.202607[/C][C]-1.5563[/C][C]0.062498[/C][/ROW]
[ROW][C]4[/C][C]-0.086513[/C][C]-0.6645[/C][C]0.254474[/C][/ROW]
[ROW][C]5[/C][C]0.19271[/C][C]1.4802[/C][C]0.072065[/C][/ROW]
[ROW][C]6[/C][C]0.364931[/C][C]2.8031[/C][C]0.00342[/C][/ROW]
[ROW][C]7[/C][C]0.196838[/C][C]1.5119[/C][C]0.067944[/C][/ROW]
[ROW][C]8[/C][C]-0.141923[/C][C]-1.0901[/C][C]0.140044[/C][/ROW]
[ROW][C]9[/C][C]-0.311362[/C][C]-2.3916[/C][C]0.00999[/C][/ROW]
[ROW][C]10[/C][C]-0.313159[/C][C]-2.4054[/C][C]0.009654[/C][/ROW]
[ROW][C]11[/C][C]0.202243[/C][C]1.5535[/C][C]0.062831[/C][/ROW]
[ROW][C]12[/C][C]0.642853[/C][C]4.9378[/C][C]3e-06[/C][/ROW]
[ROW][C]13[/C][C]0.012856[/C][C]0.0987[/C][C]0.460837[/C][/ROW]
[ROW][C]14[/C][C]-0.311445[/C][C]-2.3923[/C][C]0.009975[/C][/ROW]
[ROW][C]15[/C][C]-0.222989[/C][C]-1.7128[/C][C]0.045999[/C][/ROW]
[ROW][C]16[/C][C]-0.14382[/C][C]-1.1047[/C][C]0.136886[/C][/ROW]
[ROW][C]17[/C][C]0.076365[/C][C]0.5866[/C][C]0.279864[/C][/ROW]
[ROW][C]18[/C][C]0.21384[/C][C]1.6425[/C][C]0.052899[/C][/ROW]
[ROW][C]19[/C][C]0.139289[/C][C]1.0699[/C][C]0.144512[/C][/ROW]
[ROW][C]20[/C][C]-0.217271[/C][C]-1.6689[/C][C]0.050219[/C][/ROW]
[ROW][C]21[/C][C]-0.315456[/C][C]-2.4231[/C][C]0.009239[/C][/ROW]
[ROW][C]22[/C][C]-0.221886[/C][C]-1.7043[/C][C]0.04679[/C][/ROW]
[ROW][C]23[/C][C]0.15243[/C][C]1.1708[/C][C]0.123186[/C][/ROW]
[ROW][C]24[/C][C]0.382795[/C][C]2.9403[/C][C]0.002338[/C][/ROW]
[ROW][C]25[/C][C]-0.044949[/C][C]-0.3453[/C][C]0.365563[/C][/ROW]
[ROW][C]26[/C][C]-0.27967[/C][C]-2.1482[/C][C]0.017908[/C][/ROW]
[ROW][C]27[/C][C]-0.169691[/C][C]-1.3034[/C][C]0.098747[/C][/ROW]
[ROW][C]28[/C][C]-0.132514[/C][C]-1.0179[/C][C]0.15645[/C][/ROW]
[ROW][C]29[/C][C]0.033247[/C][C]0.2554[/C][C]0.399662[/C][/ROW]
[ROW][C]30[/C][C]0.142999[/C][C]1.0984[/C][C]0.138247[/C][/ROW]
[ROW][C]31[/C][C]0.111076[/C][C]0.8532[/C][C]0.198503[/C][/ROW]
[ROW][C]32[/C][C]-0.185609[/C][C]-1.4257[/C][C]0.079614[/C][/ROW]
[ROW][C]33[/C][C]-0.198211[/C][C]-1.5225[/C][C]0.066614[/C][/ROW]
[ROW][C]34[/C][C]-0.049865[/C][C]-0.383[/C][C]0.351539[/C][/ROW]
[ROW][C]35[/C][C]0.126016[/C][C]0.968[/C][C]0.16851[/C][/ROW]
[ROW][C]36[/C][C]0.212867[/C][C]1.6351[/C][C]0.053681[/C][/ROW]
[/TABLE]
Source: https://freestatistics.org/blog/index.php?pk=65524&T=1

Globally Unique Identifier (entire table): ba.freestatistics.org/blog/index.php?pk=65524&T=1

As an alternative you can also use a QR Code:  

The GUIDs for individual cells are displayed in the table below:

Autocorrelation Function
Time lag kACF(k)T-STATP-value
10.1909961.46710.073834
2-0.306562-2.35470.010941
3-0.202607-1.55630.062498
4-0.086513-0.66450.254474
50.192711.48020.072065
60.3649312.80310.00342
70.1968381.51190.067944
8-0.141923-1.09010.140044
9-0.311362-2.39160.00999
10-0.313159-2.40540.009654
110.2022431.55350.062831
120.6428534.93783e-06
130.0128560.09870.460837
14-0.311445-2.39230.009975
15-0.222989-1.71280.045999
16-0.14382-1.10470.136886
170.0763650.58660.279864
180.213841.64250.052899
190.1392891.06990.144512
20-0.217271-1.66890.050219
21-0.315456-2.42310.009239
22-0.221886-1.70430.04679
230.152431.17080.123186
240.3827952.94030.002338
25-0.044949-0.34530.365563
26-0.27967-2.14820.017908
27-0.169691-1.30340.098747
28-0.132514-1.01790.15645
290.0332470.25540.399662
300.1429991.09840.138247
310.1110760.85320.198503
32-0.185609-1.42570.079614
33-0.198211-1.52250.066614
34-0.049865-0.3830.351539
350.1260160.9680.16851
360.2128671.63510.053681


Partial Autocorrelation Function
Time lag kPACF(k)T-STATP-value
10.1909961.46710.073834
2-0.356029-2.73470.004116
3-0.065616-0.5040.308066
4-0.155382-1.19350.118723
50.1879251.44350.077088
60.2472091.89890.031239
70.2149521.65110.052019
80.0018820.01450.494259
9-0.131743-1.01190.15785
10-0.359844-2.7640.003803
110.1193310.91660.181542
120.4427613.40090.000605
13-0.19974-1.53420.065159
14-0.007314-0.05620.477695
15-0.07097-0.54510.293859
16-0.049523-0.38040.35251
17-0.142849-1.09720.138497
18-0.201203-1.54550.06379
190.0140670.10810.457161
20-0.116017-0.89110.188237
210.1191880.91550.181828
220.0157730.12120.451989
23-0.048879-0.37540.354337
24-0.0348-0.26730.395083
25-0.02829-0.21730.414362
26-0.130304-1.00090.160486
27-0.002676-0.02060.491835
28-0.121174-0.93080.177886
290.0095830.07360.470786
30-0.114489-0.87940.191375
310.0401560.30840.379414
32-0.000872-0.00670.497338
330.0813860.62510.267146
340.1075170.82590.206107
35-0.064615-0.49630.310757
36-0.11552-0.88730.189254

\begin{tabular}{lllllllll}
\hline
Partial Autocorrelation Function \tabularnewline
Time lag k & PACF(k) & T-STAT & P-value \tabularnewline
1 & 0.190996 & 1.4671 & 0.073834 \tabularnewline
2 & -0.356029 & -2.7347 & 0.004116 \tabularnewline
3 & -0.065616 & -0.504 & 0.308066 \tabularnewline
4 & -0.155382 & -1.1935 & 0.118723 \tabularnewline
5 & 0.187925 & 1.4435 & 0.077088 \tabularnewline
6 & 0.247209 & 1.8989 & 0.031239 \tabularnewline
7 & 0.214952 & 1.6511 & 0.052019 \tabularnewline
8 & 0.001882 & 0.0145 & 0.494259 \tabularnewline
9 & -0.131743 & -1.0119 & 0.15785 \tabularnewline
10 & -0.359844 & -2.764 & 0.003803 \tabularnewline
11 & 0.119331 & 0.9166 & 0.181542 \tabularnewline
12 & 0.442761 & 3.4009 & 0.000605 \tabularnewline
13 & -0.19974 & -1.5342 & 0.065159 \tabularnewline
14 & -0.007314 & -0.0562 & 0.477695 \tabularnewline
15 & -0.07097 & -0.5451 & 0.293859 \tabularnewline
16 & -0.049523 & -0.3804 & 0.35251 \tabularnewline
17 & -0.142849 & -1.0972 & 0.138497 \tabularnewline
18 & -0.201203 & -1.5455 & 0.06379 \tabularnewline
19 & 0.014067 & 0.1081 & 0.457161 \tabularnewline
20 & -0.116017 & -0.8911 & 0.188237 \tabularnewline
21 & 0.119188 & 0.9155 & 0.181828 \tabularnewline
22 & 0.015773 & 0.1212 & 0.451989 \tabularnewline
23 & -0.048879 & -0.3754 & 0.354337 \tabularnewline
24 & -0.0348 & -0.2673 & 0.395083 \tabularnewline
25 & -0.02829 & -0.2173 & 0.414362 \tabularnewline
26 & -0.130304 & -1.0009 & 0.160486 \tabularnewline
27 & -0.002676 & -0.0206 & 0.491835 \tabularnewline
28 & -0.121174 & -0.9308 & 0.177886 \tabularnewline
29 & 0.009583 & 0.0736 & 0.470786 \tabularnewline
30 & -0.114489 & -0.8794 & 0.191375 \tabularnewline
31 & 0.040156 & 0.3084 & 0.379414 \tabularnewline
32 & -0.000872 & -0.0067 & 0.497338 \tabularnewline
33 & 0.081386 & 0.6251 & 0.267146 \tabularnewline
34 & 0.107517 & 0.8259 & 0.206107 \tabularnewline
35 & -0.064615 & -0.4963 & 0.310757 \tabularnewline
36 & -0.11552 & -0.8873 & 0.189254 \tabularnewline
\hline
\end{tabular}
%Source: https://freestatistics.org/blog/index.php?pk=65524&T=2

[TABLE]
[ROW][C]Partial Autocorrelation Function[/C][/ROW]
[ROW][C]Time lag k[/C][C]PACF(k)[/C][C]T-STAT[/C][C]P-value[/C][/ROW]
[ROW][C]1[/C][C]0.190996[/C][C]1.4671[/C][C]0.073834[/C][/ROW]
[ROW][C]2[/C][C]-0.356029[/C][C]-2.7347[/C][C]0.004116[/C][/ROW]
[ROW][C]3[/C][C]-0.065616[/C][C]-0.504[/C][C]0.308066[/C][/ROW]
[ROW][C]4[/C][C]-0.155382[/C][C]-1.1935[/C][C]0.118723[/C][/ROW]
[ROW][C]5[/C][C]0.187925[/C][C]1.4435[/C][C]0.077088[/C][/ROW]
[ROW][C]6[/C][C]0.247209[/C][C]1.8989[/C][C]0.031239[/C][/ROW]
[ROW][C]7[/C][C]0.214952[/C][C]1.6511[/C][C]0.052019[/C][/ROW]
[ROW][C]8[/C][C]0.001882[/C][C]0.0145[/C][C]0.494259[/C][/ROW]
[ROW][C]9[/C][C]-0.131743[/C][C]-1.0119[/C][C]0.15785[/C][/ROW]
[ROW][C]10[/C][C]-0.359844[/C][C]-2.764[/C][C]0.003803[/C][/ROW]
[ROW][C]11[/C][C]0.119331[/C][C]0.9166[/C][C]0.181542[/C][/ROW]
[ROW][C]12[/C][C]0.442761[/C][C]3.4009[/C][C]0.000605[/C][/ROW]
[ROW][C]13[/C][C]-0.19974[/C][C]-1.5342[/C][C]0.065159[/C][/ROW]
[ROW][C]14[/C][C]-0.007314[/C][C]-0.0562[/C][C]0.477695[/C][/ROW]
[ROW][C]15[/C][C]-0.07097[/C][C]-0.5451[/C][C]0.293859[/C][/ROW]
[ROW][C]16[/C][C]-0.049523[/C][C]-0.3804[/C][C]0.35251[/C][/ROW]
[ROW][C]17[/C][C]-0.142849[/C][C]-1.0972[/C][C]0.138497[/C][/ROW]
[ROW][C]18[/C][C]-0.201203[/C][C]-1.5455[/C][C]0.06379[/C][/ROW]
[ROW][C]19[/C][C]0.014067[/C][C]0.1081[/C][C]0.457161[/C][/ROW]
[ROW][C]20[/C][C]-0.116017[/C][C]-0.8911[/C][C]0.188237[/C][/ROW]
[ROW][C]21[/C][C]0.119188[/C][C]0.9155[/C][C]0.181828[/C][/ROW]
[ROW][C]22[/C][C]0.015773[/C][C]0.1212[/C][C]0.451989[/C][/ROW]
[ROW][C]23[/C][C]-0.048879[/C][C]-0.3754[/C][C]0.354337[/C][/ROW]
[ROW][C]24[/C][C]-0.0348[/C][C]-0.2673[/C][C]0.395083[/C][/ROW]
[ROW][C]25[/C][C]-0.02829[/C][C]-0.2173[/C][C]0.414362[/C][/ROW]
[ROW][C]26[/C][C]-0.130304[/C][C]-1.0009[/C][C]0.160486[/C][/ROW]
[ROW][C]27[/C][C]-0.002676[/C][C]-0.0206[/C][C]0.491835[/C][/ROW]
[ROW][C]28[/C][C]-0.121174[/C][C]-0.9308[/C][C]0.177886[/C][/ROW]
[ROW][C]29[/C][C]0.009583[/C][C]0.0736[/C][C]0.470786[/C][/ROW]
[ROW][C]30[/C][C]-0.114489[/C][C]-0.8794[/C][C]0.191375[/C][/ROW]
[ROW][C]31[/C][C]0.040156[/C][C]0.3084[/C][C]0.379414[/C][/ROW]
[ROW][C]32[/C][C]-0.000872[/C][C]-0.0067[/C][C]0.497338[/C][/ROW]
[ROW][C]33[/C][C]0.081386[/C][C]0.6251[/C][C]0.267146[/C][/ROW]
[ROW][C]34[/C][C]0.107517[/C][C]0.8259[/C][C]0.206107[/C][/ROW]
[ROW][C]35[/C][C]-0.064615[/C][C]-0.4963[/C][C]0.310757[/C][/ROW]
[ROW][C]36[/C][C]-0.11552[/C][C]-0.8873[/C][C]0.189254[/C][/ROW]
[/TABLE]
Source: https://freestatistics.org/blog/index.php?pk=65524&T=2

Globally Unique Identifier (entire table): ba.freestatistics.org/blog/index.php?pk=65524&T=2

As an alternative you can also use a QR Code:  

The GUIDs for individual cells are displayed in the table below:

Partial Autocorrelation Function
Time lag kPACF(k)T-STATP-value
10.1909961.46710.073834
2-0.356029-2.73470.004116
3-0.065616-0.5040.308066
4-0.155382-1.19350.118723
50.1879251.44350.077088
60.2472091.89890.031239
70.2149521.65110.052019
80.0018820.01450.494259
9-0.131743-1.01190.15785
10-0.359844-2.7640.003803
110.1193310.91660.181542
120.4427613.40090.000605
13-0.19974-1.53420.065159
14-0.007314-0.05620.477695
15-0.07097-0.54510.293859
16-0.049523-0.38040.35251
17-0.142849-1.09720.138497
18-0.201203-1.54550.06379
190.0140670.10810.457161
20-0.116017-0.89110.188237
210.1191880.91550.181828
220.0157730.12120.451989
23-0.048879-0.37540.354337
24-0.0348-0.26730.395083
25-0.02829-0.21730.414362
26-0.130304-1.00090.160486
27-0.002676-0.02060.491835
28-0.121174-0.93080.177886
290.0095830.07360.470786
30-0.114489-0.87940.191375
310.0401560.30840.379414
32-0.000872-0.00670.497338
330.0813860.62510.267146
340.1075170.82590.206107
35-0.064615-0.49630.310757
36-0.11552-0.88730.189254


Parameters (Session):
par1 = 36 ; par2 = 1 ; par3 = 1 ; par4 = 0 ; par5 = 12 ; par6 = White Noise ; par7 = 0.95 ;
Parameters (R input):
par1 = 36 ; par2 = 1 ; par3 = 1 ; par4 = 0 ; par5 = 12 ; par6 = White Noise ; par7 = 0.95 ;
R code (references can be found in the software module):
if (par1 == 'Default') {
par1 = 10*log10(length(x))
} else {
par1 <- as.numeric(par1)
}
par2 <- as.numeric(par2)
par3 <- as.numeric(par3)
par4 <- as.numeric(par4)
par5 <- as.numeric(par5)
if (par6 == 'White Noise') par6 <- 'white' else par6 <- 'ma'
par7 <- as.numeric(par7)
if (par2 == 0) {
x <- log(x)
} else {
x <- (x ^ par2 - 1) / par2
}
if (par3 > 0) x <- diff(x,lag=1,difference=par3)
if (par4 > 0) x <- diff(x,lag=par5,difference=par4)
bitmap(file='pic1.png')
racf <- acf(x, par1, main='Autocorrelation', xlab='time lag', ylab='ACF', ci.type=par6, ci=par7, sub=paste('(lambda=',par2,', d=',par3,', D=',par4,', CI=', par7, ', CI type=',par6,')',sep=''))
dev.off()
bitmap(file='pic2.png')
rpacf <- pacf(x,par1,main='Partial Autocorrelation',xlab='lags',ylab='PACF')
dev.off()
(myacf <- c(racf$acf))
(mypacf <- c(rpacf$acf))
lengthx <- length(x)
sqrtn <- sqrt(lengthx)
load(file='createtable')
a<-table.start()
a<-table.row.start(a)
a<-table.element(a,'Autocorrelation Function',4,TRUE)
a<-table.row.end(a)
a<-table.row.start(a)
a<-table.element(a,'Time lag k',header=TRUE)
a<-table.element(a,hyperlink('basics.htm','ACF(k)','click here for more information about the Autocorrelation Function'),header=TRUE)
a<-table.element(a,'T-STAT',header=TRUE)
a<-table.element(a,'P-value',header=TRUE)
a<-table.row.end(a)
for (i in 2:(par1+1)) {
a<-table.row.start(a)
a<-table.element(a,i-1,header=TRUE)
a<-table.element(a,round(myacf[i],6))
mytstat <- myacf[i]*sqrtn
a<-table.element(a,round(mytstat,4))
a<-table.element(a,round(1-pt(abs(mytstat),lengthx),6))
a<-table.row.end(a)
}
a<-table.end(a)
table.save(a,file='mytable.tab')
a<-table.start()
a<-table.row.start(a)
a<-table.element(a,'Partial Autocorrelation Function',4,TRUE)
a<-table.row.end(a)
a<-table.row.start(a)
a<-table.element(a,'Time lag k',header=TRUE)
a<-table.element(a,hyperlink('basics.htm','PACF(k)','click here for more information about the Partial Autocorrelation Function'),header=TRUE)
a<-table.element(a,'T-STAT',header=TRUE)
a<-table.element(a,'P-value',header=TRUE)
a<-table.row.end(a)
for (i in 1:par1) {
a<-table.row.start(a)
a<-table.element(a,i,header=TRUE)
a<-table.element(a,round(mypacf[i],6))
mytstat <- mypacf[i]*sqrtn
a<-table.element(a,round(mytstat,4))
a<-table.element(a,round(1-pt(abs(mytstat),lengthx),6))
a<-table.row.end(a)
}
a<-table.end(a)
table.save(a,file='mytable1.tab')