Free Statistics

of Irreproducible Research!

Author's title

Author*The author of this computation has been verified*
R Software Modulerwasp_autocorrelation.wasp
Title produced by software(Partial) Autocorrelation Function
Date of computationThu, 10 Dec 2009 10:50:50 -0700
Cite this page as followsStatistical Computations at FreeStatistics.org, Office for Research Development and Education, URL https://freestatistics.org/blog/index.php?v=date/2009/Dec/10/t12604676660tatlas89y9533j.htm/, Retrieved Tue, 16 Apr 2024 15:32:31 +0000
Statistical Computations at FreeStatistics.org, Office for Research Development and Education, URL https://freestatistics.org/blog/index.php?pk=65650, Retrieved Tue, 16 Apr 2024 15:32:31 +0000
QR Codes:

Original text written by user:
IsPrivate?No (this computation is public)
User-defined keywords
Estimated Impact116
Family? (F = Feedback message, R = changed R code, M = changed R Module, P = changed Parameters, D = changed Data)
-       [(Partial) Autocorrelation Function] [] [2009-12-10 17:50:50] [51118f1042b56b16d340924f16263174] [Current]
Feedback Forum

Post a new message
Dataseries X:
99.026
101.851
99.958
97.875
97.927
95.149
94.551
93.999
93.297
89.901
89.742
87.096
86.863
86.718
80.020
63.483
51.289
44.071
43.654
66.115
84.518
83.395
78.307
80.049
78.346
78.317
75.918
73.739
74.530
74.179
76.974
75.408
73.336
69.210
67.286
64.606
64.159
64.423
66.411
64.270
56.521
50.599
54.751
62.227
63.932
65.391
75.744
74.590
76.035
74.427
73.354
73.081
75.309
75.463
75.910
76.151
76.882
78.632
80.137
82.490
79.896
81.303
79.344
81.355
82.328
79.669
77.249
75.101
72.520
72.438
72.653
71.429
69.189
66.451
63.354
61.379
61.880
62.274
62.429
63.905
63.917
64.295
61.930
60.440
59.353
58.695
60.569
60.386
60.938
61.795
63.304
64.270
63.492
61.333
59.341
58.412
58.725
59.277
58.562
57.858
58.790
58.243
57.044
57.339
59.429
60.575
61.950
61.712


Summary of computational transaction
Raw Inputview raw input (R code)
Raw Outputview raw output of R engine
Computing time0 seconds
R Server'Gwilym Jenkins' @ 72.249.127.135

\begin{tabular}{lllllllll}
\hline
Summary of computational transaction \tabularnewline
Raw Input & view raw input (R code)  \tabularnewline
Raw Output & view raw output of R engine  \tabularnewline
Computing time & 0 seconds \tabularnewline
R Server & 'Gwilym Jenkins' @ 72.249.127.135 \tabularnewline
\hline
\end{tabular}
%Source: https://freestatistics.org/blog/index.php?pk=65650&T=0

[TABLE]
[ROW][C]Summary of computational transaction[/C][/ROW]
[ROW][C]Raw Input[/C][C]view raw input (R code) [/C][/ROW]
[ROW][C]Raw Output[/C][C]view raw output of R engine [/C][/ROW]
[ROW][C]Computing time[/C][C]0 seconds[/C][/ROW]
[ROW][C]R Server[/C][C]'Gwilym Jenkins' @ 72.249.127.135[/C][/ROW]
[/TABLE]
Source: https://freestatistics.org/blog/index.php?pk=65650&T=0

Globally Unique Identifier (entire table): ba.freestatistics.org/blog/index.php?pk=65650&T=0

As an alternative you can also use a QR Code:  

The GUIDs for individual cells are displayed in the table below:

Summary of computational transaction
Raw Inputview raw input (R code)
Raw Outputview raw output of R engine
Computing time0 seconds
R Server'Gwilym Jenkins' @ 72.249.127.135


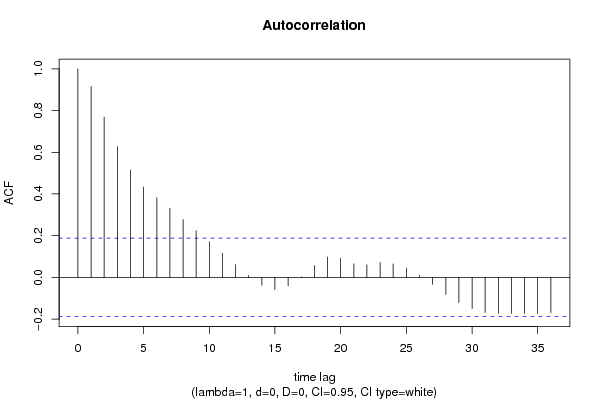
Autocorrelation Function
Time lag kACF(k)T-STATP-value
10.9153629.51270
20.7689577.99120
30.6273546.51970
40.5152385.35450
50.4338574.50888e-06
60.3814723.96446.6e-05
70.3313753.44380.000409
80.2775662.88450.002366
90.223642.32410.010995
100.1708381.77540.039325
110.1151391.19660.117049
120.061130.63530.263294
130.0085510.08890.464678
14-0.038277-0.39780.345785
15-0.05804-0.60320.27383
16-0.040689-0.42290.336622
170.002280.02370.490571
180.0567530.58980.278282
190.0975311.01360.156527
200.0922330.95850.169972
210.0648270.67370.25097
220.0603590.62730.265904
230.0709570.73740.231238
240.0646450.67180.251571
250.0444810.46230.322414
260.0106270.11040.456132
27-0.033702-0.35020.363421
28-0.082152-0.85370.197568
29-0.12089-1.25630.105854
30-0.149782-1.55660.061248
31-0.168572-1.75190.041319
32-0.17264-1.79410.037795
33-0.172476-1.79240.037932
34-0.172621-1.79390.037811
35-0.173046-1.79830.037458
36-0.168986-1.75620.040948

\begin{tabular}{lllllllll}
\hline
Autocorrelation Function \tabularnewline
Time lag k & ACF(k) & T-STAT & P-value \tabularnewline
1 & 0.915362 & 9.5127 & 0 \tabularnewline
2 & 0.768957 & 7.9912 & 0 \tabularnewline
3 & 0.627354 & 6.5197 & 0 \tabularnewline
4 & 0.515238 & 5.3545 & 0 \tabularnewline
5 & 0.433857 & 4.5088 & 8e-06 \tabularnewline
6 & 0.381472 & 3.9644 & 6.6e-05 \tabularnewline
7 & 0.331375 & 3.4438 & 0.000409 \tabularnewline
8 & 0.277566 & 2.8845 & 0.002366 \tabularnewline
9 & 0.22364 & 2.3241 & 0.010995 \tabularnewline
10 & 0.170838 & 1.7754 & 0.039325 \tabularnewline
11 & 0.115139 & 1.1966 & 0.117049 \tabularnewline
12 & 0.06113 & 0.6353 & 0.263294 \tabularnewline
13 & 0.008551 & 0.0889 & 0.464678 \tabularnewline
14 & -0.038277 & -0.3978 & 0.345785 \tabularnewline
15 & -0.05804 & -0.6032 & 0.27383 \tabularnewline
16 & -0.040689 & -0.4229 & 0.336622 \tabularnewline
17 & 0.00228 & 0.0237 & 0.490571 \tabularnewline
18 & 0.056753 & 0.5898 & 0.278282 \tabularnewline
19 & 0.097531 & 1.0136 & 0.156527 \tabularnewline
20 & 0.092233 & 0.9585 & 0.169972 \tabularnewline
21 & 0.064827 & 0.6737 & 0.25097 \tabularnewline
22 & 0.060359 & 0.6273 & 0.265904 \tabularnewline
23 & 0.070957 & 0.7374 & 0.231238 \tabularnewline
24 & 0.064645 & 0.6718 & 0.251571 \tabularnewline
25 & 0.044481 & 0.4623 & 0.322414 \tabularnewline
26 & 0.010627 & 0.1104 & 0.456132 \tabularnewline
27 & -0.033702 & -0.3502 & 0.363421 \tabularnewline
28 & -0.082152 & -0.8537 & 0.197568 \tabularnewline
29 & -0.12089 & -1.2563 & 0.105854 \tabularnewline
30 & -0.149782 & -1.5566 & 0.061248 \tabularnewline
31 & -0.168572 & -1.7519 & 0.041319 \tabularnewline
32 & -0.17264 & -1.7941 & 0.037795 \tabularnewline
33 & -0.172476 & -1.7924 & 0.037932 \tabularnewline
34 & -0.172621 & -1.7939 & 0.037811 \tabularnewline
35 & -0.173046 & -1.7983 & 0.037458 \tabularnewline
36 & -0.168986 & -1.7562 & 0.040948 \tabularnewline
\hline
\end{tabular}
%Source: https://freestatistics.org/blog/index.php?pk=65650&T=1

[TABLE]
[ROW][C]Autocorrelation Function[/C][/ROW]
[ROW][C]Time lag k[/C][C]ACF(k)[/C][C]T-STAT[/C][C]P-value[/C][/ROW]
[ROW][C]1[/C][C]0.915362[/C][C]9.5127[/C][C]0[/C][/ROW]
[ROW][C]2[/C][C]0.768957[/C][C]7.9912[/C][C]0[/C][/ROW]
[ROW][C]3[/C][C]0.627354[/C][C]6.5197[/C][C]0[/C][/ROW]
[ROW][C]4[/C][C]0.515238[/C][C]5.3545[/C][C]0[/C][/ROW]
[ROW][C]5[/C][C]0.433857[/C][C]4.5088[/C][C]8e-06[/C][/ROW]
[ROW][C]6[/C][C]0.381472[/C][C]3.9644[/C][C]6.6e-05[/C][/ROW]
[ROW][C]7[/C][C]0.331375[/C][C]3.4438[/C][C]0.000409[/C][/ROW]
[ROW][C]8[/C][C]0.277566[/C][C]2.8845[/C][C]0.002366[/C][/ROW]
[ROW][C]9[/C][C]0.22364[/C][C]2.3241[/C][C]0.010995[/C][/ROW]
[ROW][C]10[/C][C]0.170838[/C][C]1.7754[/C][C]0.039325[/C][/ROW]
[ROW][C]11[/C][C]0.115139[/C][C]1.1966[/C][C]0.117049[/C][/ROW]
[ROW][C]12[/C][C]0.06113[/C][C]0.6353[/C][C]0.263294[/C][/ROW]
[ROW][C]13[/C][C]0.008551[/C][C]0.0889[/C][C]0.464678[/C][/ROW]
[ROW][C]14[/C][C]-0.038277[/C][C]-0.3978[/C][C]0.345785[/C][/ROW]
[ROW][C]15[/C][C]-0.05804[/C][C]-0.6032[/C][C]0.27383[/C][/ROW]
[ROW][C]16[/C][C]-0.040689[/C][C]-0.4229[/C][C]0.336622[/C][/ROW]
[ROW][C]17[/C][C]0.00228[/C][C]0.0237[/C][C]0.490571[/C][/ROW]
[ROW][C]18[/C][C]0.056753[/C][C]0.5898[/C][C]0.278282[/C][/ROW]
[ROW][C]19[/C][C]0.097531[/C][C]1.0136[/C][C]0.156527[/C][/ROW]
[ROW][C]20[/C][C]0.092233[/C][C]0.9585[/C][C]0.169972[/C][/ROW]
[ROW][C]21[/C][C]0.064827[/C][C]0.6737[/C][C]0.25097[/C][/ROW]
[ROW][C]22[/C][C]0.060359[/C][C]0.6273[/C][C]0.265904[/C][/ROW]
[ROW][C]23[/C][C]0.070957[/C][C]0.7374[/C][C]0.231238[/C][/ROW]
[ROW][C]24[/C][C]0.064645[/C][C]0.6718[/C][C]0.251571[/C][/ROW]
[ROW][C]25[/C][C]0.044481[/C][C]0.4623[/C][C]0.322414[/C][/ROW]
[ROW][C]26[/C][C]0.010627[/C][C]0.1104[/C][C]0.456132[/C][/ROW]
[ROW][C]27[/C][C]-0.033702[/C][C]-0.3502[/C][C]0.363421[/C][/ROW]
[ROW][C]28[/C][C]-0.082152[/C][C]-0.8537[/C][C]0.197568[/C][/ROW]
[ROW][C]29[/C][C]-0.12089[/C][C]-1.2563[/C][C]0.105854[/C][/ROW]
[ROW][C]30[/C][C]-0.149782[/C][C]-1.5566[/C][C]0.061248[/C][/ROW]
[ROW][C]31[/C][C]-0.168572[/C][C]-1.7519[/C][C]0.041319[/C][/ROW]
[ROW][C]32[/C][C]-0.17264[/C][C]-1.7941[/C][C]0.037795[/C][/ROW]
[ROW][C]33[/C][C]-0.172476[/C][C]-1.7924[/C][C]0.037932[/C][/ROW]
[ROW][C]34[/C][C]-0.172621[/C][C]-1.7939[/C][C]0.037811[/C][/ROW]
[ROW][C]35[/C][C]-0.173046[/C][C]-1.7983[/C][C]0.037458[/C][/ROW]
[ROW][C]36[/C][C]-0.168986[/C][C]-1.7562[/C][C]0.040948[/C][/ROW]
[/TABLE]
Source: https://freestatistics.org/blog/index.php?pk=65650&T=1

Globally Unique Identifier (entire table): ba.freestatistics.org/blog/index.php?pk=65650&T=1

As an alternative you can also use a QR Code:  

The GUIDs for individual cells are displayed in the table below:

Autocorrelation Function
Time lag kACF(k)T-STATP-value
10.9153629.51270
20.7689577.99120
30.6273546.51970
40.5152385.35450
50.4338574.50888e-06
60.3814723.96446.6e-05
70.3313753.44380.000409
80.2775662.88450.002366
90.223642.32410.010995
100.1708381.77540.039325
110.1151391.19660.117049
120.061130.63530.263294
130.0085510.08890.464678
14-0.038277-0.39780.345785
15-0.05804-0.60320.27383
16-0.040689-0.42290.336622
170.002280.02370.490571
180.0567530.58980.278282
190.0975311.01360.156527
200.0922330.95850.169972
210.0648270.67370.25097
220.0603590.62730.265904
230.0709570.73740.231238
240.0646450.67180.251571
250.0444810.46230.322414
260.0106270.11040.456132
27-0.033702-0.35020.363421
28-0.082152-0.85370.197568
29-0.12089-1.25630.105854
30-0.149782-1.55660.061248
31-0.168572-1.75190.041319
32-0.17264-1.79410.037795
33-0.172476-1.79240.037932
34-0.172621-1.79390.037811
35-0.173046-1.79830.037458
36-0.168986-1.75620.040948


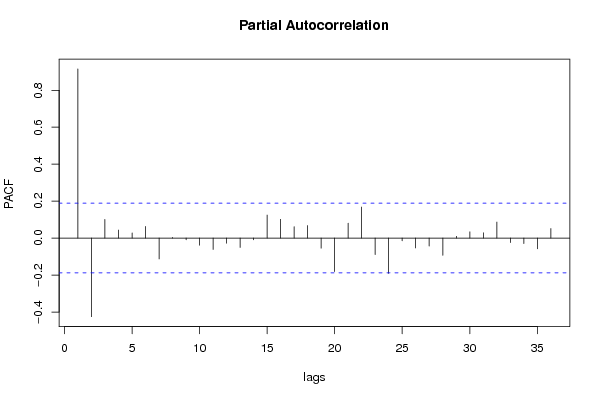
Partial Autocorrelation Function
Time lag kPACF(k)T-STATP-value
10.9153629.51270
2-0.425203-4.41881.2e-05
30.1009381.0490.148265
40.0434040.45110.326422
50.0278970.28990.386217
60.0633630.65850.255812
7-0.112781-1.1720.121878
80.0036280.03770.484996
9-0.009326-0.09690.461486
10-0.038415-0.39920.34526
11-0.061296-0.6370.262733
12-0.027823-0.28910.386511
13-0.050927-0.52920.298859
14-0.009175-0.09530.462108
150.1248111.29710.098685
160.1018131.05810.146191
170.06180.64220.261037
180.067860.70520.241097
19-0.054585-0.56730.285857
20-0.180906-1.880.031399
210.0808830.84060.201226
220.1679851.74580.041849
23-0.088938-0.92430.178702
24-0.190963-1.98450.024866
25-0.014624-0.1520.439745
26-0.053372-0.55470.290136
27-0.043087-0.44780.327606
28-0.092933-0.96580.168155
290.0095010.09870.460763
300.0341050.35440.361852
310.0283980.29510.384236
320.0868960.90310.184254
33-0.024311-0.25260.40051
34-0.029374-0.30530.380377
35-0.058116-0.6040.273568
360.0513270.53340.297425

\begin{tabular}{lllllllll}
\hline
Partial Autocorrelation Function \tabularnewline
Time lag k & PACF(k) & T-STAT & P-value \tabularnewline
1 & 0.915362 & 9.5127 & 0 \tabularnewline
2 & -0.425203 & -4.4188 & 1.2e-05 \tabularnewline
3 & 0.100938 & 1.049 & 0.148265 \tabularnewline
4 & 0.043404 & 0.4511 & 0.326422 \tabularnewline
5 & 0.027897 & 0.2899 & 0.386217 \tabularnewline
6 & 0.063363 & 0.6585 & 0.255812 \tabularnewline
7 & -0.112781 & -1.172 & 0.121878 \tabularnewline
8 & 0.003628 & 0.0377 & 0.484996 \tabularnewline
9 & -0.009326 & -0.0969 & 0.461486 \tabularnewline
10 & -0.038415 & -0.3992 & 0.34526 \tabularnewline
11 & -0.061296 & -0.637 & 0.262733 \tabularnewline
12 & -0.027823 & -0.2891 & 0.386511 \tabularnewline
13 & -0.050927 & -0.5292 & 0.298859 \tabularnewline
14 & -0.009175 & -0.0953 & 0.462108 \tabularnewline
15 & 0.124811 & 1.2971 & 0.098685 \tabularnewline
16 & 0.101813 & 1.0581 & 0.146191 \tabularnewline
17 & 0.0618 & 0.6422 & 0.261037 \tabularnewline
18 & 0.06786 & 0.7052 & 0.241097 \tabularnewline
19 & -0.054585 & -0.5673 & 0.285857 \tabularnewline
20 & -0.180906 & -1.88 & 0.031399 \tabularnewline
21 & 0.080883 & 0.8406 & 0.201226 \tabularnewline
22 & 0.167985 & 1.7458 & 0.041849 \tabularnewline
23 & -0.088938 & -0.9243 & 0.178702 \tabularnewline
24 & -0.190963 & -1.9845 & 0.024866 \tabularnewline
25 & -0.014624 & -0.152 & 0.439745 \tabularnewline
26 & -0.053372 & -0.5547 & 0.290136 \tabularnewline
27 & -0.043087 & -0.4478 & 0.327606 \tabularnewline
28 & -0.092933 & -0.9658 & 0.168155 \tabularnewline
29 & 0.009501 & 0.0987 & 0.460763 \tabularnewline
30 & 0.034105 & 0.3544 & 0.361852 \tabularnewline
31 & 0.028398 & 0.2951 & 0.384236 \tabularnewline
32 & 0.086896 & 0.9031 & 0.184254 \tabularnewline
33 & -0.024311 & -0.2526 & 0.40051 \tabularnewline
34 & -0.029374 & -0.3053 & 0.380377 \tabularnewline
35 & -0.058116 & -0.604 & 0.273568 \tabularnewline
36 & 0.051327 & 0.5334 & 0.297425 \tabularnewline
\hline
\end{tabular}
%Source: https://freestatistics.org/blog/index.php?pk=65650&T=2

[TABLE]
[ROW][C]Partial Autocorrelation Function[/C][/ROW]
[ROW][C]Time lag k[/C][C]PACF(k)[/C][C]T-STAT[/C][C]P-value[/C][/ROW]
[ROW][C]1[/C][C]0.915362[/C][C]9.5127[/C][C]0[/C][/ROW]
[ROW][C]2[/C][C]-0.425203[/C][C]-4.4188[/C][C]1.2e-05[/C][/ROW]
[ROW][C]3[/C][C]0.100938[/C][C]1.049[/C][C]0.148265[/C][/ROW]
[ROW][C]4[/C][C]0.043404[/C][C]0.4511[/C][C]0.326422[/C][/ROW]
[ROW][C]5[/C][C]0.027897[/C][C]0.2899[/C][C]0.386217[/C][/ROW]
[ROW][C]6[/C][C]0.063363[/C][C]0.6585[/C][C]0.255812[/C][/ROW]
[ROW][C]7[/C][C]-0.112781[/C][C]-1.172[/C][C]0.121878[/C][/ROW]
[ROW][C]8[/C][C]0.003628[/C][C]0.0377[/C][C]0.484996[/C][/ROW]
[ROW][C]9[/C][C]-0.009326[/C][C]-0.0969[/C][C]0.461486[/C][/ROW]
[ROW][C]10[/C][C]-0.038415[/C][C]-0.3992[/C][C]0.34526[/C][/ROW]
[ROW][C]11[/C][C]-0.061296[/C][C]-0.637[/C][C]0.262733[/C][/ROW]
[ROW][C]12[/C][C]-0.027823[/C][C]-0.2891[/C][C]0.386511[/C][/ROW]
[ROW][C]13[/C][C]-0.050927[/C][C]-0.5292[/C][C]0.298859[/C][/ROW]
[ROW][C]14[/C][C]-0.009175[/C][C]-0.0953[/C][C]0.462108[/C][/ROW]
[ROW][C]15[/C][C]0.124811[/C][C]1.2971[/C][C]0.098685[/C][/ROW]
[ROW][C]16[/C][C]0.101813[/C][C]1.0581[/C][C]0.146191[/C][/ROW]
[ROW][C]17[/C][C]0.0618[/C][C]0.6422[/C][C]0.261037[/C][/ROW]
[ROW][C]18[/C][C]0.06786[/C][C]0.7052[/C][C]0.241097[/C][/ROW]
[ROW][C]19[/C][C]-0.054585[/C][C]-0.5673[/C][C]0.285857[/C][/ROW]
[ROW][C]20[/C][C]-0.180906[/C][C]-1.88[/C][C]0.031399[/C][/ROW]
[ROW][C]21[/C][C]0.080883[/C][C]0.8406[/C][C]0.201226[/C][/ROW]
[ROW][C]22[/C][C]0.167985[/C][C]1.7458[/C][C]0.041849[/C][/ROW]
[ROW][C]23[/C][C]-0.088938[/C][C]-0.9243[/C][C]0.178702[/C][/ROW]
[ROW][C]24[/C][C]-0.190963[/C][C]-1.9845[/C][C]0.024866[/C][/ROW]
[ROW][C]25[/C][C]-0.014624[/C][C]-0.152[/C][C]0.439745[/C][/ROW]
[ROW][C]26[/C][C]-0.053372[/C][C]-0.5547[/C][C]0.290136[/C][/ROW]
[ROW][C]27[/C][C]-0.043087[/C][C]-0.4478[/C][C]0.327606[/C][/ROW]
[ROW][C]28[/C][C]-0.092933[/C][C]-0.9658[/C][C]0.168155[/C][/ROW]
[ROW][C]29[/C][C]0.009501[/C][C]0.0987[/C][C]0.460763[/C][/ROW]
[ROW][C]30[/C][C]0.034105[/C][C]0.3544[/C][C]0.361852[/C][/ROW]
[ROW][C]31[/C][C]0.028398[/C][C]0.2951[/C][C]0.384236[/C][/ROW]
[ROW][C]32[/C][C]0.086896[/C][C]0.9031[/C][C]0.184254[/C][/ROW]
[ROW][C]33[/C][C]-0.024311[/C][C]-0.2526[/C][C]0.40051[/C][/ROW]
[ROW][C]34[/C][C]-0.029374[/C][C]-0.3053[/C][C]0.380377[/C][/ROW]
[ROW][C]35[/C][C]-0.058116[/C][C]-0.604[/C][C]0.273568[/C][/ROW]
[ROW][C]36[/C][C]0.051327[/C][C]0.5334[/C][C]0.297425[/C][/ROW]
[/TABLE]
Source: https://freestatistics.org/blog/index.php?pk=65650&T=2

Globally Unique Identifier (entire table): ba.freestatistics.org/blog/index.php?pk=65650&T=2

As an alternative you can also use a QR Code:  

The GUIDs for individual cells are displayed in the table below:

Partial Autocorrelation Function
Time lag kPACF(k)T-STATP-value
10.9153629.51270
2-0.425203-4.41881.2e-05
30.1009381.0490.148265
40.0434040.45110.326422
50.0278970.28990.386217
60.0633630.65850.255812
7-0.112781-1.1720.121878
80.0036280.03770.484996
9-0.009326-0.09690.461486
10-0.038415-0.39920.34526
11-0.061296-0.6370.262733
12-0.027823-0.28910.386511
13-0.050927-0.52920.298859
14-0.009175-0.09530.462108
150.1248111.29710.098685
160.1018131.05810.146191
170.06180.64220.261037
180.067860.70520.241097
19-0.054585-0.56730.285857
20-0.180906-1.880.031399
210.0808830.84060.201226
220.1679851.74580.041849
23-0.088938-0.92430.178702
24-0.190963-1.98450.024866
25-0.014624-0.1520.439745
26-0.053372-0.55470.290136
27-0.043087-0.44780.327606
28-0.092933-0.96580.168155
290.0095010.09870.460763
300.0341050.35440.361852
310.0283980.29510.384236
320.0868960.90310.184254
33-0.024311-0.25260.40051
34-0.029374-0.30530.380377
35-0.058116-0.6040.273568
360.0513270.53340.297425


Parameters (Session):
par1 = 36 ; par2 = 1 ; par3 = 0 ; par4 = 0 ; par5 = 12 ; par6 = White Noise ; par7 = 0.95 ;
Parameters (R input):
par1 = 36 ; par2 = 1 ; par3 = 0 ; par4 = 0 ; par5 = 12 ; par6 = White Noise ; par7 = 0.95 ;
R code (references can be found in the software module):
if (par1 == 'Default') {
par1 = 10*log10(length(x))
} else {
par1 <- as.numeric(par1)
}
par2 <- as.numeric(par2)
par3 <- as.numeric(par3)
par4 <- as.numeric(par4)
par5 <- as.numeric(par5)
if (par6 == 'White Noise') par6 <- 'white' else par6 <- 'ma'
par7 <- as.numeric(par7)
if (par2 == 0) {
x <- log(x)
} else {
x <- (x ^ par2 - 1) / par2
}
if (par3 > 0) x <- diff(x,lag=1,difference=par3)
if (par4 > 0) x <- diff(x,lag=par5,difference=par4)
bitmap(file='pic1.png')
racf <- acf(x, par1, main='Autocorrelation', xlab='time lag', ylab='ACF', ci.type=par6, ci=par7, sub=paste('(lambda=',par2,', d=',par3,', D=',par4,', CI=', par7, ', CI type=',par6,')',sep=''))
dev.off()
bitmap(file='pic2.png')
rpacf <- pacf(x,par1,main='Partial Autocorrelation',xlab='lags',ylab='PACF')
dev.off()
(myacf <- c(racf$acf))
(mypacf <- c(rpacf$acf))
lengthx <- length(x)
sqrtn <- sqrt(lengthx)
load(file='createtable')
a<-table.start()
a<-table.row.start(a)
a<-table.element(a,'Autocorrelation Function',4,TRUE)
a<-table.row.end(a)
a<-table.row.start(a)
a<-table.element(a,'Time lag k',header=TRUE)
a<-table.element(a,hyperlink('basics.htm','ACF(k)','click here for more information about the Autocorrelation Function'),header=TRUE)
a<-table.element(a,'T-STAT',header=TRUE)
a<-table.element(a,'P-value',header=TRUE)
a<-table.row.end(a)
for (i in 2:(par1+1)) {
a<-table.row.start(a)
a<-table.element(a,i-1,header=TRUE)
a<-table.element(a,round(myacf[i],6))
mytstat <- myacf[i]*sqrtn
a<-table.element(a,round(mytstat,4))
a<-table.element(a,round(1-pt(abs(mytstat),lengthx),6))
a<-table.row.end(a)
}
a<-table.end(a)
table.save(a,file='mytable.tab')
a<-table.start()
a<-table.row.start(a)
a<-table.element(a,'Partial Autocorrelation Function',4,TRUE)
a<-table.row.end(a)
a<-table.row.start(a)
a<-table.element(a,'Time lag k',header=TRUE)
a<-table.element(a,hyperlink('basics.htm','PACF(k)','click here for more information about the Partial Autocorrelation Function'),header=TRUE)
a<-table.element(a,'T-STAT',header=TRUE)
a<-table.element(a,'P-value',header=TRUE)
a<-table.row.end(a)
for (i in 1:par1) {
a<-table.row.start(a)
a<-table.element(a,i,header=TRUE)
a<-table.element(a,round(mypacf[i],6))
mytstat <- mypacf[i]*sqrtn
a<-table.element(a,round(mytstat,4))
a<-table.element(a,round(1-pt(abs(mytstat),lengthx),6))
a<-table.row.end(a)
}
a<-table.end(a)
table.save(a,file='mytable1.tab')