| Multiple Linear Regression - Estimated Regression Equation |
| dzcg [t] = + 73.0540796720188 + 0.375438742885250indcvtr[t] -0.945885178776373M1[t] -1.64405098611014M2[t] -5.37718976178765M3[t] -4.65506570895697M4[t] -4.49522228468367M5[t] -3.50292231747594M6[t] -2.62948203598951M7[t] -1.57402395445389M8[t] + 1.07397758414728M9[t] + 0.96627755135502M10[t] + 0.370419404234882M11[t] -0.316861224322489t + e[t] |
| Multiple Linear Regression - Ordinary Least Squares | |||||
| Variable | Parameter | S.D. | T-STAT H0: parameter = 0 | 2-tail p-value | 1-tail p-value |
| (Intercept) | 73.0540796720188 | 3.390463 | 21.5469 | 0 | 0 |
| indcvtr | 0.375438742885250 | 0.135013 | 2.7808 | 0.008672 | 0.004336 |
| M1 | -0.945885178776373 | 2.690222 | -0.3516 | 0.727245 | 0.363623 |
| M2 | -1.64405098611014 | 2.858771 | -0.5751 | 0.568909 | 0.284455 |
| M3 | -5.37718976178765 | 2.853064 | -1.8847 | 0.067795 | 0.033898 |
| M4 | -4.65506570895697 | 2.878969 | -1.6169 | 0.114874 | 0.057437 |
| M5 | -4.49522228468367 | 2.920227 | -1.5393 | 0.132714 | 0.066357 |
| M6 | -3.50292231747594 | 2.887808 | -1.213 | 0.233252 | 0.116626 |
| M7 | -2.62948203598951 | 2.867072 | -0.9171 | 0.365351 | 0.182675 |
| M8 | -1.57402395445389 | 2.831958 | -0.5558 | 0.581878 | 0.290939 |
| M9 | 1.07397758414728 | 2.831257 | 0.3793 | 0.706735 | 0.353368 |
| M10 | 0.96627755135502 | 2.826429 | 0.3419 | 0.734491 | 0.367246 |
| M11 | 0.370419404234882 | 2.826346 | 0.1311 | 0.896479 | 0.448239 |
| t | -0.316861224322489 | 0.041304 | -7.6715 | 0 | 0 |
| Multiple Linear Regression - Regression Statistics | |
| Multiple R | 0.817128880961067 |
| R-squared | 0.667699608100686 |
| Adjusted R-squared | 0.544273748252369 |
| F-TEST (value) | 5.40972215159165 |
| F-TEST (DF numerator) | 13 |
| F-TEST (DF denominator) | 35 |
| p-value | 3.20959232342766e-05 |
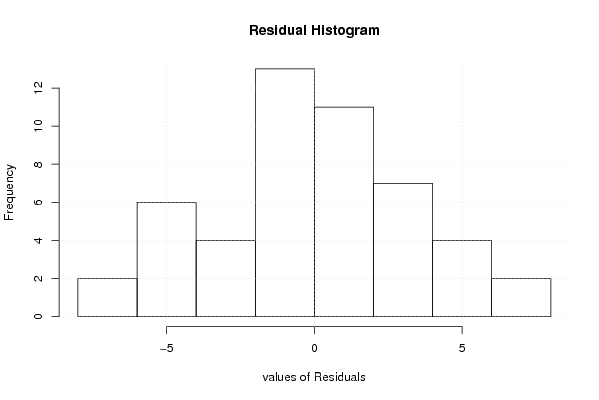
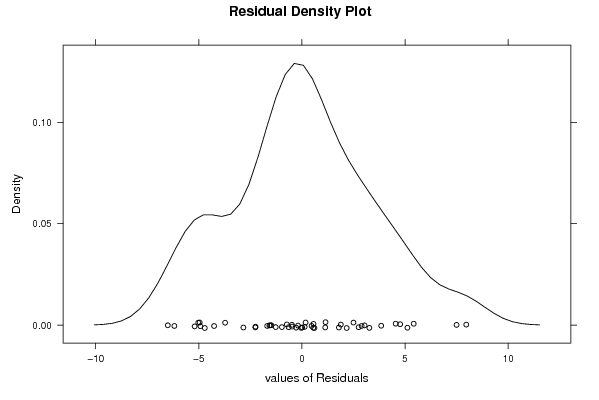
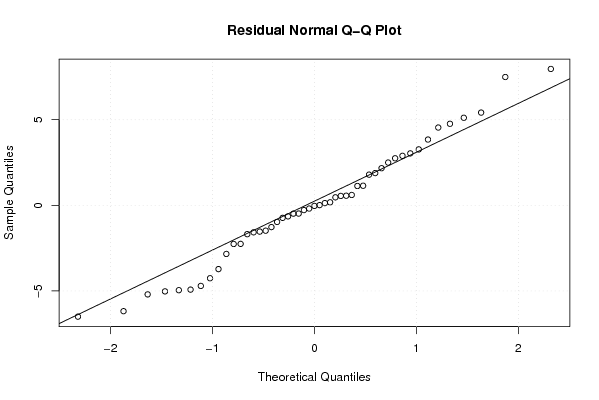
| Multiple Linear Regression - Residual Statistics | |
| Residual Standard Deviation | 3.99546612788487 |
| Sum Squared Residuals | 558.731235267637 |
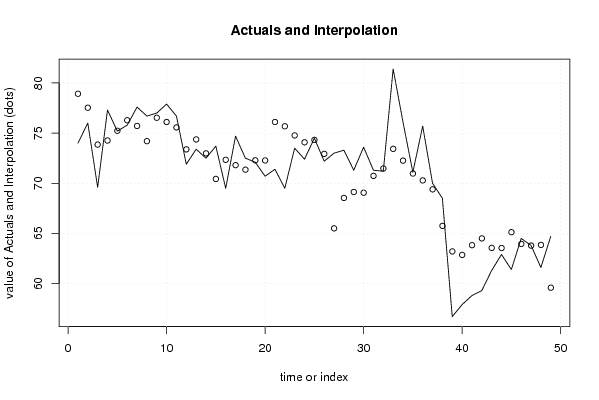
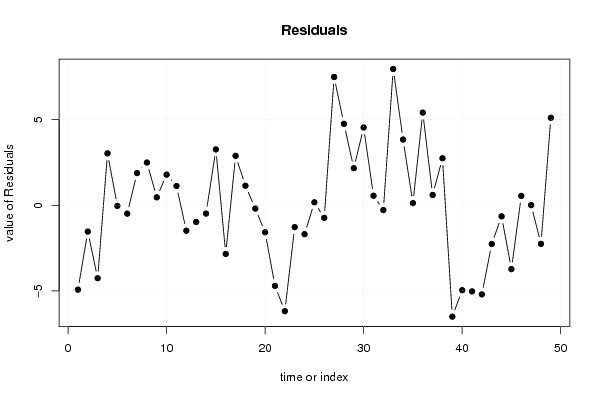
| Multiple Linear Regression - Actuals, Interpolation, and Residuals | |||
| Time or Index | Actuals | Interpolation Forecast | Residuals Prediction Error |
| 1 | 74 | 78.9246693837397 | -4.92466938373968 |
| 2 | 76 | 77.5342036091982 | -1.53420360919824 |
| 3 | 69.6 | 73.8596423520835 | -4.25964235208348 |
| 4 | 77.3 | 74.2649051805917 | 3.03509481940834 |
| 5 | 75.2 | 75.2342036091982 | -0.0342036091982328 |
| 6 | 75.8 | 76.2850810949687 | -0.485081094968731 |
| 7 | 77.6 | 75.715343923477 | 1.88465607652308 |
| 8 | 76.7 | 74.2013083233786 | 2.49869167662145 |
| 9 | 77 | 76.5324486376572 | 0.467551362342768 |
| 10 | 77.9 | 76.1078873805425 | 1.79211261945753 |
| 11 | 76.7 | 75.5706067519851 | 1.12939324801490 |
| 12 | 71.9 | 73.3815711518867 | -1.48157115188673 |
| 13 | 73.4 | 74.3714572060994 | -0.97145720609937 |
| 14 | 72.5 | 72.9809914315579 | -0.480991431557864 |
| 15 | 73.7 | 70.4327464030989 | 3.26725359690113 |
| 16 | 69.5 | 72.339764203148 | -2.83976420314806 |
| 17 | 74.7 | 71.8073076602136 | 2.89269233978639 |
| 18 | 72.5 | 71.3564301744431 | 1.14356982555688 |
| 19 | 72.1 | 72.2884479744923 | -0.188447974492308 |
| 20 | 70.7 | 72.276167345935 | -1.57616734593493 |
| 21 | 71.4 | 76.1090626317546 | -4.70906263175462 |
| 22 | 69.5 | 75.6845013746399 | -6.18450137463987 |
| 23 | 73.5 | 74.7717820031972 | -1.27178200319724 |
| 24 | 72.4 | 74.0845013746399 | -1.68450137463987 |
| 25 | 74.5 | 74.323509943082 | 0.176490056917981 |
| 26 | 72.2 | 72.9330441685405 | -0.733044168540507 |
| 27 | 73 | 65.5040954825733 | 7.49590451742674 |
| 28 | 73.3 | 68.5374295112782 | 4.7625704887218 |
| 29 | 71.3 | 69.1312891969995 | 2.16871080300049 |
| 30 | 73.6 | 69.0558504541142 | 4.54414954588574 |
| 31 | 71.3 | 70.738745739934 | 0.561254260066055 |
| 32 | 71.2 | 71.4773425971471 | -0.277342597147069 |
| 33 | 81.4 | 73.4330441685405 | 7.9669558314595 |
| 34 | 76.1 | 72.2576054256553 | 3.84239457434474 |
| 35 | 71.1 | 70.9694473113274 | 0.130552688672616 |
| 36 | 75.7 | 70.28216668277 | 5.41783331722999 |
| 37 | 70 | 69.3948590225564 | 0.605140977443599 |
| 38 | 68.5 | 65.7517607907034 | 2.74823920929661 |
| 39 | 56.7 | 63.2035157622444 | -6.50351576224439 |
| 40 | 57.9 | 62.8579011049821 | -4.95790110498208 |
| 41 | 58.8 | 63.8271995335886 | -5.02719953358865 |
| 42 | 59.3 | 64.5026382764739 | -5.20263827647389 |
| 43 | 61.3 | 63.5574623620968 | -2.25746236209683 |
| 44 | 62.9 | 63.5451817335395 | -0.645181733539455 |
| 45 | 61.4 | 65.1254445620476 | -3.72544456204764 |
| 46 | 64.5 | 63.9500058191624 | 0.549994180837608 |
| 47 | 63.8 | 63.7881639334903 | 0.0118360665097318 |
| 48 | 61.6 | 63.8517607907034 | -2.25176079070339 |
| 49 | 64.7 | 59.5855044445225 | 5.11449555547747 |
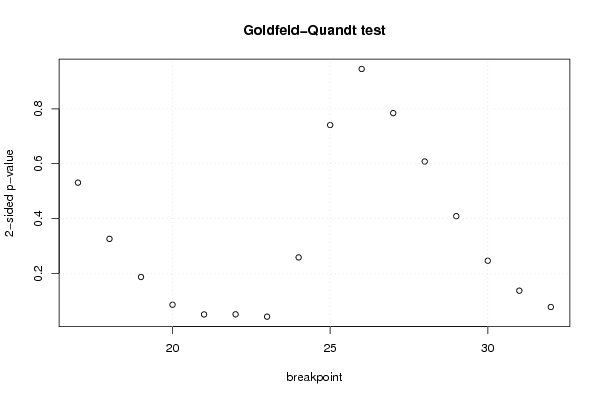
| Goldfeld-Quandt test for Heteroskedasticity | |||
| p-values | Alternative Hypothesis | ||
| breakpoint index | greater | 2-sided | less |
| 17 | 0.265526771095192 | 0.531053542190385 | 0.734473228904808 |
| 18 | 0.163134891226226 | 0.326269782452453 | 0.836865108773774 |
| 19 | 0.0935824941812555 | 0.187164988362511 | 0.906417505818744 |
| 20 | 0.043011712510934 | 0.086023425021868 | 0.956988287489066 |
| 21 | 0.0254152635324044 | 0.0508305270648087 | 0.974584736467596 |
| 22 | 0.0256095590361038 | 0.0512191180722077 | 0.974390440963896 |
| 23 | 0.0213549643215612 | 0.0427099286431225 | 0.978645035678439 |
| 24 | 0.129352794100378 | 0.258705588200757 | 0.870647205899622 |
| 25 | 0.370508848077113 | 0.741017696154227 | 0.629491151922887 |
| 26 | 0.472733267231004 | 0.945466534462007 | 0.527266732768996 |
| 27 | 0.392267674779399 | 0.784535349558799 | 0.6077323252206 |
| 28 | 0.30406249341239 | 0.60812498682478 | 0.69593750658761 |
| 29 | 0.204483099359585 | 0.408966198719171 | 0.795516900640415 |
| 30 | 0.123265184250112 | 0.246530368500224 | 0.876734815749888 |
| 31 | 0.0686951103552195 | 0.137390220710439 | 0.93130488964478 |
| 32 | 0.0389355162170832 | 0.0778710324341663 | 0.961064483782917 |
| Meta Analysis of Goldfeld-Quandt test for Heteroskedasticity | |||
| Description | # significant tests | % significant tests | OK/NOK |
| 1% type I error level | 0 | 0 | OK |
| 5% type I error level | 1 | 0.0625 | NOK |
| 10% type I error level | 5 | 0.3125 | NOK |