| Multiple Linear Regression - Estimated Regression Equation |
| USDOLLAR[t] = + 0.73519855173591 + 0.0825943778864721Amerikaanse_inflatie[t] + 0.00136131812051283t + e[t] |
| Multiple Linear Regression - Ordinary Least Squares | |||||
| Variable | Parameter | S.D. | T-STAT H0: parameter = 0 | 2-tail p-value | 1-tail p-value |
| (Intercept) | 0.73519855173591 | 0.019125 | 38.4426 | 0 | 0 |
| Amerikaanse_inflatie | 0.0825943778864721 | 0.019896 | 4.1513 | 0.000114 | 5.7e-05 |
| t | 0.00136131812051283 | 0.000523 | 2.6011 | 0.011863 | 0.005932 |
| Multiple Linear Regression - Regression Statistics | |
| Multiple R | 0.520729865010518 |
| R-squared | 0.271159592313872 |
| Adjusted R-squared | 0.245129577753653 |
| F-TEST (value) | 10.4171894213336 |
| F-TEST (DF numerator) | 2 |
| F-TEST (DF denominator) | 56 |
| p-value | 0.000142465066987896 |
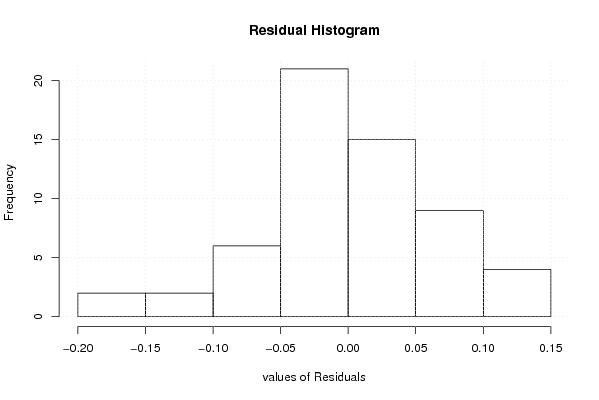
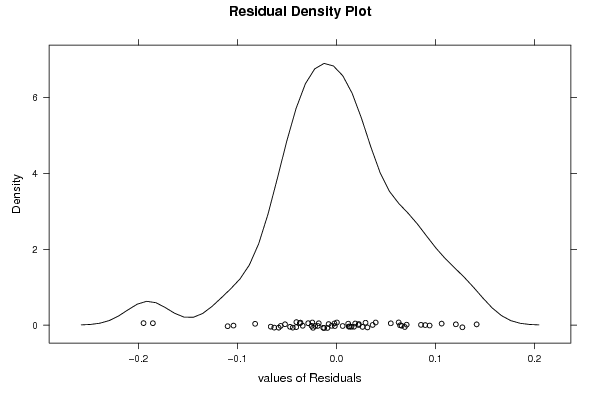
| Multiple Linear Regression - Residual Statistics | |
| Residual Standard Deviation | 0.0673810400075746 |
| Sum Squared Residuals | 0.254251454940132 |
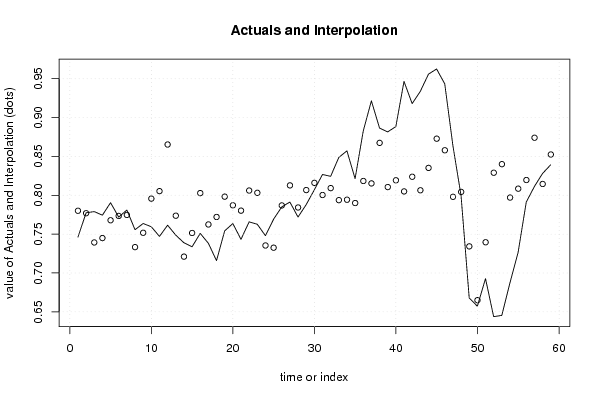
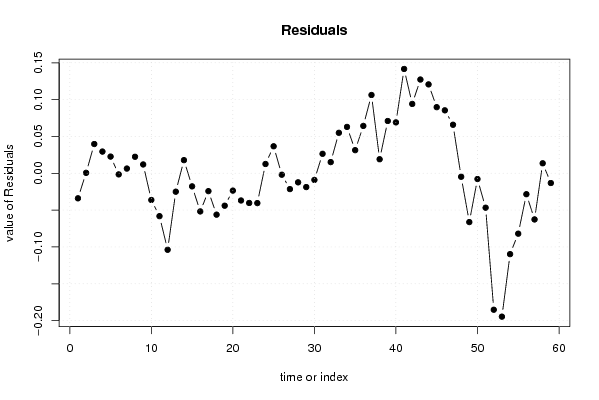
| Multiple Linear Regression - Actuals, Interpolation, and Residuals | |||
| Time or Index | Actuals | Interpolation Forecast | Residuals Prediction Error |
| 1 | 0.7461 | 0.78008710700259 | -0.0339871070025906 |
| 2 | 0.7775 | 0.77690573433935 | 0.000594265660650347 |
| 3 | 0.779 | 0.739282506097448 | 0.0397174939025523 |
| 4 | 0.7744 | 0.744938731868057 | 0.0294612681319429 |
| 5 | 0.7905 | 0.767857182616939 | 0.0226428173830608 |
| 6 | 0.7719 | 0.773430814009662 | -0.00153081400966201 |
| 7 | 0.7811 | 0.774709537752288 | 0.00639046224771163 |
| 8 | 0.7557 | 0.733286968127609 | 0.0224130318723914 |
| 9 | 0.7637 | 0.751745322470621 | 0.0119546775293788 |
| 10 | 0.7595 | 0.795725339580554 | -0.0362253395805537 |
| 11 | 0.7471 | 0.805346095489714 | -0.0582460954897137 |
| 12 | 0.7615 | 0.865349421909622 | -0.103849421909622 |
| 13 | 0.7487 | 0.773709470529967 | -0.0250094705299669 |
| 14 | 0.7389 | 0.721054065512727 | 0.017845934487273 |
| 15 | 0.7337 | 0.751488604649278 | -0.017788604649278 |
| 16 | 0.751 | 0.802819521391106 | -0.0518195213911065 |
| 17 | 0.7382 | 0.762470678678951 | -0.0242706786789509 |
| 18 | 0.7159 | 0.772091434588111 | -0.056191434588111 |
| 19 | 0.7542 | 0.798231066074565 | -0.0440310660745654 |
| 20 | 0.7636 | 0.787120633134221 | -0.0235206331342210 |
| 21 | 0.7433 | 0.780222513466087 | -0.0369225134660866 |
| 22 | 0.7658 | 0.806114361818882 | -0.0403143618188815 |
| 23 | 0.7627 | 0.803180772289298 | -0.0404807722892978 |
| 24 | 0.748 | 0.735410596118834 | 0.0125894038811665 |
| 25 | 0.7692 | 0.732559600967136 | 0.0366403990328637 |
| 26 | 0.785 | 0.786946509690764 | -0.00194650969076417 |
| 27 | 0.7913 | 0.812755763665673 | -0.0214557636656728 |
| 28 | 0.772 | 0.784300511369169 | -0.0123005113691691 |
| 29 | 0.788 | 0.806723395850732 | -0.0187233958507323 |
| 30 | 0.807 | 0.816013774248347 | -0.00901377424834646 |
| 31 | 0.8268 | 0.800360650524246 | 0.0264393494757539 |
| 32 | 0.8244 | 0.809238057032428 | 0.0151619429675721 |
| 33 | 0.8487 | 0.7937501220641 | 0.0549498779358996 |
| 34 | 0.8572 | 0.794285496405749 | 0.0629145035942515 |
| 35 | 0.8214 | 0.790030396829981 | 0.0313696031700188 |
| 36 | 0.8827 | 0.81840007651937 | 0.0642999234806296 |
| 37 | 0.9216 | 0.815301298234014 | 0.106298701765986 |
| 38 | 0.8865 | 0.867458158754707 | 0.0190418412452930 |
| 39 | 0.8816 | 0.810590440465257 | 0.0710095595347431 |
| 40 | 0.8884 | 0.819302658217666 | 0.0690973417823342 |
| 41 | 0.9466 | 0.804971044539749 | 0.141628955460251 |
| 42 | 0.918 | 0.823842370772194 | 0.0941576292278062 |
| 43 | 0.9337 | 0.806454765112477 | 0.127245234887522 |
| 44 | 0.9559 | 0.8352374166913 | 0.120662583308701 |
| 45 | 0.9626 | 0.872857666703973 | 0.0897423332960269 |
| 46 | 0.9434 | 0.85794789238085 | 0.085452107619149 |
| 47 | 0.8639 | 0.798024182109601 | 0.0658758178903985 |
| 48 | 0.7996 | 0.804341162903303 | -0.00474116290330264 |
| 49 | 0.668 | 0.734258344152017 | -0.0662583441520171 |
| 50 | 0.6572 | 0.665001469179596 | -0.0078014691795963 |
| 51 | 0.6928 | 0.739541406107523 | -0.0467414061075234 |
| 52 | 0.6438 | 0.829030925432902 | -0.185230925432902 |
| 53 | 0.6454 | 0.840055785766132 | -0.194655785766132 |
| 54 | 0.6873 | 0.79706392296161 | -0.109763922961609 |
| 55 | 0.7265 | 0.808501755184272 | -0.0820017551842717 |
| 56 | 0.7912 | 0.819609209895388 | -0.0284092098953882 |
| 57 | 0.8114 | 0.874078712996903 | -0.0626787129969026 |
| 58 | 0.8281 | 0.814567974615086 | 0.0135320253849144 |
| 59 | 0.8393 | 0.852518602139306 | -0.0132186021393054 |
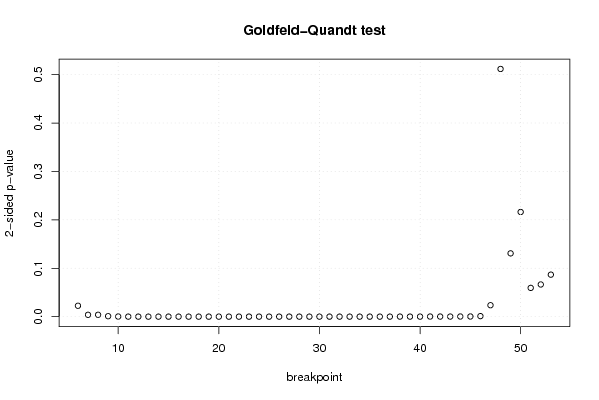
| Goldfeld-Quandt test for Heteroskedasticity | |||
| p-values | Alternative Hypothesis | ||
| breakpoint index | greater | 2-sided | less |
| 6 | 0.0112561925884675 | 0.0225123851769350 | 0.988743807411532 |
| 7 | 0.00187864610064451 | 0.00375729220128901 | 0.998121353899355 |
| 8 | 0.00192330556487978 | 0.00384661112975957 | 0.99807669443512 |
| 9 | 0.000470559354112788 | 0.000941118708225577 | 0.999529440645887 |
| 10 | 0.000113445670160821 | 0.000226891340321642 | 0.99988655432984 |
| 11 | 3.19012077812098e-05 | 6.38024155624197e-05 | 0.999968098792219 |
| 12 | 9.1659266711945e-06 | 1.8331853342389e-05 | 0.999990834073329 |
| 13 | 2.14544409821765e-06 | 4.2908881964353e-06 | 0.999997854555902 |
| 14 | 5.75016070173572e-07 | 1.15003214034714e-06 | 0.99999942498393 |
| 15 | 1.39596006816896e-07 | 2.79192013633791e-07 | 0.999999860403993 |
| 16 | 3.04273871867666e-08 | 6.08547743735332e-08 | 0.999999969572613 |
| 17 | 5.26010318655923e-09 | 1.05202063731185e-08 | 0.999999994739897 |
| 18 | 3.18241273030716e-09 | 6.36482546061432e-09 | 0.999999996817587 |
| 19 | 1.76204553860701e-09 | 3.52409107721402e-09 | 0.999999998237954 |
| 20 | 2.01403204877270e-09 | 4.02806409754541e-09 | 0.999999997985968 |
| 21 | 5.16492348743025e-10 | 1.03298469748605e-09 | 0.999999999483508 |
| 22 | 5.4595341287835e-10 | 1.0919068257567e-09 | 0.999999999454047 |
| 23 | 3.81698545046685e-10 | 7.6339709009337e-10 | 0.999999999618301 |
| 24 | 1.04339420891356e-10 | 2.08678841782713e-10 | 0.99999999989566 |
| 25 | 9.70772999086574e-11 | 1.94154599817315e-10 | 0.999999999902923 |
| 26 | 2.28630121975507e-10 | 4.57260243951013e-10 | 0.99999999977137 |
| 27 | 5.45065724579488e-10 | 1.09013144915898e-09 | 0.999999999454934 |
| 28 | 2.88334709169426e-10 | 5.76669418338851e-10 | 0.999999999711665 |
| 29 | 3.81564707581058e-10 | 7.63129415162116e-10 | 0.999999999618435 |
| 30 | 1.44863815768873e-09 | 2.89727631537746e-09 | 0.999999998551362 |
| 31 | 1.10390692842310e-08 | 2.20781385684621e-08 | 0.99999998896093 |
| 32 | 3.37380789579229e-08 | 6.74761579158459e-08 | 0.999999966261921 |
| 33 | 2.02265922970327e-07 | 4.04531845940654e-07 | 0.999999797734077 |
| 34 | 7.06410413042676e-07 | 1.41282082608535e-06 | 0.999999293589587 |
| 35 | 6.07190627933956e-07 | 1.21438125586791e-06 | 0.999999392809372 |
| 36 | 2.67094607662653e-06 | 5.34189215325305e-06 | 0.999997329053923 |
| 37 | 2.45351208124863e-05 | 4.90702416249726e-05 | 0.999975464879188 |
| 38 | 4.89655028191778e-05 | 9.79310056383556e-05 | 0.99995103449718 |
| 39 | 4.28792476847373e-05 | 8.57584953694745e-05 | 0.999957120752315 |
| 40 | 3.59110748686737e-05 | 7.18221497373473e-05 | 0.999964088925131 |
| 41 | 0.000117376416778554 | 0.000234752833557108 | 0.999882623583221 |
| 42 | 8.1067559388506e-05 | 0.000162135118777012 | 0.999918932440611 |
| 43 | 9.99924346771229e-05 | 0.000199984869354246 | 0.999900007565323 |
| 44 | 0.000156543540395108 | 0.000313087080790216 | 0.999843456459605 |
| 45 | 0.00016667472023652 | 0.00033334944047304 | 0.999833325279764 |
| 46 | 0.000543688507653075 | 0.00108737701530615 | 0.999456311492347 |
| 47 | 0.0118118038172708 | 0.0236236076345415 | 0.98818819618273 |
| 48 | 0.744104109856292 | 0.511791780287417 | 0.255895890143708 |
| 49 | 0.934600714809191 | 0.130798570381617 | 0.0653992851908086 |
| 50 | 0.89187830419828 | 0.216243391603441 | 0.108121695801721 |
| 51 | 0.970283909789696 | 0.0594321804206087 | 0.0297160902103043 |
| 52 | 0.966751479120626 | 0.0664970417587479 | 0.0332485208793740 |
| 53 | 0.956620244403278 | 0.086759511193444 | 0.043379755596722 |
| Meta Analysis of Goldfeld-Quandt test for Heteroskedasticity | |||
| Description | # significant tests | % significant tests | OK/NOK |
| 1% type I error level | 40 | 0.833333333333333 | NOK |
| 5% type I error level | 42 | 0.875 | NOK |
| 10% type I error level | 45 | 0.9375 | NOK |