| Multiple Linear Regression - Estimated Regression Equation |
| USDOLLAR[t] = + 0.139527755525393 + 0.0131669901810773Amerikaanse_inflatie[t] + 1.04991533179280`Y[t-1]`[t] -0.239723305758452`Y[t-2]`[t] + 0.288489458849696`Y[t-3]`[t] -0.287960825487985`Y[t-4]`[t] + 0.000313710754245402t + e[t] |
| Multiple Linear Regression - Ordinary Least Squares | |||||
| Variable | Parameter | S.D. | T-STAT H0: parameter = 0 | 2-tail p-value | 1-tail p-value |
| (Intercept) | 0.139527755525393 | 0.047251 | 2.9529 | 0.004862 | 0.002431 |
| Amerikaanse_inflatie | 0.0131669901810773 | 0.012482 | 1.0549 | 0.296775 | 0.148387 |
| `Y[t-1]` | 1.04991533179280 | 0.157815 | 6.6528 | 0 | 0 |
| `Y[t-2]` | -0.239723305758452 | 0.208727 | -1.1485 | 0.256454 | 0.128227 |
| `Y[t-3]` | 0.288489458849696 | 0.208311 | 1.3849 | 0.172487 | 0.086244 |
| `Y[t-4]` | -0.287960825487985 | 0.136952 | -2.1026 | 0.040767 | 0.020384 |
| t | 0.000313710754245402 | 0.000282 | 1.1142 | 0.270734 | 0.135367 |
| Multiple Linear Regression - Regression Statistics | |
| Multiple R | 0.930948624007176 |
| R-squared | 0.866665340540855 |
| Adjusted R-squared | 0.849998508108461 |
| F-TEST (value) | 51.9994032493198 |
| F-TEST (DF numerator) | 6 |
| F-TEST (DF denominator) | 48 |
| p-value | 0 |
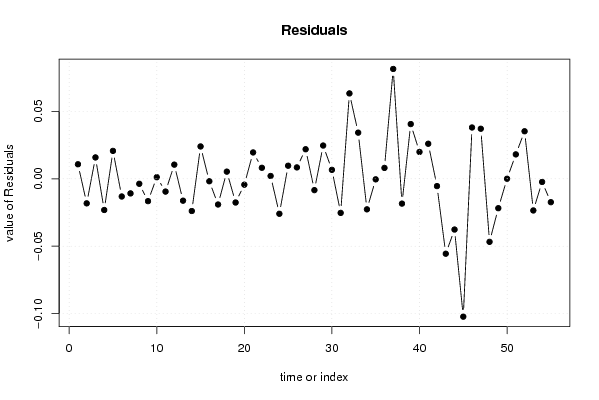
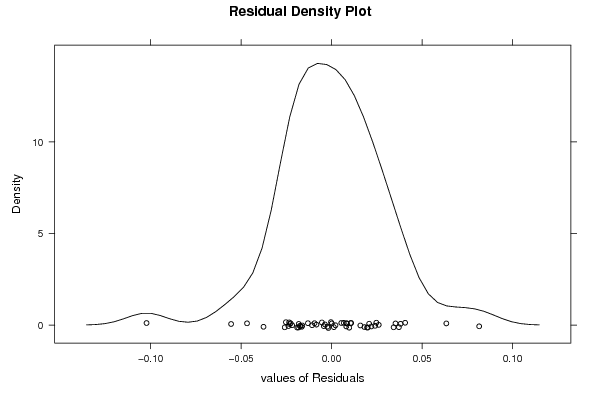
| Multiple Linear Regression - Residual Statistics | |
| Residual Standard Deviation | 0.0309802869114829 |
| Sum Squared Residuals | 0.0460693525016543 |
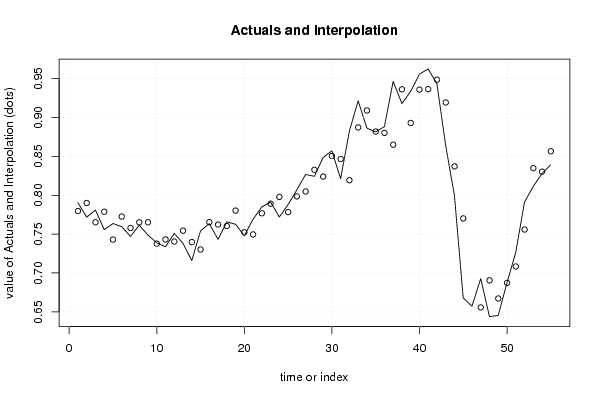
| Multiple Linear Regression - Actuals, Interpolation, and Residuals | |||
| Time or Index | Actuals | Interpolation Forecast | Residuals Prediction Error |
| 1 | 0.7905 | 0.779725694319876 | 0.0107743056801237 |
| 2 | 0.7719 | 0.79010804988966 | -0.0182080498896601 |
| 3 | 0.7811 | 0.765261630510727 | 0.0158383694892728 |
| 4 | 0.7557 | 0.7788422149755 | -0.0231422149755000 |
| 5 | 0.7637 | 0.743006115631753 | 0.0206938843682472 |
| 6 | 0.7595 | 0.772612462315535 | -0.0131124623155349 |
| 7 | 0.7471 | 0.757938569399019 | -0.0108385693990188 |
| 8 | 0.7615 | 0.765210851589976 | -0.00371085158997645 |
| 9 | 0.7487 | 0.765274538838477 | -0.0165745388384771 |
| 10 | 0.7389 | 0.737718272341742 | 0.00118172765825810 |
| 11 | 0.7337 | 0.743171014145352 | -0.00947101414535184 |
| 12 | 0.751 | 0.740501181669956 | 0.0104988183300437 |
| 13 | 0.7382 | 0.754434360682236 | -0.0162343606822362 |
| 14 | 0.7159 | 0.739800511921784 | -0.0239005119217841 |
| 15 | 0.7542 | 0.730207930075719 | 0.0239920699242812 |
| 16 | 0.7636 | 0.765416624884481 | -0.00181662488448086 |
| 17 | 0.7433 | 0.76235402176282 | -0.0190540217628200 |
| 18 | 0.7658 | 0.760482320973648 | 0.00531767902635243 |
| 19 | 0.7627 | 0.780283727607709 | -0.0175837276077088 |
| 20 | 0.748 | 0.752364987898034 | -0.00436498789803381 |
| 21 | 0.7692 | 0.749653186605066 | 0.0195468133949344 |
| 22 | 0.785 | 0.776828806788305 | 0.00817119321169461 |
| 23 | 0.7913 | 0.789198358310319 | 0.00210164168968107 |
| 24 | 0.772 | 0.797934624630793 | -0.0259346246307934 |
| 25 | 0.788 | 0.778285659100814 | 0.00971434089918577 |
| 26 | 0.807 | 0.798556408570309 | 0.00844359142969119 |
| 27 | 0.8268 | 0.804888538002807 | 0.0219114619971932 |
| 28 | 0.8244 | 0.83280750089713 | -0.00840750089713013 |
| 29 | 0.8487 | 0.824042753914452 | 0.0246572460855478 |
| 30 | 0.8572 | 0.850553908864224 | 0.00664609113577566 |
| 31 | 0.8214 | 0.846677269230563 | -0.0252772692305634 |
| 32 | 0.8827 | 0.819373368628111 | 0.063326631371889 |
| 33 | 0.9216 | 0.887372678438494 | 0.0342273215615064 |
| 34 | 0.8865 | 0.909155166274381 | -0.0226551662743812 |
| 35 | 0.8816 | 0.882002285590992 | -0.000402285590992284 |
| 36 | 0.8884 | 0.88032780272453 | 0.0080721972754696 |
| 37 | 0.9466 | 0.865126197681672 | 0.0814738023183285 |
| 38 | 0.918 | 0.936400090811753 | -0.0184000908117533 |
| 39 | 0.9337 | 0.893118156275547 | 0.0405818437244526 |
| 40 | 0.9559 | 0.935975017915483 | 0.019924982084517 |
| 41 | 0.9626 | 0.936603383258112 | 0.0259966167418883 |
| 42 | 0.9434 | 0.948800736394756 | -0.00540073639475557 |
| 43 | 0.8639 | 0.91946350094194 | -0.0555635009419402 |
| 44 | 0.7996 | 0.837241798748545 | -0.037641798748545 |
| 45 | 0.668 | 0.770246174828995 | -0.102246174828995 |
| 46 | 0.6572 | 0.619141395745574 | 0.0380586042544255 |
| 47 | 0.6928 | 0.655672574676964 | 0.0371274253230362 |
| 48 | 0.6438 | 0.690552129762691 | -0.0467521297626909 |
| 49 | 0.6454 | 0.667206335903917 | -0.0218063359039167 |
| 50 | 0.6873 | 0.687255881094275 | 4.41189057245569e-05 |
| 51 | 0.7265 | 0.70839647089251 | 0.0181035291074904 |
| 52 | 0.7912 | 0.755947824566191 | 0.0352521754338087 |
| 53 | 0.8114 | 0.834887249393154 | -0.0234872493931535 |
| 54 | 0.8281 | 0.830438308402549 | -0.00233830840254906 |
| 55 | 0.8393 | 0.856653374700077 | -0.0173533747000768 |
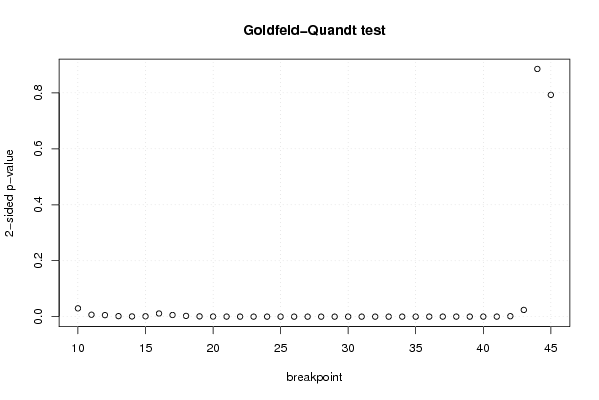
| Goldfeld-Quandt test for Heteroskedasticity | |||
| p-values | Alternative Hypothesis | ||
| breakpoint index | greater | 2-sided | less |
| 10 | 0.0148720786127371 | 0.0297441572254743 | 0.985127921387263 |
| 11 | 0.0034365448879983 | 0.0068730897759966 | 0.996563455112002 |
| 12 | 0.00274645967769676 | 0.00549291935539352 | 0.997253540322303 |
| 13 | 0.000929772450455636 | 0.00185954490091127 | 0.999070227549544 |
| 14 | 0.000389666045431158 | 0.000779332090862316 | 0.999610333954569 |
| 15 | 0.000686672427090172 | 0.00137334485418034 | 0.99931332757291 |
| 16 | 0.00563973997493733 | 0.0112794799498747 | 0.994360260025063 |
| 17 | 0.00291014923524618 | 0.00582029847049236 | 0.997089850764754 |
| 18 | 0.00130310843174608 | 0.00260621686349216 | 0.998696891568254 |
| 19 | 0.000526728749487952 | 0.00105345749897590 | 0.999473271250512 |
| 20 | 0.000206896638450005 | 0.000413793276900011 | 0.99979310336155 |
| 21 | 0.000103697666894941 | 0.000207395333789882 | 0.999896302333105 |
| 22 | 5.70047851863195e-05 | 0.000114009570372639 | 0.999942995214814 |
| 23 | 2.18351707291133e-05 | 4.36703414582265e-05 | 0.99997816482927 |
| 24 | 3.44205933863158e-05 | 6.88411867726315e-05 | 0.999965579406614 |
| 25 | 1.23135334506723e-05 | 2.46270669013445e-05 | 0.99998768646655 |
| 26 | 4.4286370856544e-06 | 8.8572741713088e-06 | 0.999995571362914 |
| 27 | 4.26316253765911e-06 | 8.52632507531822e-06 | 0.999995736837462 |
| 28 | 1.88595790230237e-06 | 3.77191580460475e-06 | 0.999998114042098 |
| 29 | 7.4244804893096e-07 | 1.48489609786192e-06 | 0.999999257551951 |
| 30 | 2.67996315944247e-07 | 5.35992631888494e-07 | 0.999999732003684 |
| 31 | 4.92154902185338e-06 | 9.84309804370676e-06 | 0.999995078450978 |
| 32 | 4.80042281665100e-06 | 9.60084563330199e-06 | 0.999995199577183 |
| 33 | 4.72741963992569e-06 | 9.45483927985138e-06 | 0.99999527258036 |
| 34 | 4.49525095946404e-06 | 8.99050191892808e-06 | 0.99999550474904 |
| 35 | 6.40247680715861e-06 | 1.28049536143172e-05 | 0.999993597523193 |
| 36 | 1.46747030998700e-05 | 2.93494061997401e-05 | 0.9999853252969 |
| 37 | 6.32555535813644e-05 | 0.000126511107162729 | 0.999936744446419 |
| 38 | 9.13370277169951e-05 | 0.000182674055433990 | 0.999908662972283 |
| 39 | 4.17358140832399e-05 | 8.34716281664798e-05 | 0.999958264185917 |
| 40 | 1.77411773282186e-05 | 3.54823546564373e-05 | 0.999982258822672 |
| 41 | 7.57318102174488e-05 | 0.000151463620434898 | 0.999924268189783 |
| 42 | 0.000796152187602797 | 0.00159230437520559 | 0.999203847812397 |
| 43 | 0.0119961203426487 | 0.0239922406852974 | 0.988003879657351 |
| 44 | 0.557270681108281 | 0.885458637783439 | 0.442729318891719 |
| 45 | 0.603668212019367 | 0.792663575961266 | 0.396331787980633 |
| Meta Analysis of Goldfeld-Quandt test for Heteroskedasticity | |||
| Description | # significant tests | % significant tests | OK/NOK |
| 1% type I error level | 31 | 0.861111111111111 | NOK |
| 5% type I error level | 34 | 0.944444444444444 | NOK |
| 10% type I error level | 34 | 0.944444444444444 | NOK |